| Param | Original file | Final file |
|---|---|---|
| Filename | modeM0/AS1G06_157T02_9000001008_07361cztM0_level2.evt | modeM0/AS1G06_157T02_9000001008_07361cztM0_level2_quad_clean.evt |
| Size (bytes) | 30,726,720 | 8,527,680 |
| Size | 29.3 MB | 8.1 MB |
| Events in quadrant A | 223,453 | 55,103 |
| Events in quadrant B | 235,015 | 61,311 |
| Events in quadrant C | 231,363 | 48,319 |
| Events in quadrant D | 206,659 | 53,603 |
| Mode M0 | |||
|---|---|---|---|
| Quadrant | BADHDUFLAG | Total packets | Discarded packets |
| A | 0 | 4124 | 3188 |
| B | 0 | 4047 | 3041 |
| C | 0 | 4797 | 3891 |
| D | 0 | 4133 | 3204 |
| Mode SS | |||
|---|---|---|---|
| Quadrant | BADHDUFLAG | Total packets | Discarded packets |
| A | 0 | 41 | 31 |
| B | 0 | 40 | 36 |
| C | 0 | 40 | 36 |
| D | 0 | 39 | 33 |
| Mode M9 | |||
|---|---|---|---|
| Quadrant | BADHDUFLAG | Total packets | Discarded packets |
| A | 1 | 251318637792 | 0 |
| B | 1 | -1 | -1 |
| C | 1 | -1 | -1 |
| D | 1 | -1 | -1 |
| Quadrant | Total seconds | Saturated seconds | Saturation percentage |
|---|---|---|---|
| A | 457 | 1 | 0.218818% |
| B | 497 | 2 | 0.402414% |
| C | 403 | 0 | 0.000000% |
| D | 454 | 1 | 0.220264% |
Noise dominated data is calculated using 1-second bins in cleaned event files. If a bin has >2000 counts, and if more than 50% of those come from <1% of pixels, then it is considered to be noise-dominated and hence unusable.
| Quadrant | # 1 sec bins | Bins with >0 counts | Bins with >2000 counts | High rate bins dominated by noise | Noise dominated (total time) | Noise dominated (detector-on time) | Marked lightcurve |
|---|---|---|---|---|---|---|---|
| A | 1327 | 663 | 0 | 0 | 0.00% | 0.00% | 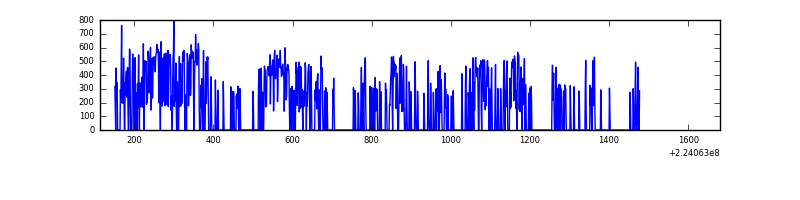 |
| B | 1417 | 730 | 0 | 0 | 0.00% | 0.00% | 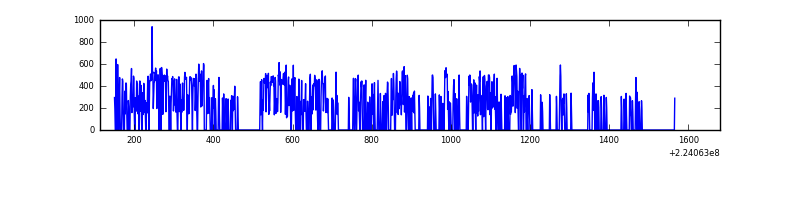 |
| C | 1567 | 607 | 0 | 0 | 0.00% | 0.00% | 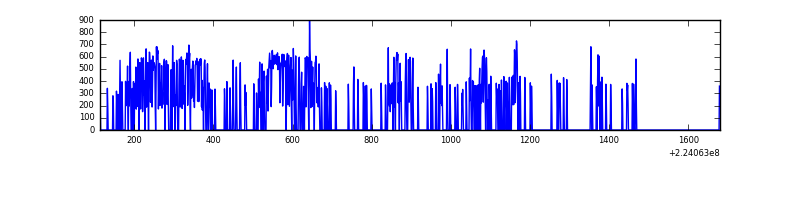 |
| D | 1431 | 688 | 0 | 0 | 0.00% | 0.00% | 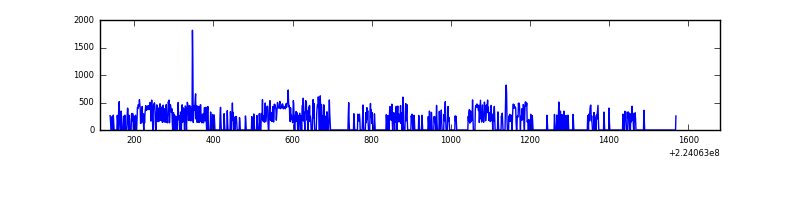 |
Top three noisy pixels from each quadrant. If the there are fewer than three noisy pixels in the level2.evt file, extra rows are filled as -1
| Pixel properties | Quadrant properties | ||||||
|---|---|---|---|---|---|---|---|
| Quadrant | DetID | PixID | Counts | Sigma | Mean | Median | Sigma |
| A | 15 | 234 | 20180 | 1563.11 | 52 | 51 | 12.9 |
| A | 13 | 248 | 737 | 53.27 | 52 | 51 | 12.9 |
| A | 3 | 1 | 599 | 42.55 | 52 | 51 | 12.9 |
| B | 0 | 214 | 2026 | 144.37 | 59 | 57 | 13.6 |
| B | 0 | 213 | 1520 | 107.27 | 59 | 57 | 13.6 |
| B | 0 | 219 | 1453 | 102.36 | 59 | 57 | 13.6 |
| C | 9 | 68 | 51440 | 4015.49 | 46 | 46 | 12.8 |
| C | 13 | 61 | 391 | 26.96 | 46 | 46 | 12.8 |
| C | 3 | 202 | 130 | 6.56 | 46 | 46 | 12.8 |
| D | 2 | 14 | 6295 | 438.55 | 51 | 49 | 14.2 |
| D | 2 | 216 | 5187 | 360.75 | 51 | 49 | 14.2 |
| D | 14 | 34 | 826 | 54.55 | 51 | 49 | 14.2 |
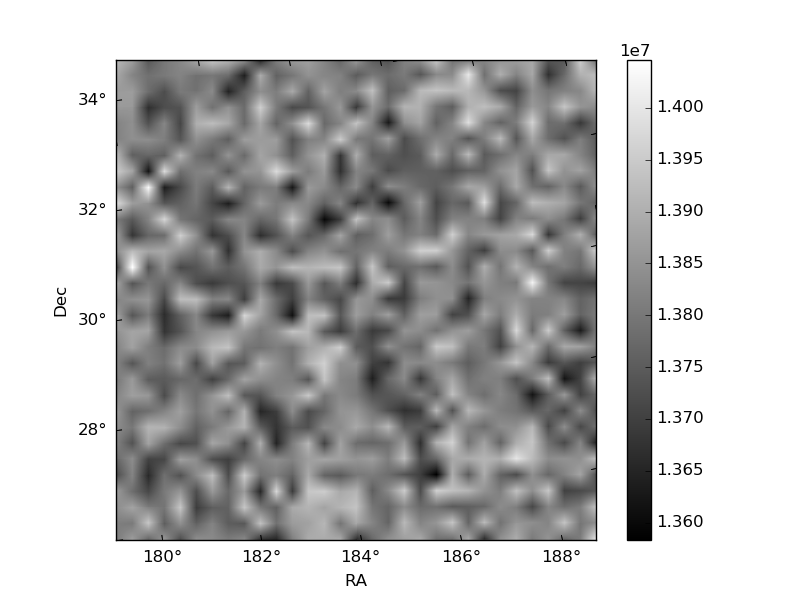
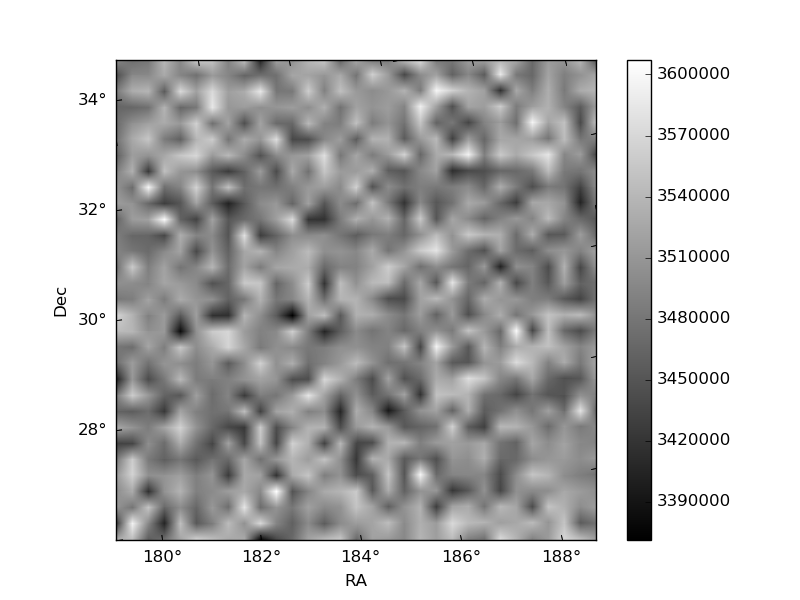
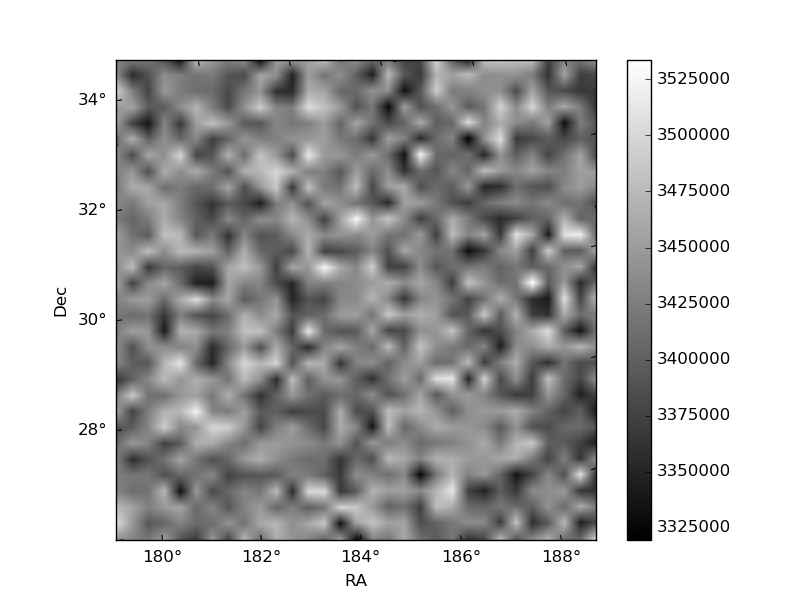
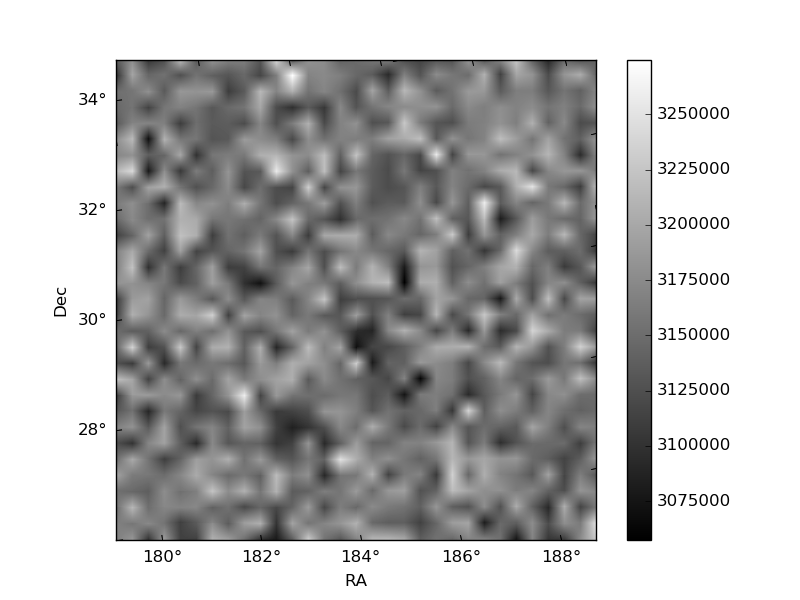
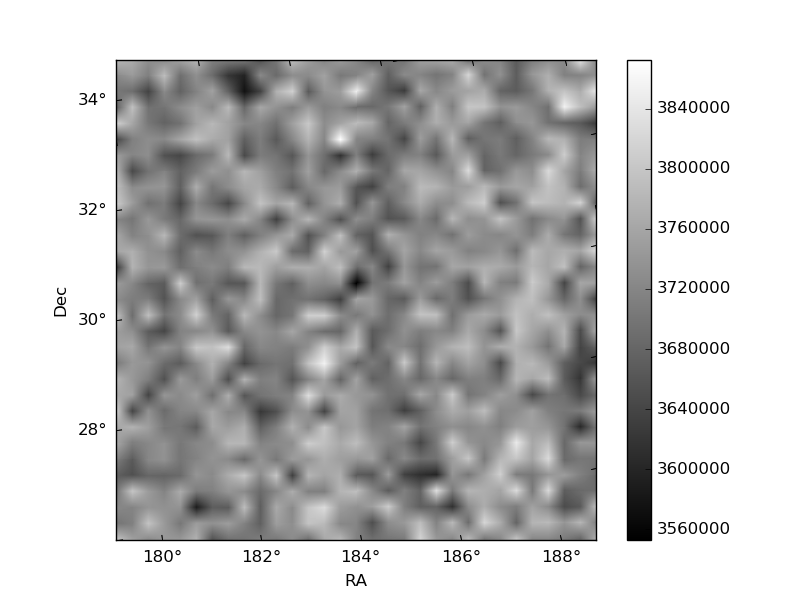
Histogram calculated using DETX and DETY for each event in the final _common_clean file
| Quadrant A | 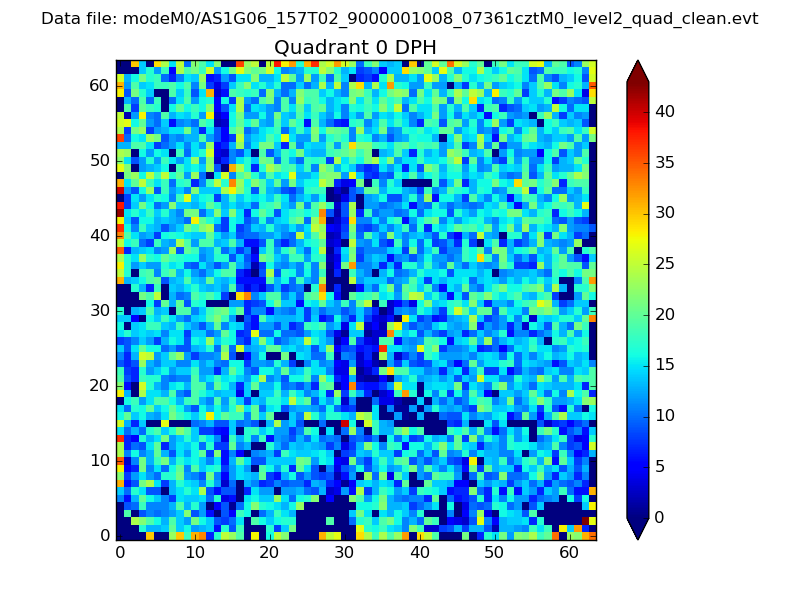 |
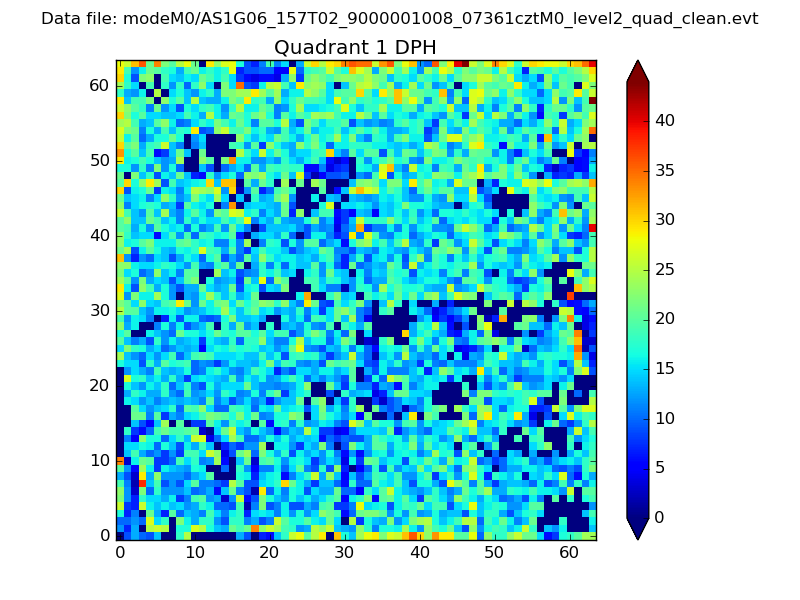 |
Quadrant B |
|---|---|---|---|
| Quadrant D | 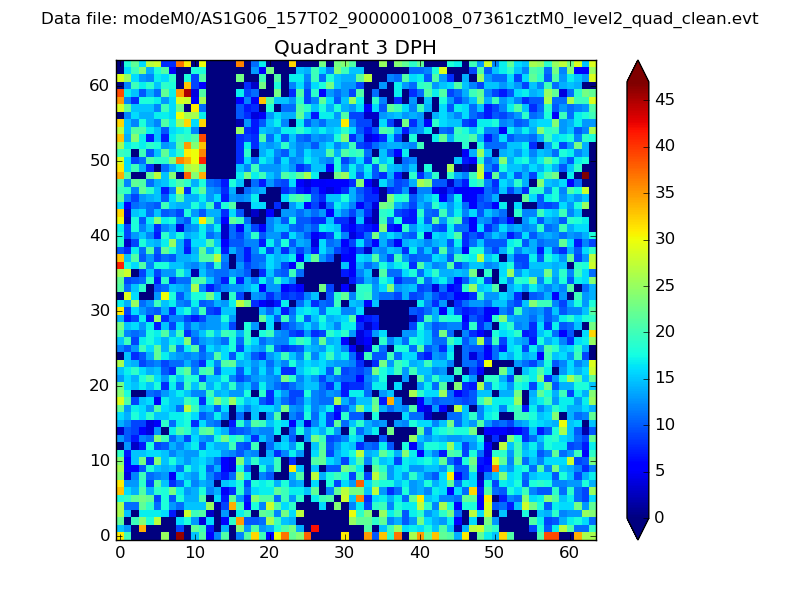 |
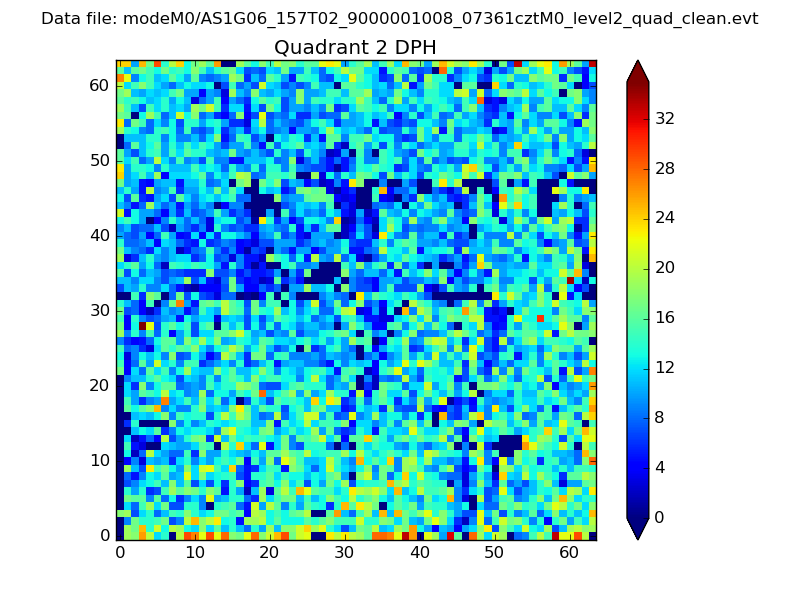 |
Quadrant C |
| Plot type | Count rate plots | Images |
|---|---|---|
| Comparison with Poisson distribution Blue bars denote a histogram of data divided into 1 sec bins. Red curve is a Poisson curve with rate = median count rate of data. |
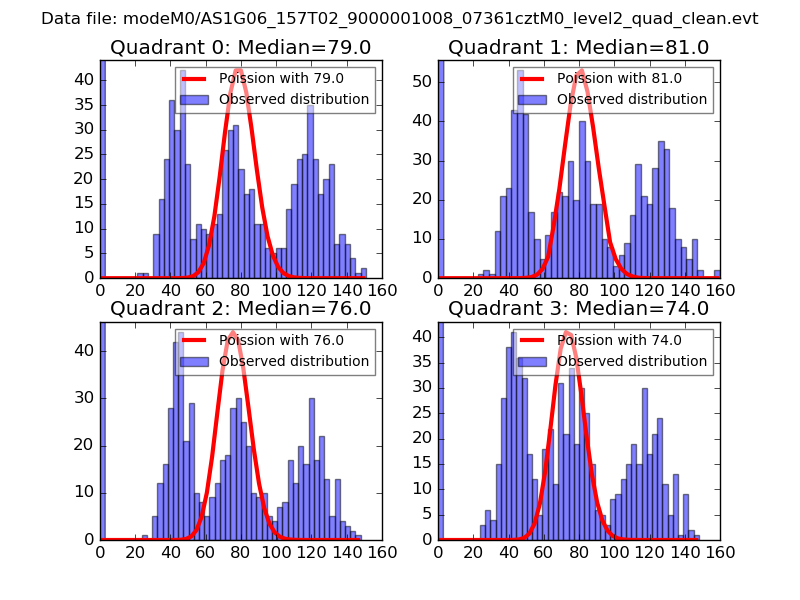 |
 |
| Quadrant-wise count rates Data is divided into 100 sec bins |
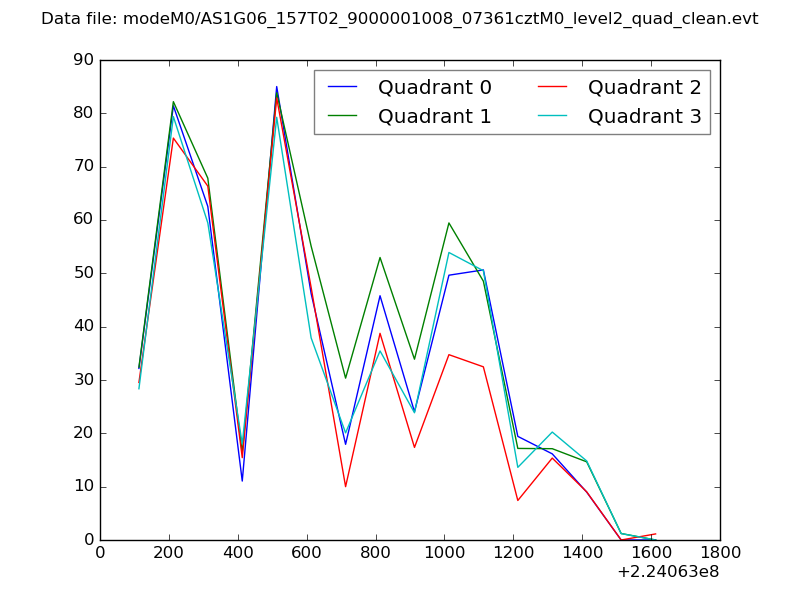 |
|
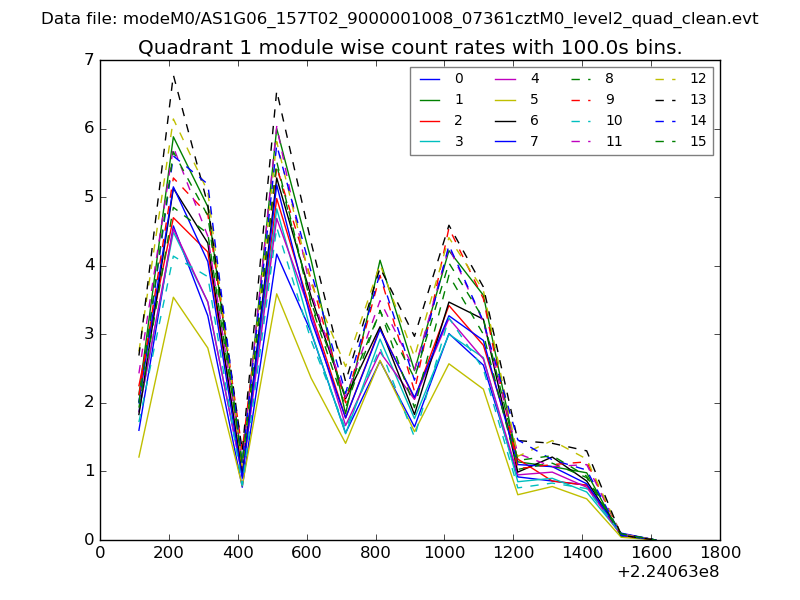
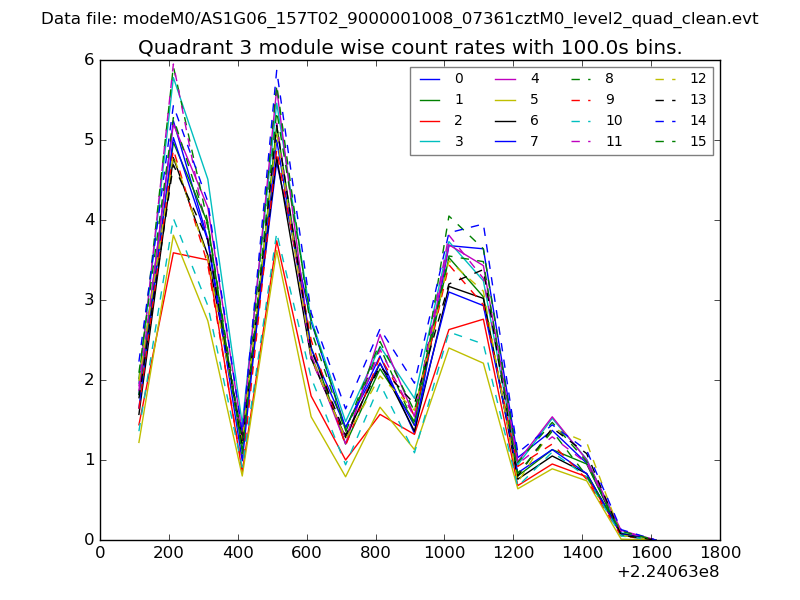
| Module-wise count rates for Quadrant A Data is divided into 100 sec bins |
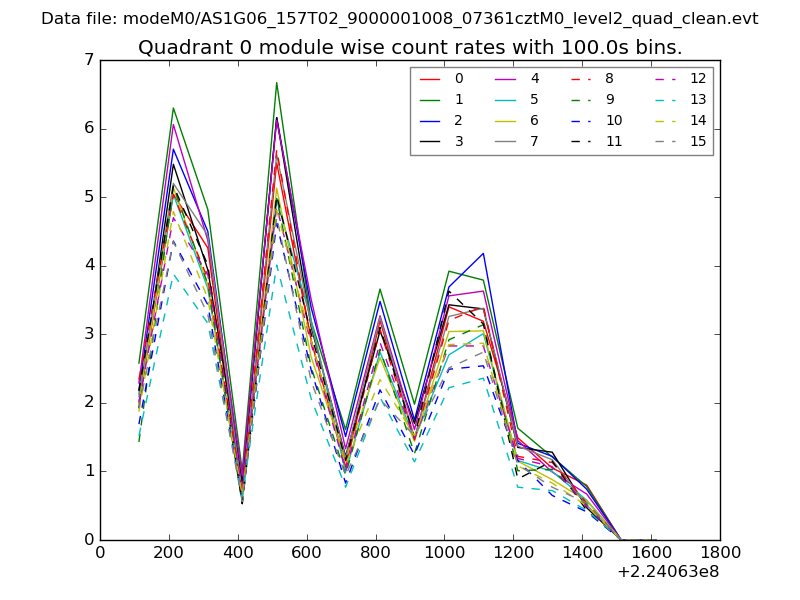 |
 |
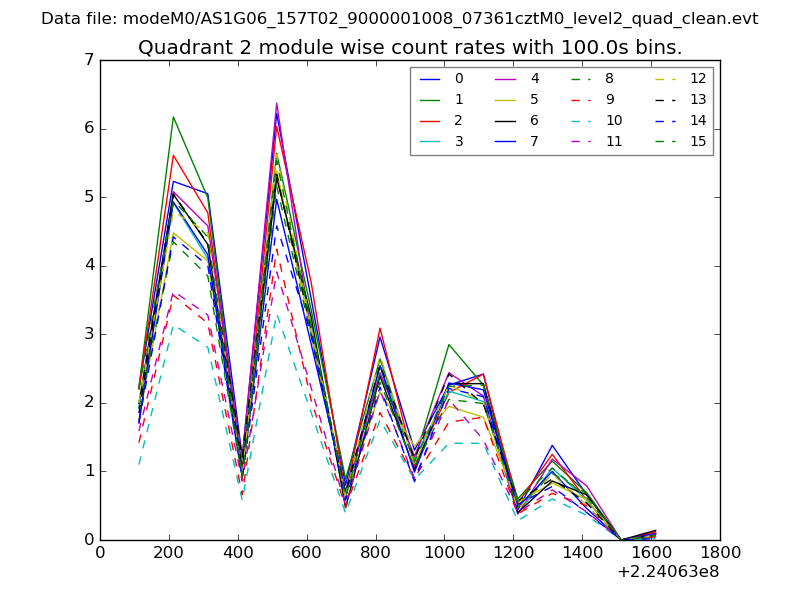
| Module-wise count rates for Quadrant B Data is divided into 100 sec bins |
 |
 |
| Module-wise count rates for Quadrant C Data is divided into 100 sec bins |
 |
 |
| Module-wise count rates for Quadrant D Data is divided into 100 sec bins |
 |
 |
| Parameter | Plot |
|---|---|
| CZT HV Monitor | 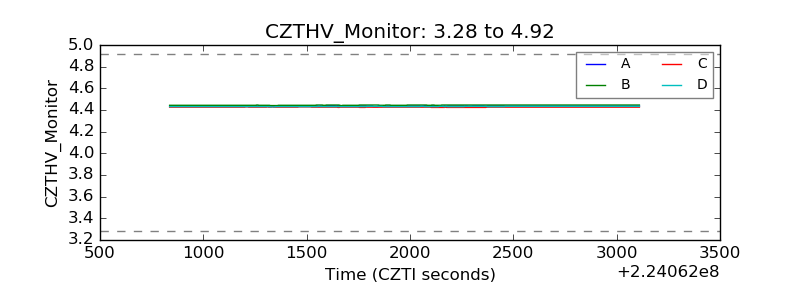 |
| D_VDD |  |
| Temperature 1 | 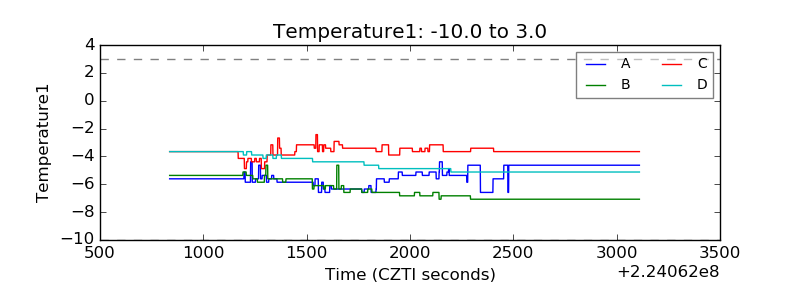 |
| Veto HV Monitor | 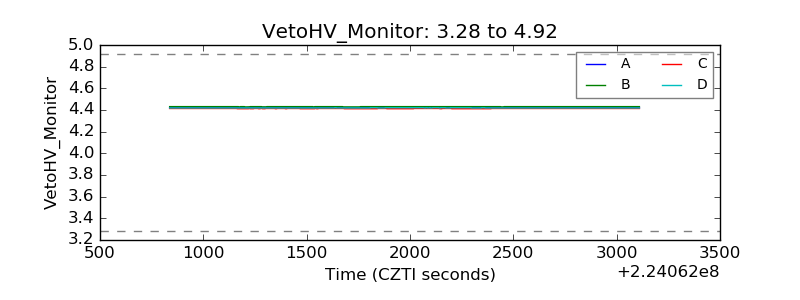 |
| Veto LLD | 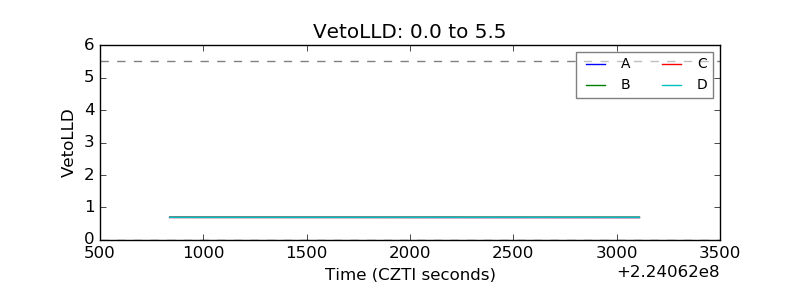 |
| Alpha Counter | 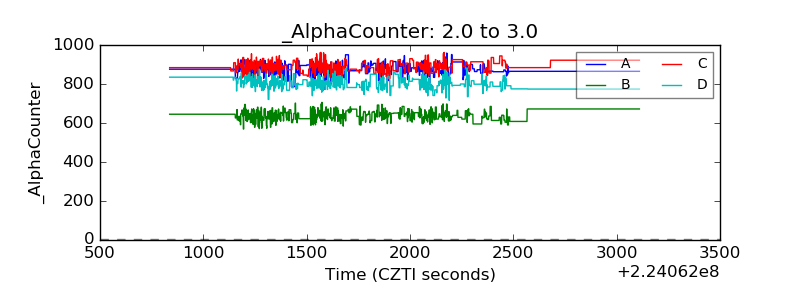 |
| _CPM_Rate | 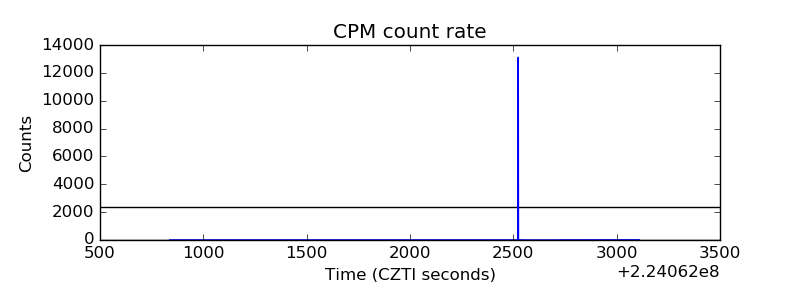 |
| CZT Counter | 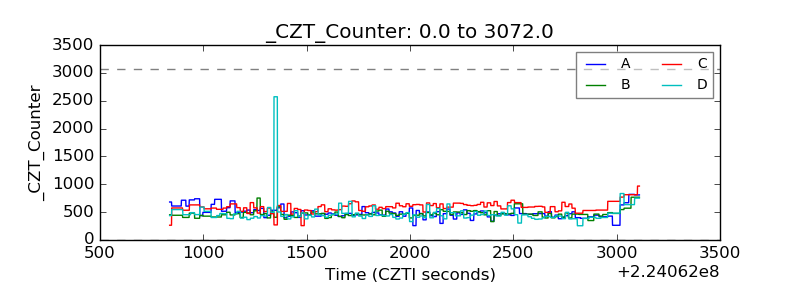 |
| +2.5 Volts monitor |  |
| +5 Volts monitor | 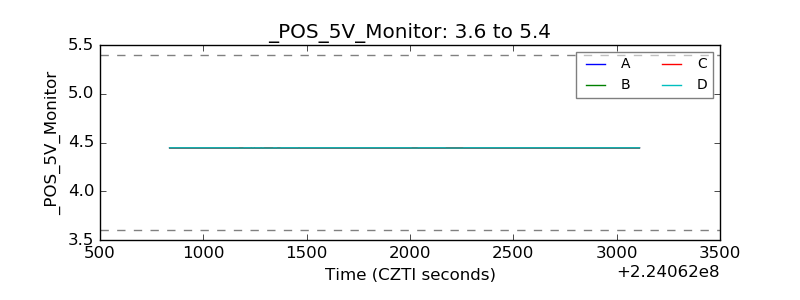 |
| _ROLL_ROT | 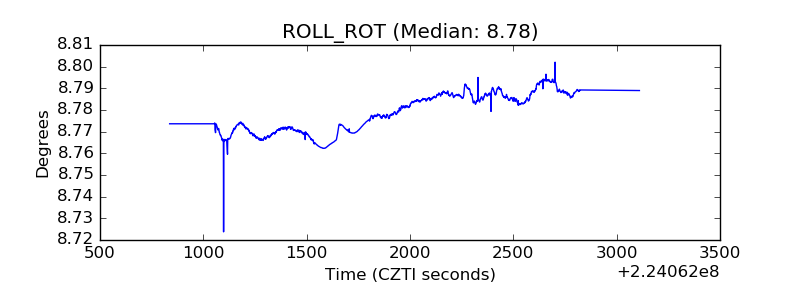 |
| _Roll_DEC | 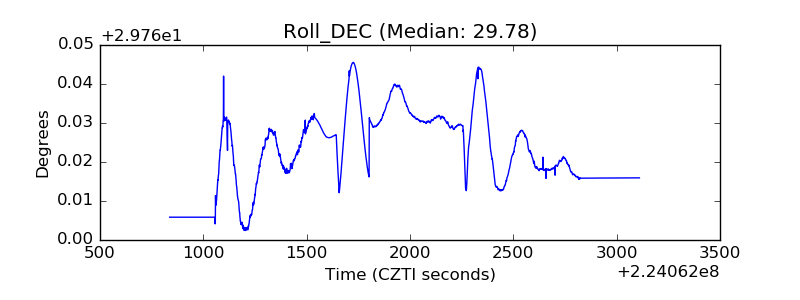 |
| _Roll_RA |  |
| Veto Counter | 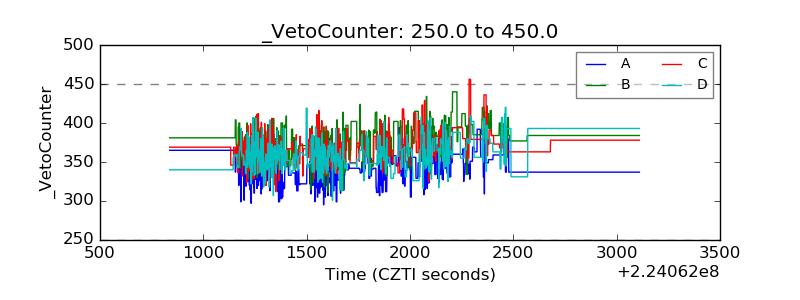 |