| Param | Original file | Final file |
|---|---|---|
| Filename | modeM0/AS1G06_157T02_9000001008_07362cztM0_level2.evt | modeM0/AS1G06_157T02_9000001008_07362cztM0_level2_quad_clean.evt |
| Size (bytes) | 460,169,280 | 65,566,080 |
| Size | 438.9 MB | 62.5 MB |
| Events in quadrant A | 3,221,934 | 378,785 |
| Events in quadrant B | 3,339,635 | 383,570 |
| Events in quadrant C | 3,296,000 | 377,934 |
| Events in quadrant D | 3,612,344 | 366,571 |
| Mode M0 | |||
|---|---|---|---|
| Quadrant | BADHDUFLAG | Total packets | Discarded packets |
| A | 0 | 14146 | 3 |
| B | 0 | 14365 | 2 |
| C | 0 | 14146 | 2 |
| D | 0 | 15458 | 2 |
| Mode SS | |||
|---|---|---|---|
| Quadrant | BADHDUFLAG | Total packets | Discarded packets |
| A | 0 | 140 | 0 |
| B | 0 | 140 | 0 |
| C | 0 | 140 | 0 |
| D | 0 | 140 | 0 |
| Mode M9 | |||
|---|---|---|---|
| Quadrant | BADHDUFLAG | Total packets | Discarded packets |
| A | 0 | 11 | 0 |
| B | 0 | 11 | 0 |
| C | 0 | 11 | 0 |
| D | 0 | 12 | 0 |
| Quadrant | Total seconds | Saturated seconds | Saturation percentage |
|---|---|---|---|
| A | 6859 | 68 | 0.991398% |
| B | 6859 | 75 | 1.093454% |
| C | 6859 | 53 | 0.772707% |
| D | 6859 | 130 | 1.895320% |
Noise dominated data is calculated using 1-second bins in cleaned event files. If a bin has >2000 counts, and if more than 50% of those come from <1% of pixels, then it is considered to be noise-dominated and hence unusable.
| Quadrant | # 1 sec bins | Bins with >0 counts | Bins with >2000 counts | High rate bins dominated by noise | Noise dominated (total time) | Noise dominated (detector-on time) | Marked lightcurve |
|---|---|---|---|---|---|---|---|
| A | 7809 | 6859 | 0 | 0 | 0.00% | 0.00% |  |
| B | 7809 | 6859 | 2 | 2 | 0.03% | 0.03% | 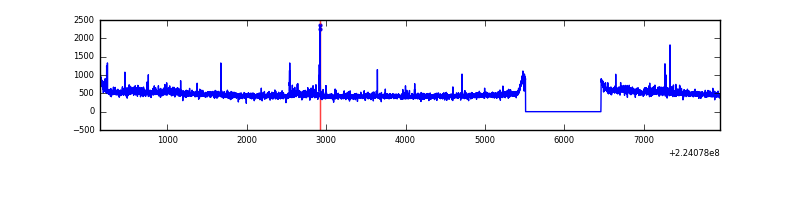 |
| C | 7809 | 6859 | 0 | 0 | 0.00% | 0.00% | 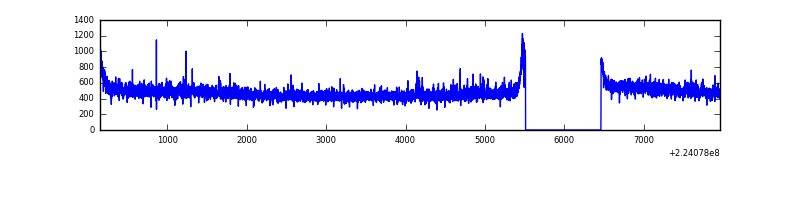 |
| D | 7809 | 6859 | 53 | 53 | 0.68% | 0.77% | 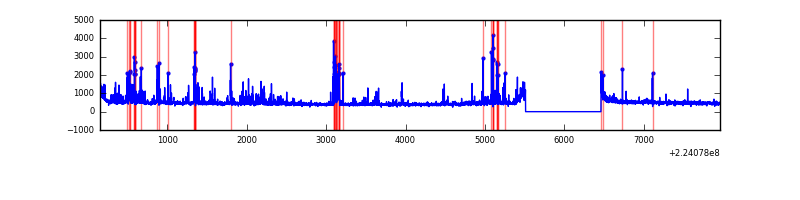 |
Top three noisy pixels from each quadrant. If the there are fewer than three noisy pixels in the level2.evt file, extra rows are filled as -1
| Pixel properties | Quadrant properties | ||||||
|---|---|---|---|---|---|---|---|
| Quadrant | DetID | PixID | Counts | Sigma | Mean | Median | Sigma |
| A | 15 | 239 | 18515 | 103.76 | 832 | 813 | 170.6 |
| A | 0 | 226 | 7922 | 41.67 | 832 | 813 | 170.6 |
| A | 12 | 194 | 7492 | 39.15 | 832 | 813 | 170.6 |
| B | 0 | 214 | 95788 | 589.5 | 834 | 813 | 161.1 |
| B | 12 | 111 | 16032 | 94.46 | 834 | 813 | 161.1 |
| B | 11 | 111 | 12859 | 74.77 | 834 | 813 | 161.1 |
| C | 9 | 68 | 62296 | 324.48 | 810 | 811 | 189.5 |
| C | 8 | 229 | 49708 | 258.05 | 810 | 811 | 189.5 |
| C | 8 | 128 | 12869 | 63.63 | 810 | 811 | 189.5 |
| D | 1 | 52 | 220231 | 1103.24 | 807 | 780 | 198.9 |
| D | 2 | 216 | 219177 | 1097.94 | 807 | 780 | 198.9 |
| D | 2 | 14 | 104108 | 519.46 | 807 | 780 | 198.9 |
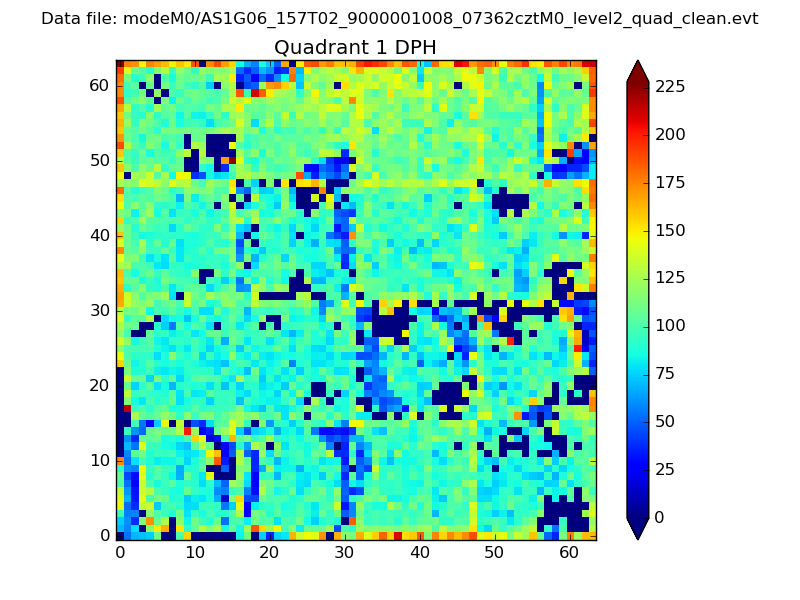
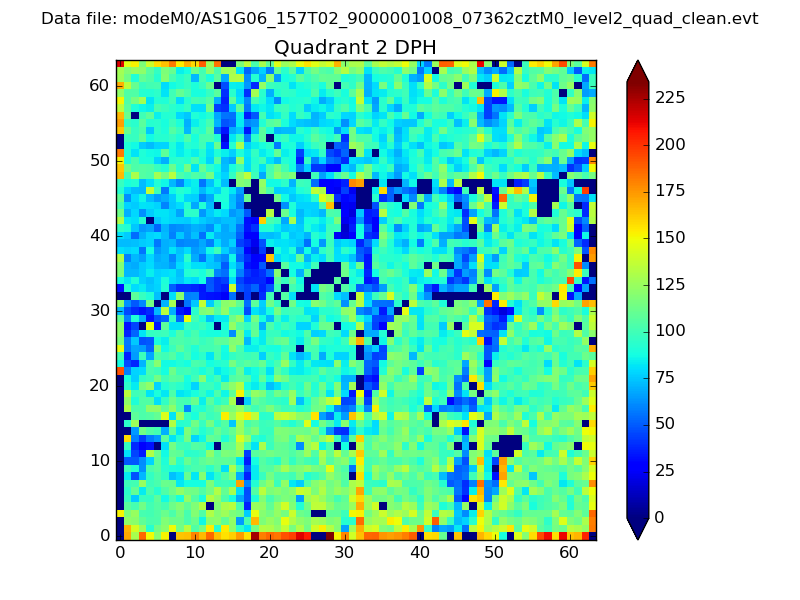
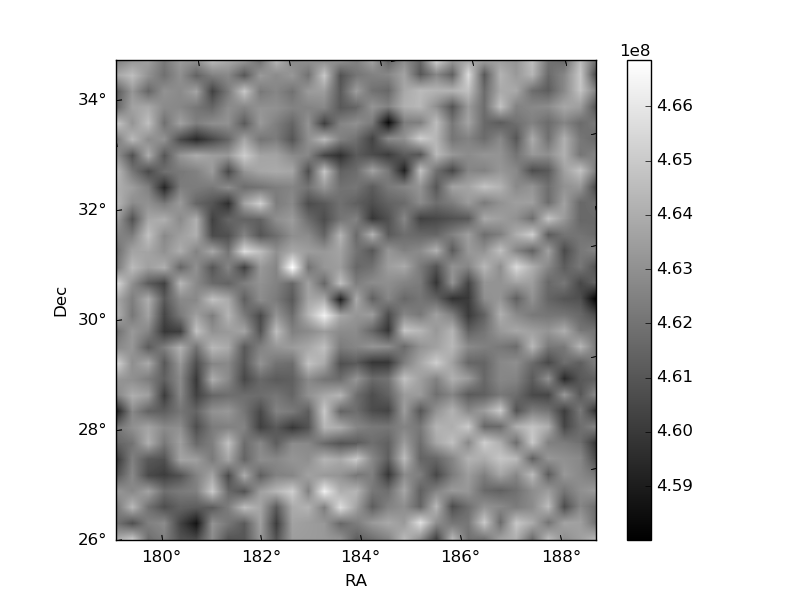
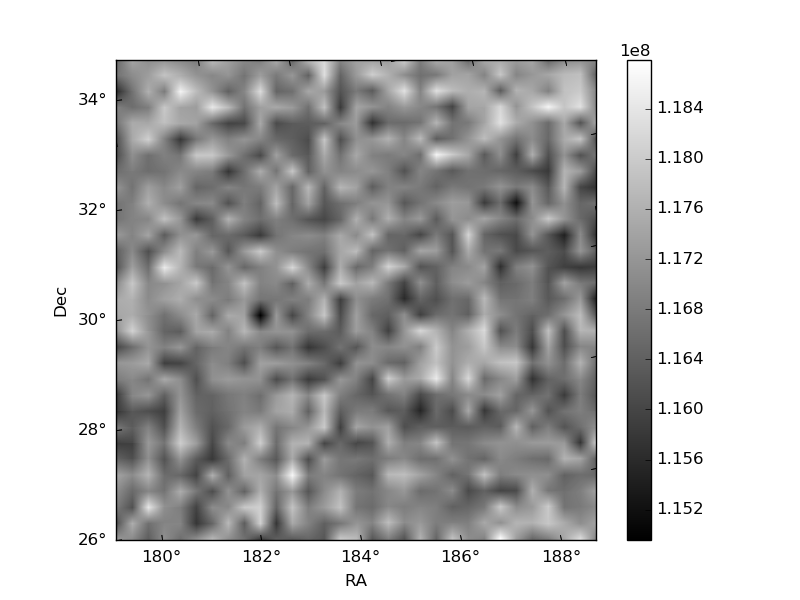
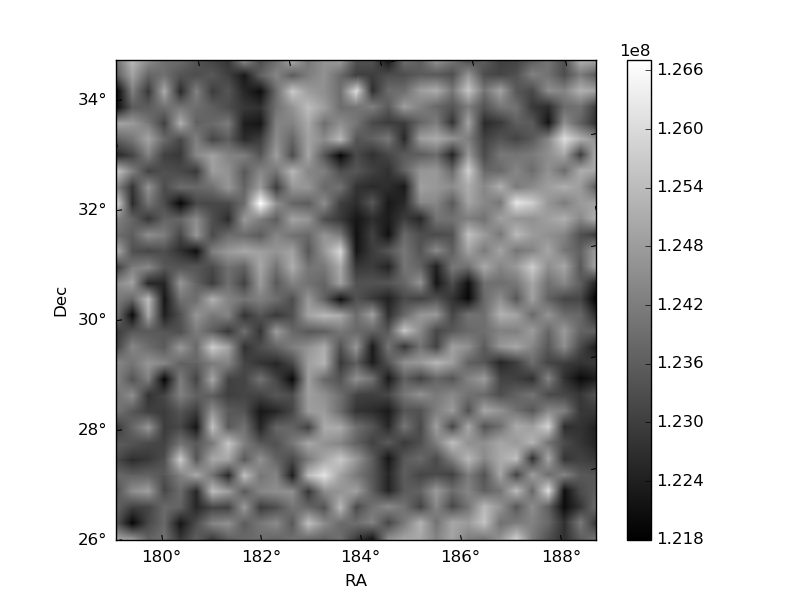
Histogram calculated using DETX and DETY for each event in the final _common_clean file
| Quadrant A | 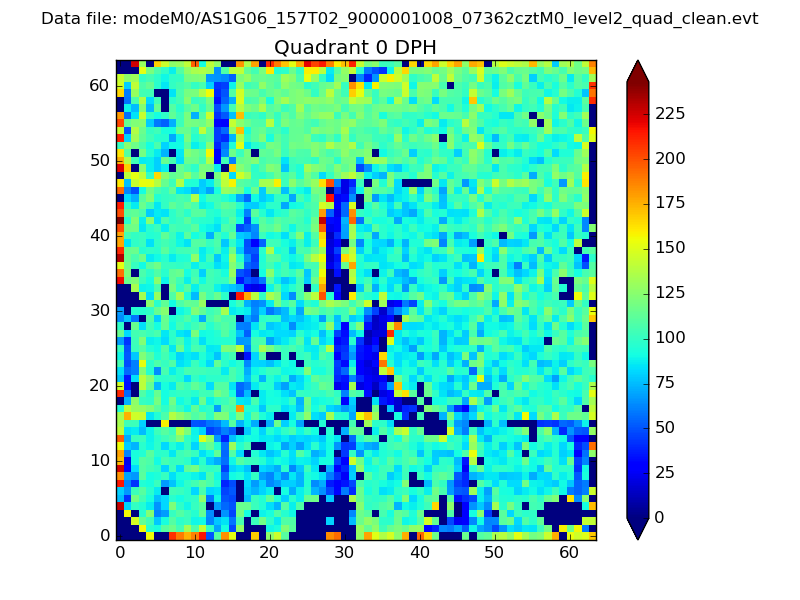 |
 |
Quadrant B |
|---|---|---|---|
| Quadrant D | 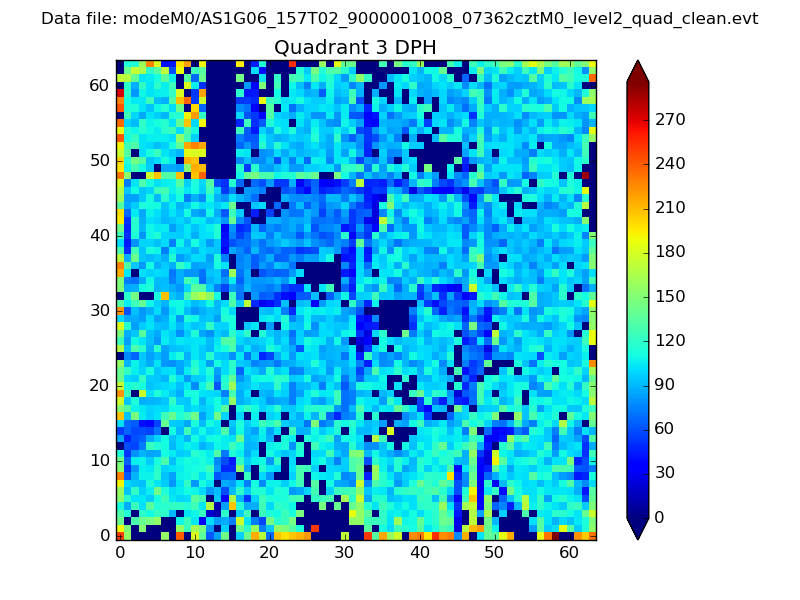 |
 |
Quadrant C |
| Plot type | Count rate plots | Images |
|---|---|---|
| Comparison with Poisson distribution Blue bars denote a histogram of data divided into 1 sec bins. Red curve is a Poisson curve with rate = median count rate of data. |
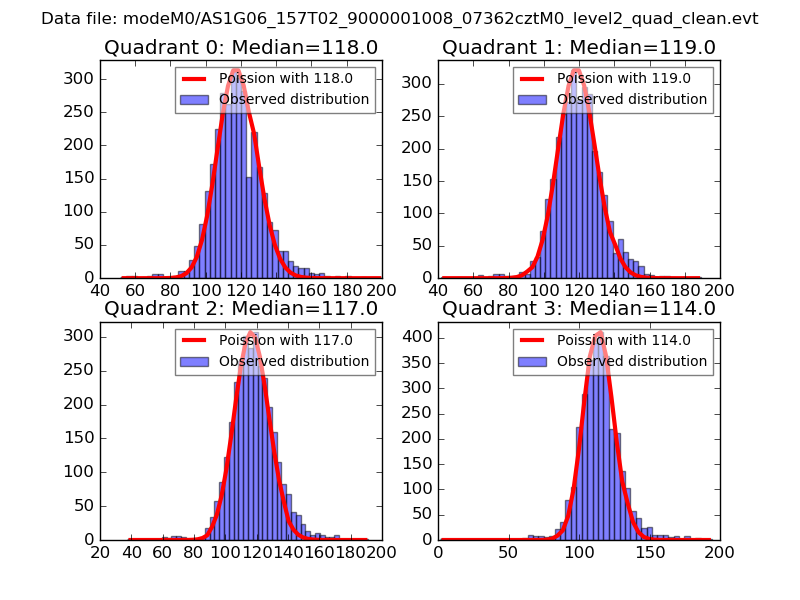 |
 |
| Quadrant-wise count rates Data is divided into 100 sec bins |
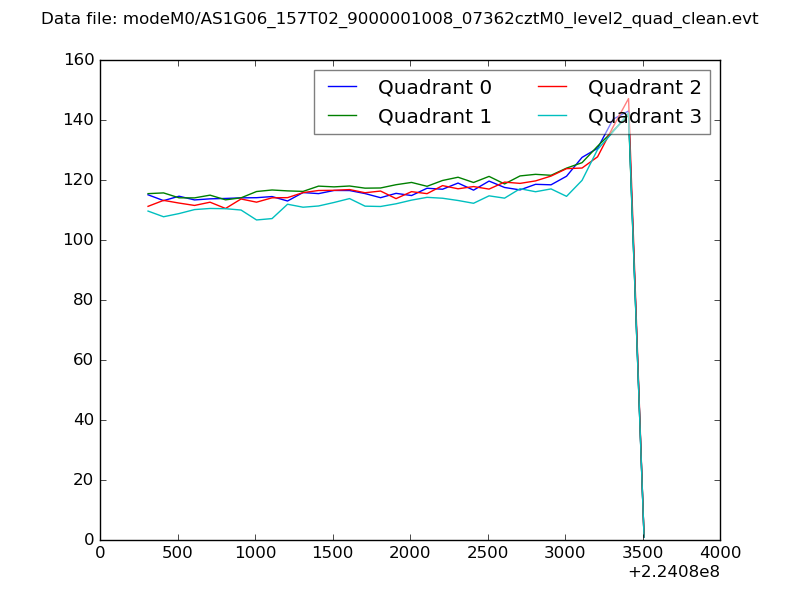 |
|
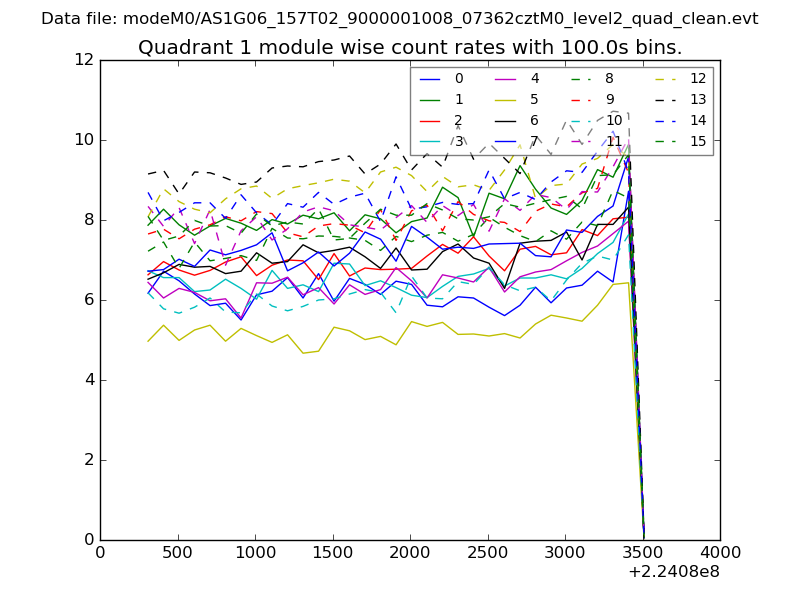
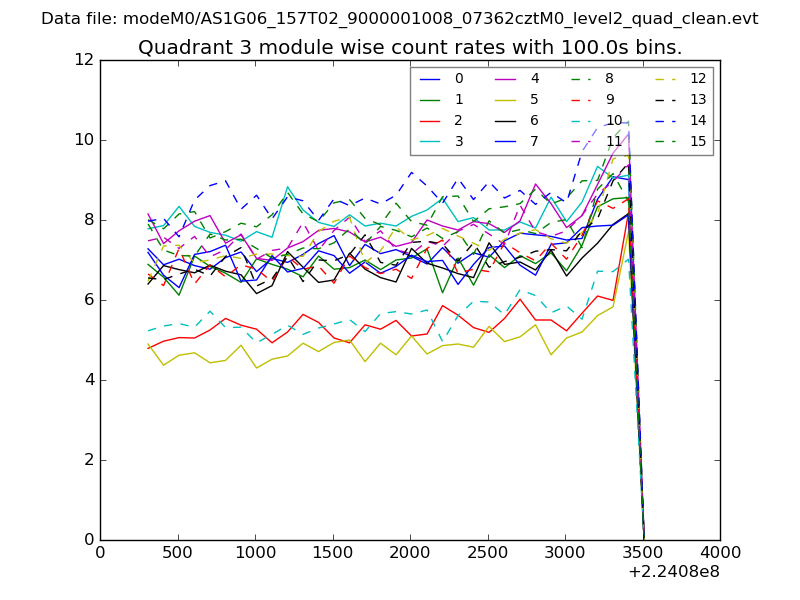
| Module-wise count rates for Quadrant A Data is divided into 100 sec bins |
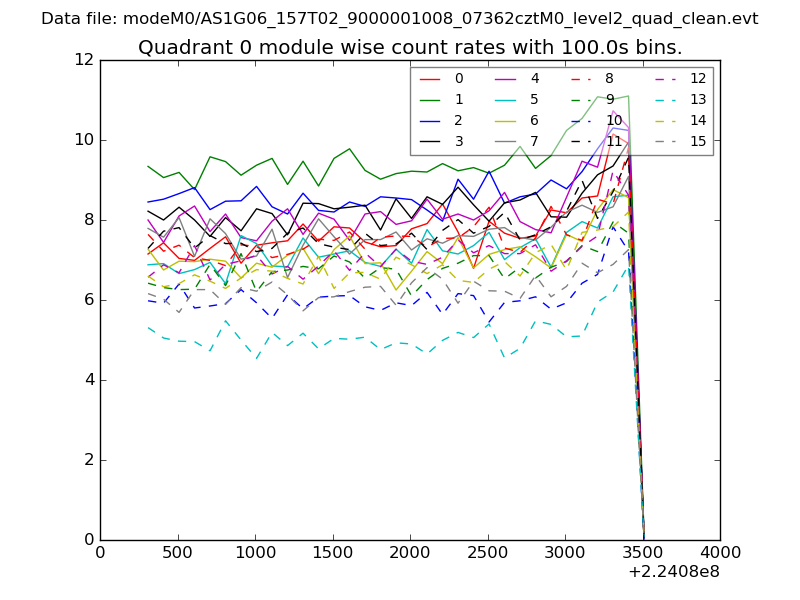 |
 |
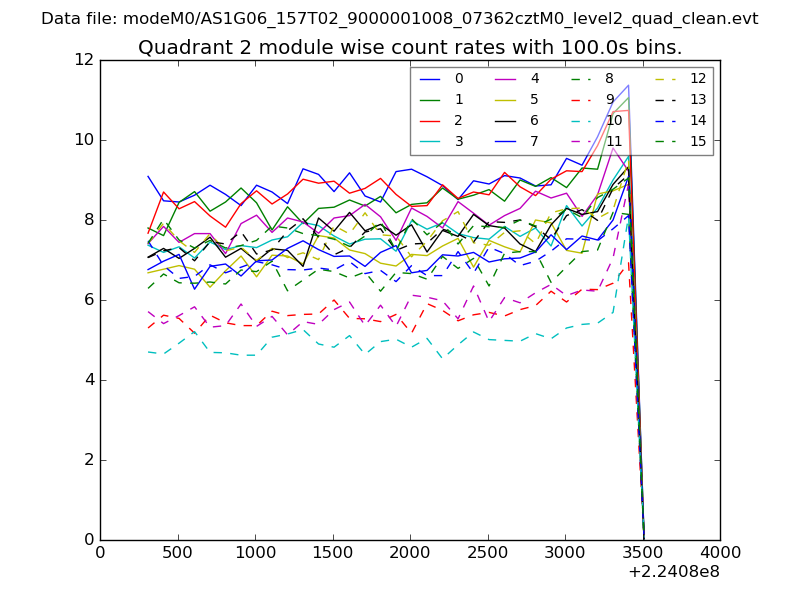
| Module-wise count rates for Quadrant B Data is divided into 100 sec bins |
 |
 |
| Module-wise count rates for Quadrant C Data is divided into 100 sec bins |
 |
 |
| Module-wise count rates for Quadrant D Data is divided into 100 sec bins |
 |
 |
| Parameter | Plot |
|---|---|
| CZT HV Monitor | 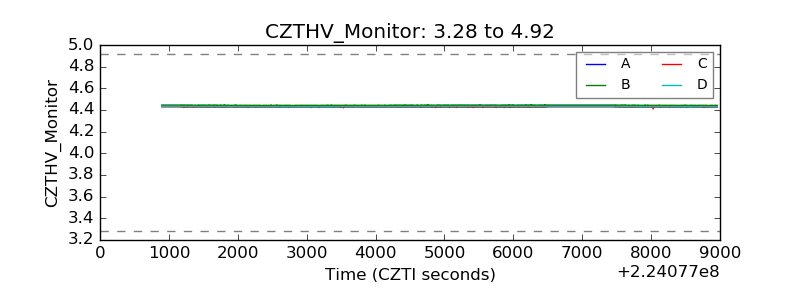 |
| D_VDD | 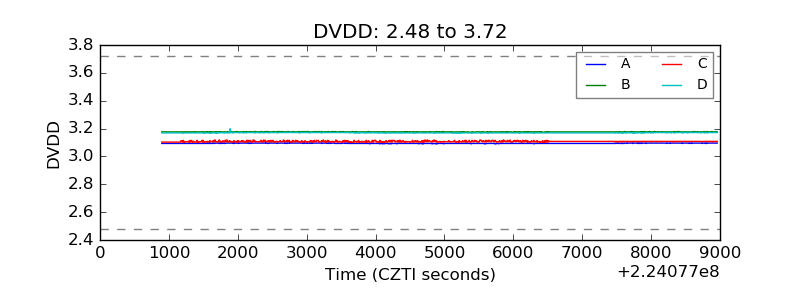 |
| Temperature 1 | 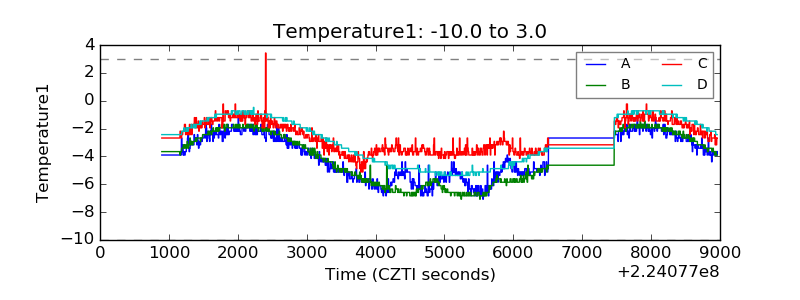 |
| Veto HV Monitor | 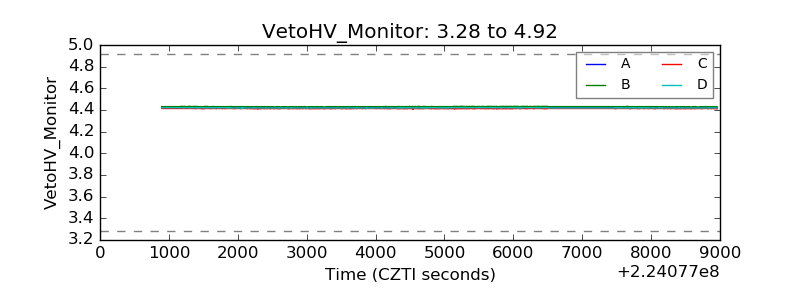 |
| Veto LLD | 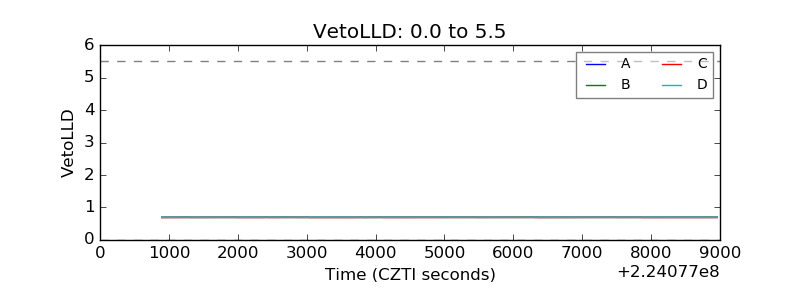 |
| Alpha Counter | 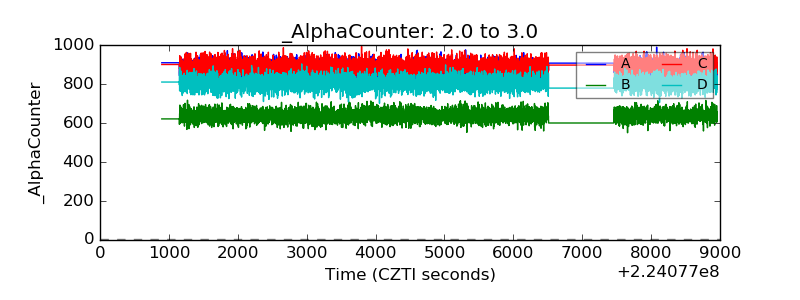 |
| _CPM_Rate | 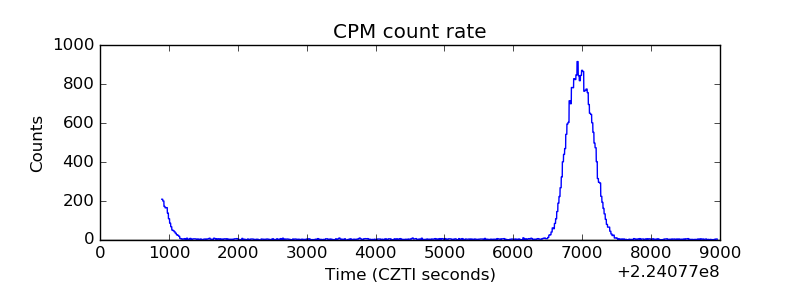 |
| CZT Counter | 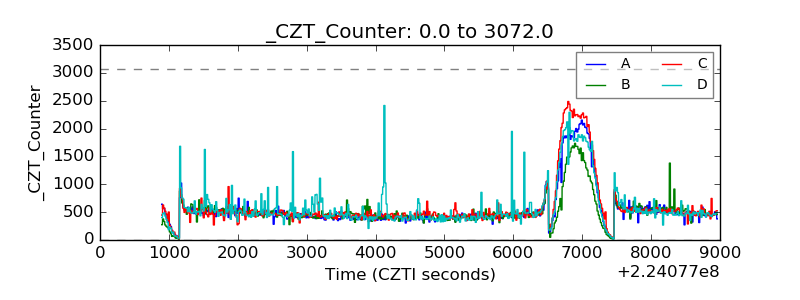 |
| +2.5 Volts monitor |  |
| +5 Volts monitor |  |
| _ROLL_ROT | 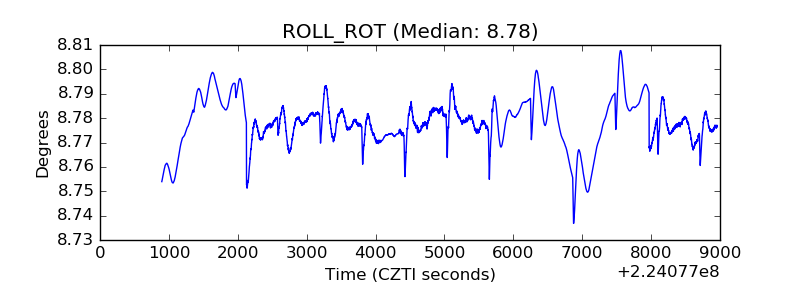 |
| _Roll_DEC | 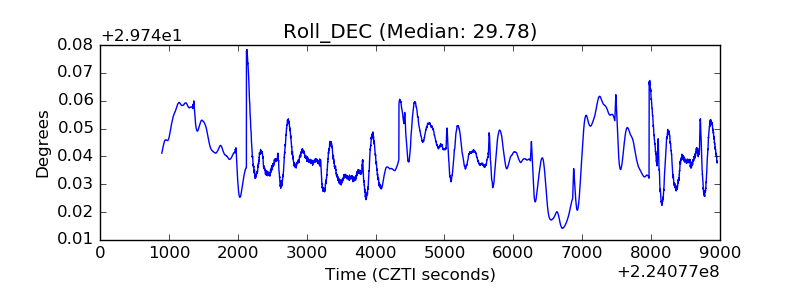 |
| _Roll_RA | 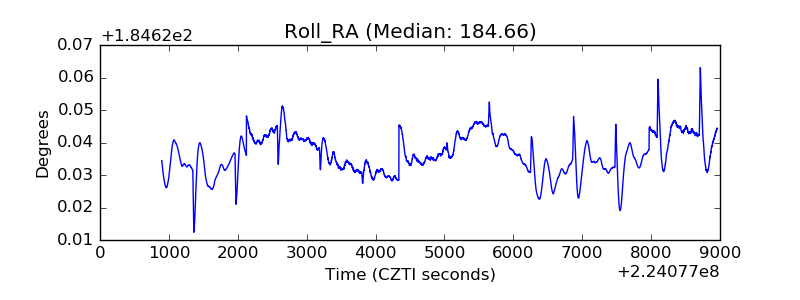 |
| Veto Counter | 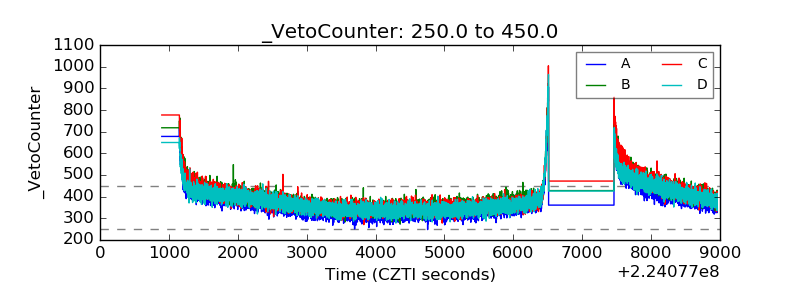 |