| Param | Original file | Final file |
|---|---|---|
| Filename | modeM0/AS1G06_157T02_9000001008_07364cztM0_level2.evt | modeM0/AS1G06_157T02_9000001008_07364cztM0_level2_quad_clean.evt |
| Size (bytes) | 3,469,429,440 | 544,314,240 |
| Size | 3.2 GB | 519.1 MB |
| Events in quadrant A | 23,871,740 | 3,342,605 |
| Events in quadrant B | 22,395,017 | 3,435,869 |
| Events in quadrant C | 25,561,280 | 3,377,672 |
| Events in quadrant D | 30,086,125 | 3,116,480 |
| Mode M0 | |||
|---|---|---|---|
| Quadrant | BADHDUFLAG | Total packets | Discarded packets |
| A | 0 | 103438 | 10 |
| B | 0 | 97956 | 9 |
| C | 0 | 106010 | 9 |
| D | 0 | 122544 | 12 |
| Mode SS | |||
|---|---|---|---|
| Quadrant | BADHDUFLAG | Total packets | Discarded packets |
| A | 0 | 952 | 0 |
| B | 0 | 952 | 0 |
| C | 0 | 952 | 0 |
| D | 0 | 952 | 0 |
| Mode M9 | |||
|---|---|---|---|
| Quadrant | BADHDUFLAG | Total packets | Discarded packets |
| A | 0 | 45 | 0 |
| B | 0 | 45 | 0 |
| C | 0 | 45 | 0 |
| D | 0 | 45 | 0 |
| Quadrant | Total seconds | Saturated seconds | Saturation percentage |
|---|---|---|---|
| A | 46804 | 1697 | 3.625758% |
| B | 46804 | 845 | 1.805401% |
| C | 46804 | 648 | 1.384497% |
| D | 46803 | 3248 | 6.939726% |
Noise dominated data is calculated using 1-second bins in cleaned event files. If a bin has >2000 counts, and if more than 50% of those come from <1% of pixels, then it is considered to be noise-dominated and hence unusable.
| Quadrant | # 1 sec bins | Bins with >0 counts | Bins with >2000 counts | High rate bins dominated by noise | Noise dominated (total time) | Noise dominated (detector-on time) | Marked lightcurve |
|---|---|---|---|---|---|---|---|
| A | 57521 | 46810 | 746 | 746 | 1.30% | 1.59% | 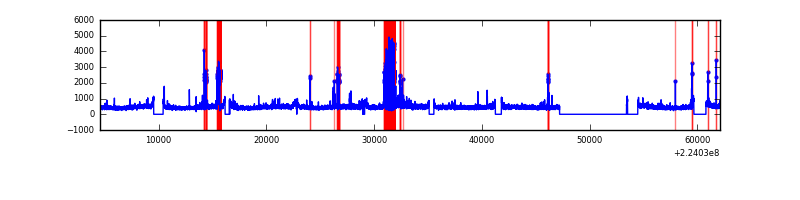 |
| B | 57521 | 46812 | 20 | 20 | 0.03% | 0.04% | 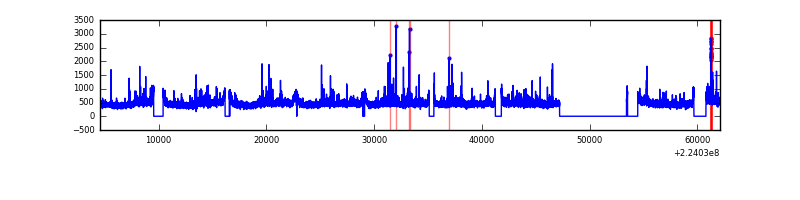 |
| C | 57521 | 46810 | 1 | 1 | 0.00% | 0.00% | 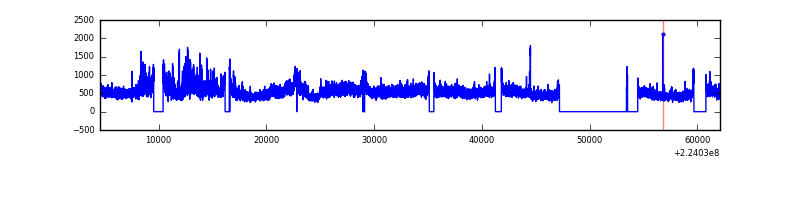 |
| D | 57521 | 46811 | 2579 | 2579 | 4.48% | 5.51% | 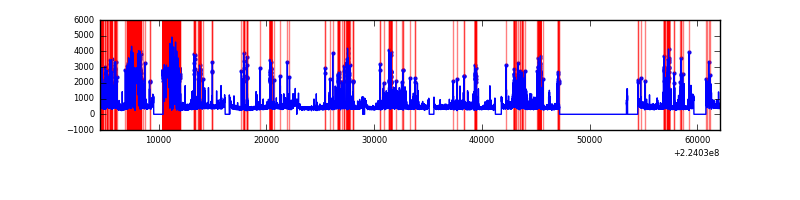 |
Top three noisy pixels from each quadrant. If the there are fewer than three noisy pixels in the level2.evt file, extra rows are filled as -1
| Pixel properties | Quadrant properties | ||||||
|---|---|---|---|---|---|---|---|
| Quadrant | DetID | PixID | Counts | Sigma | Mean | Median | Sigma |
| A | 15 | 234 | 2661506 | 2418.47 | 5445 | 5322 | 1098.3 |
| A | 15 | 239 | 184985 | 163.58 | 5445 | 5322 | 1098.3 |
| A | 0 | 226 | 51989 | 42.49 | 5445 | 5322 | 1098.3 |
| B | 0 | 214 | 497215 | 463.13 | 5560 | 5421 | 1061.9 |
| B | 4 | 81 | 176071 | 160.7 | 5560 | 5421 | 1061.9 |
| B | 11 | 51 | 129816 | 117.14 | 5560 | 5421 | 1061.9 |
| C | 9 | 68 | 4072731 | 3261.64 | 5371 | 5394 | 1247.0 |
| C | 12 | 80 | 401464 | 317.61 | 5371 | 5394 | 1247.0 |
| C | 8 | 229 | 62296 | 45.63 | 5371 | 5394 | 1247.0 |
| D | 1 | 52 | 7195560 | 5652.11 | 5191 | 5032 | 1272.2 |
| D | 2 | 216 | 1390372 | 1088.95 | 5191 | 5032 | 1272.2 |
| D | 14 | 34 | 679301 | 530.01 | 5191 | 5032 | 1272.2 |
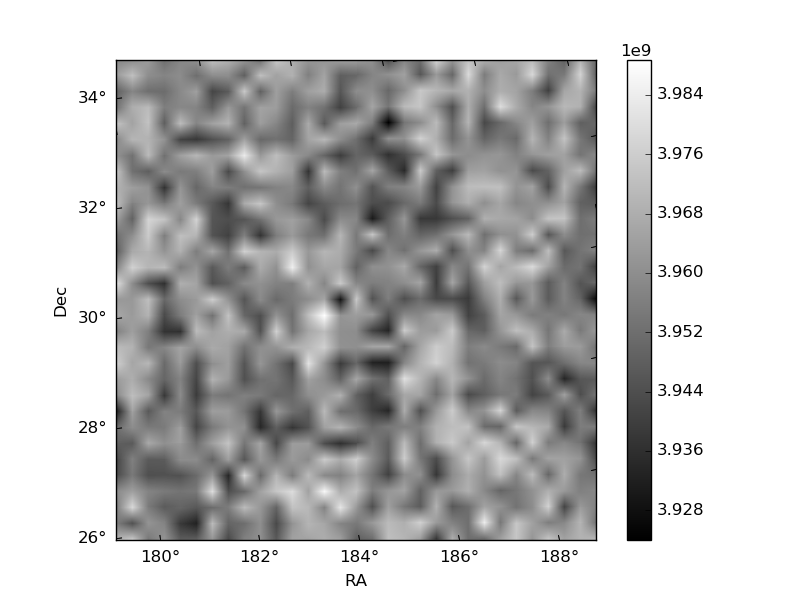
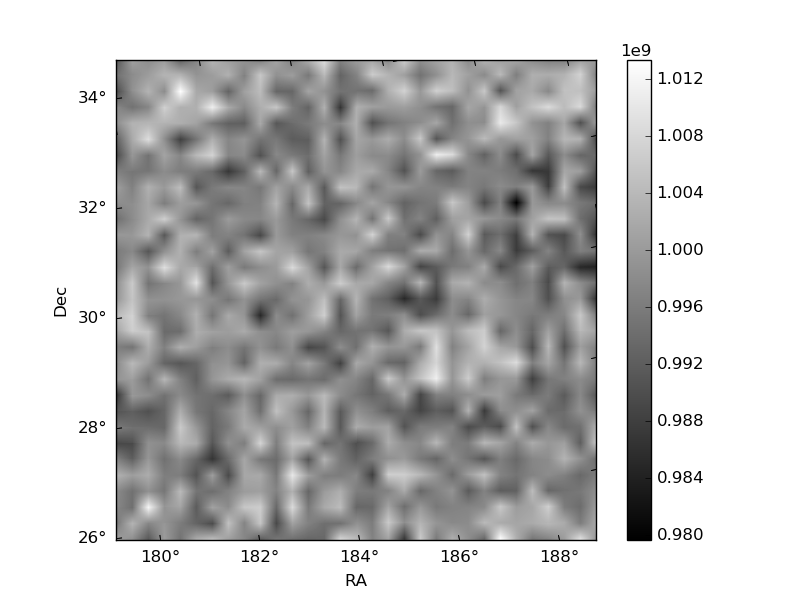
Histogram calculated using DETX and DETY for each event in the final _common_clean file
| Quadrant A | 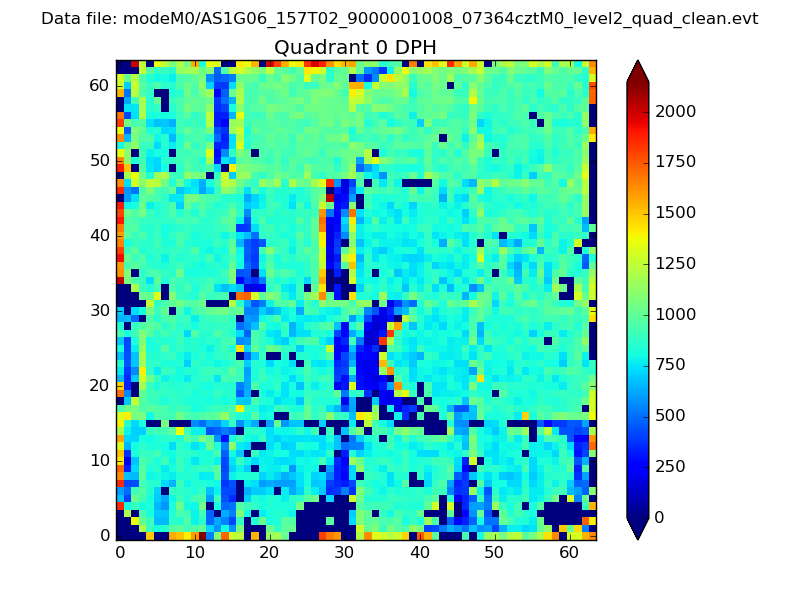 |
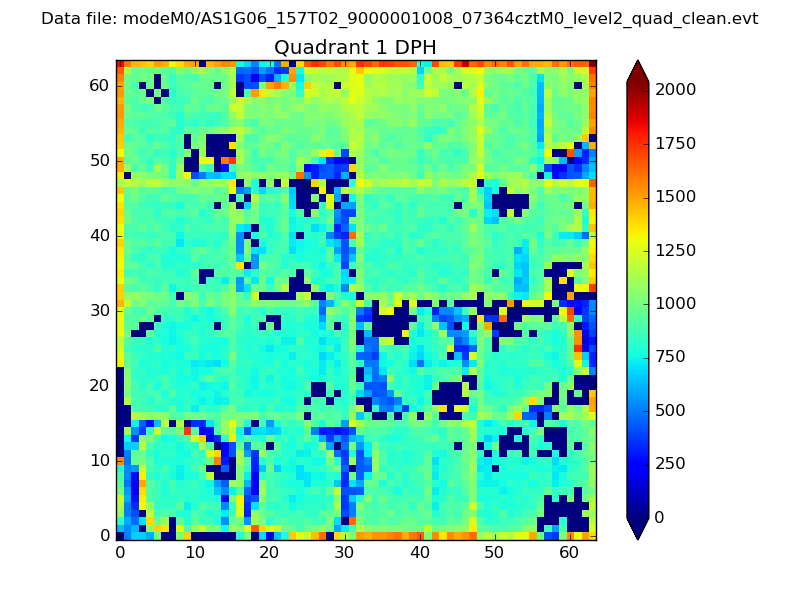 |
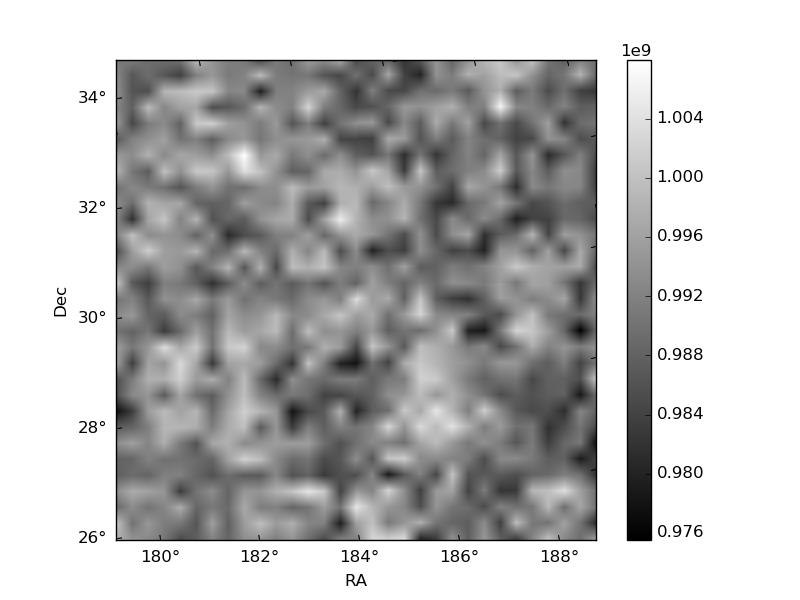
Quadrant B |
|---|---|---|---|
| Quadrant D | 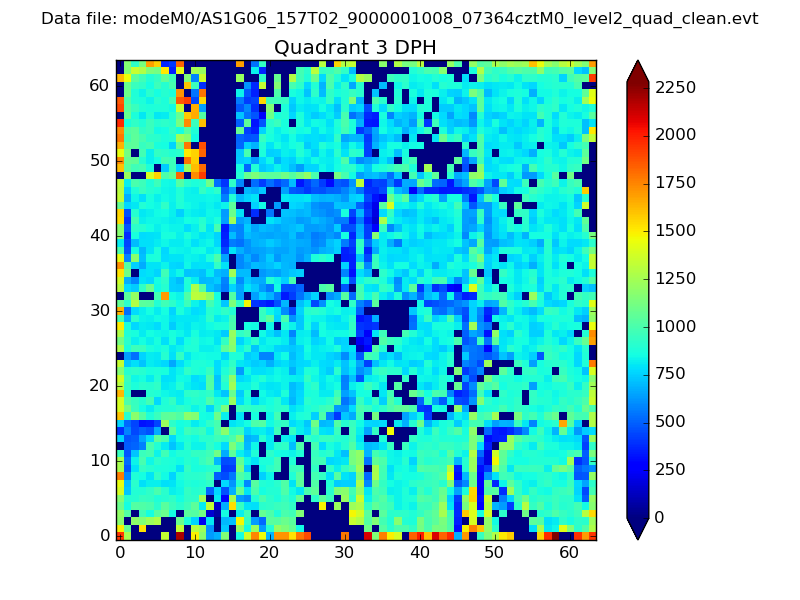 |
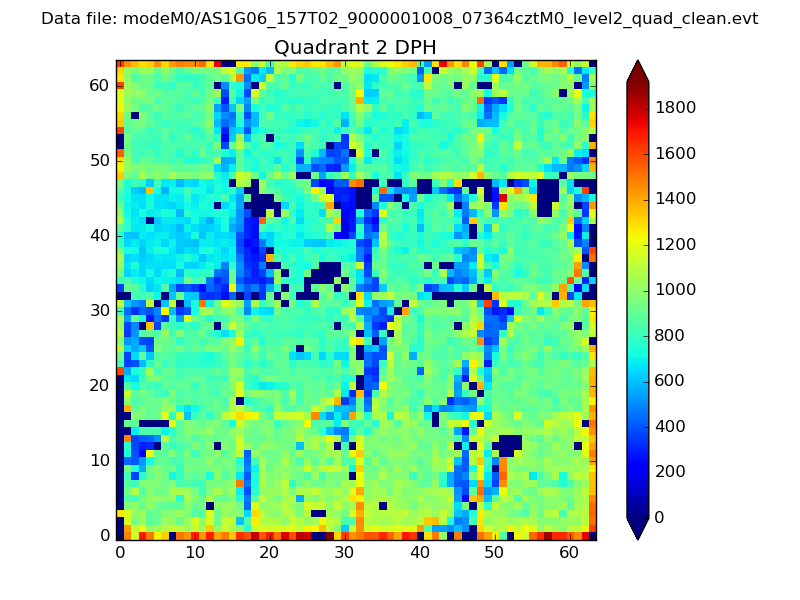 |
Quadrant C |
| Plot type | Count rate plots | Images |
|---|---|---|
| Comparison with Poisson distribution Blue bars denote a histogram of data divided into 1 sec bins. Red curve is a Poisson curve with rate = median count rate of data. |
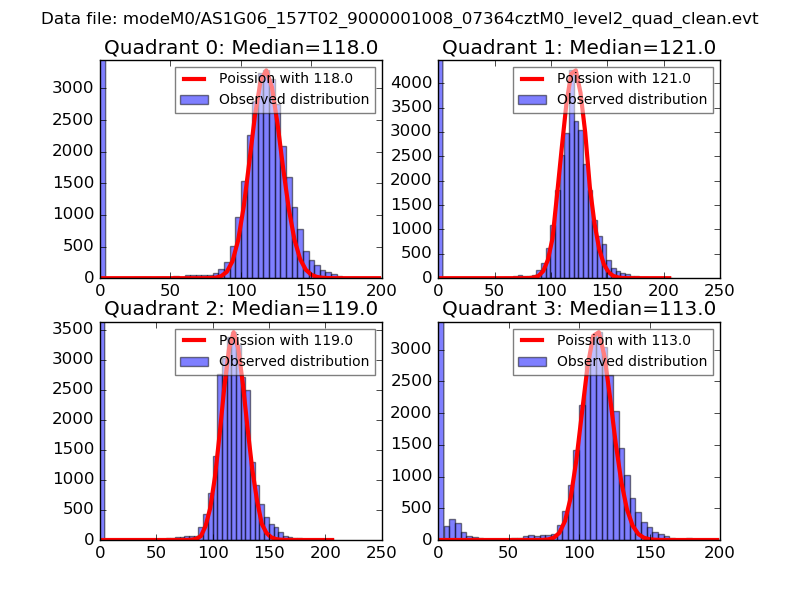 |
 |
| Quadrant-wise count rates Data is divided into 100 sec bins |
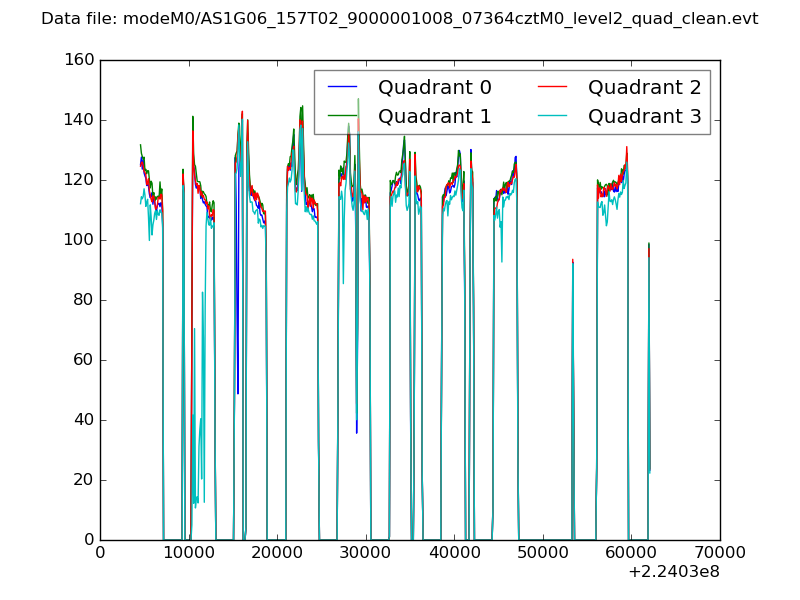 |
|
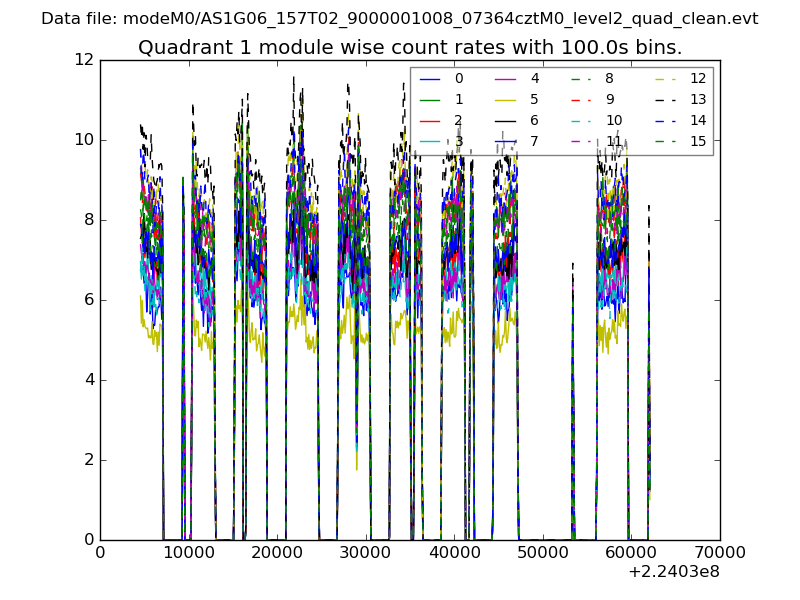
| Module-wise count rates for Quadrant A Data is divided into 100 sec bins |
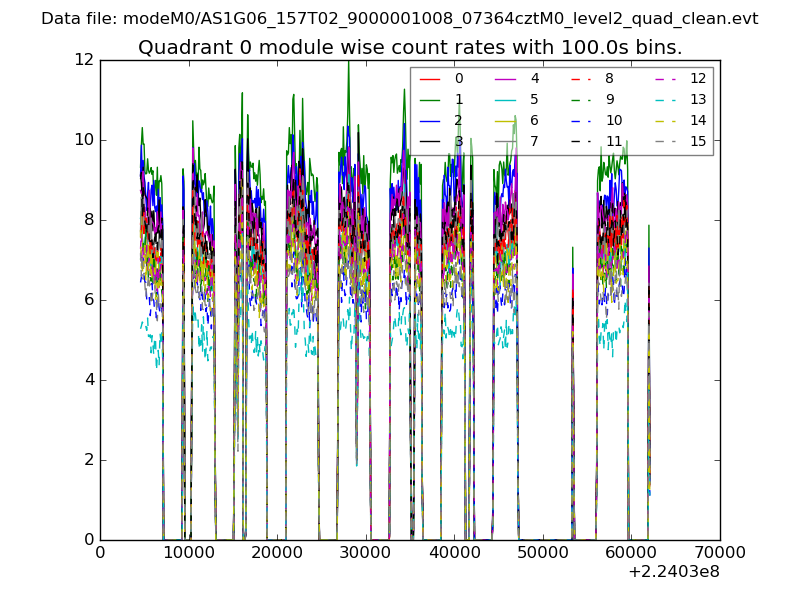 |
 |
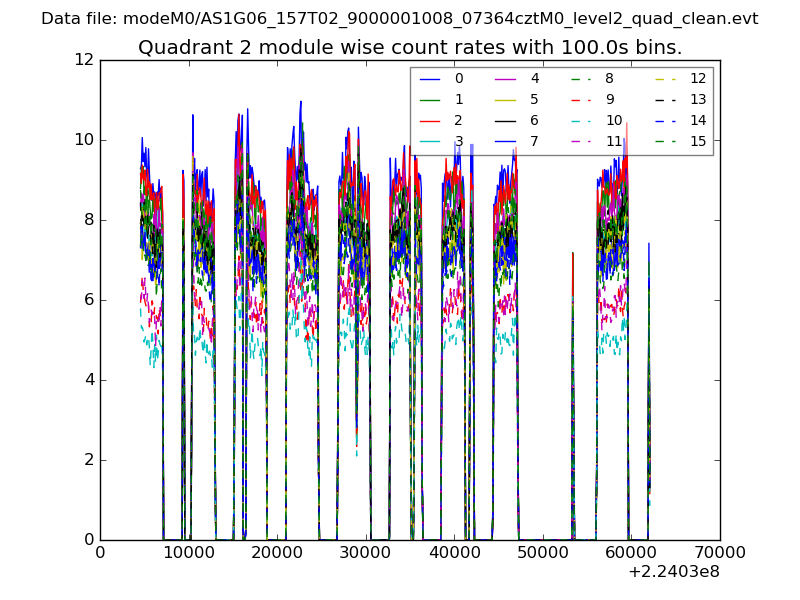
| Module-wise count rates for Quadrant B Data is divided into 100 sec bins |
 |
 |
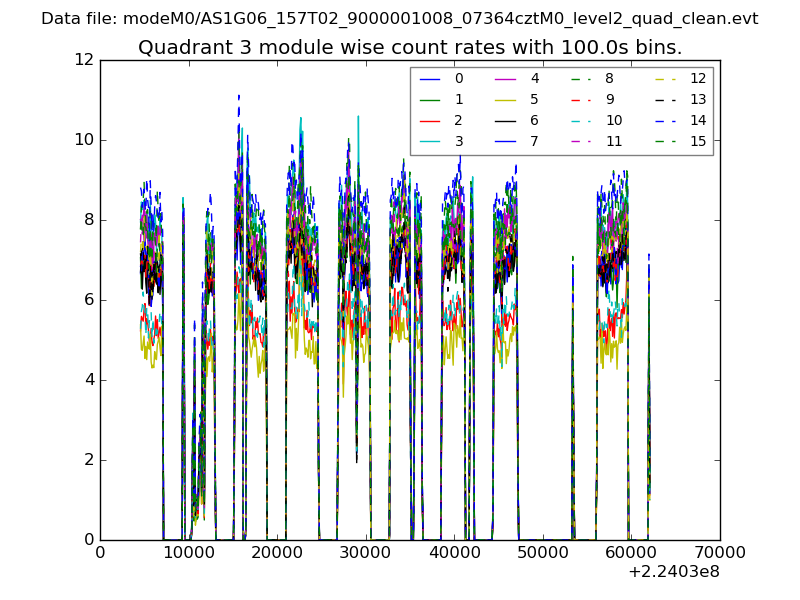
| Module-wise count rates for Quadrant C Data is divided into 100 sec bins |
 |
 |
| Module-wise count rates for Quadrant D Data is divided into 100 sec bins |
 |
 |
| Parameter | Plot |
|---|---|
| CZT HV Monitor | 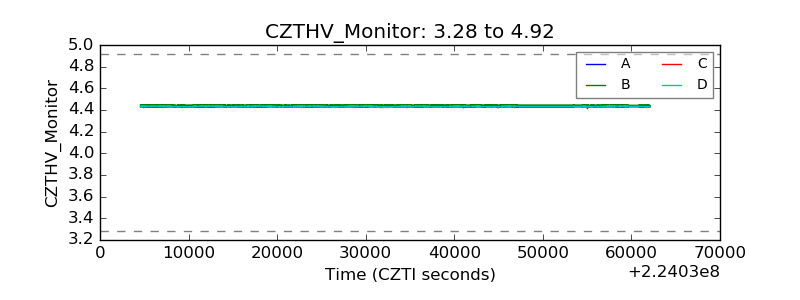 |
| D_VDD | 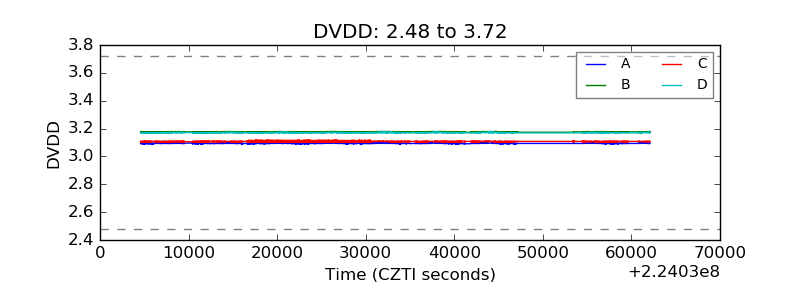 |
| Temperature 1 | 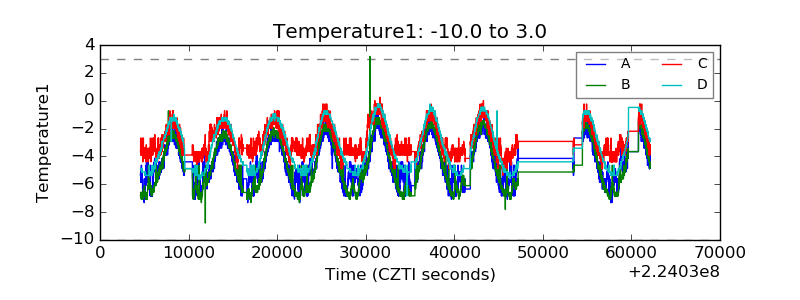 |
| Veto HV Monitor | 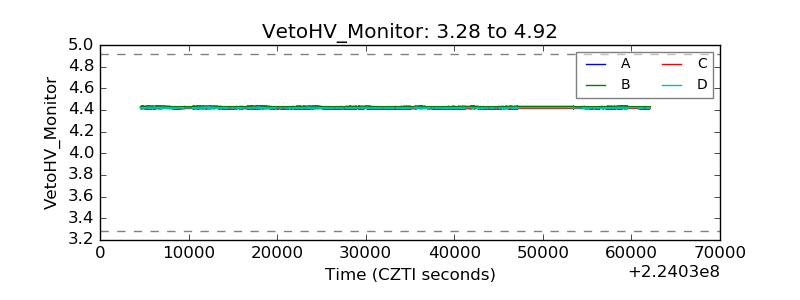 |
| Veto LLD | 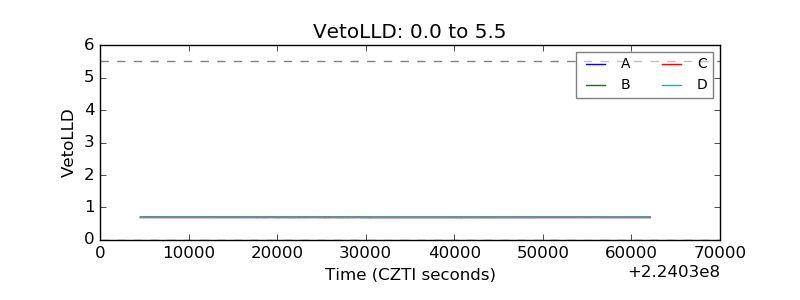 |
| Alpha Counter | 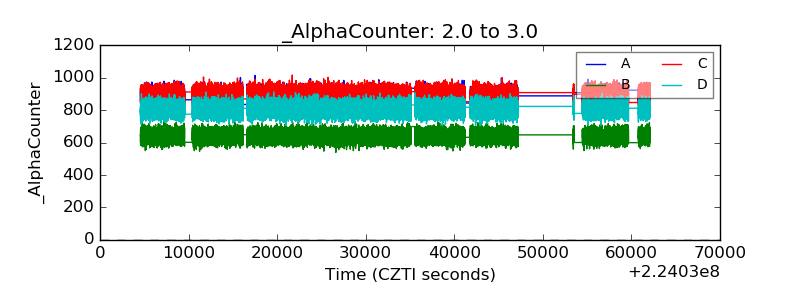 |
| _CPM_Rate | 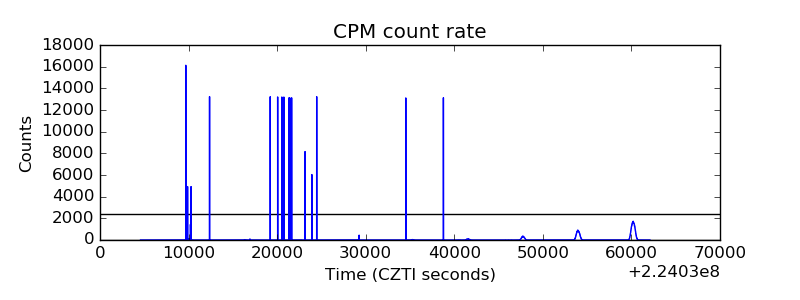 |
| CZT Counter | 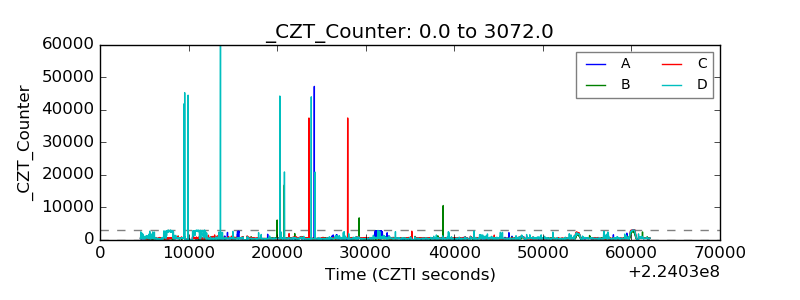 |
| +2.5 Volts monitor |  |
| +5 Volts monitor |  |
| _ROLL_ROT | 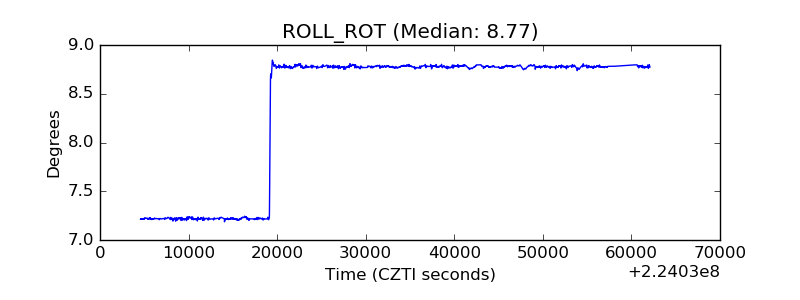 |
| _Roll_DEC | 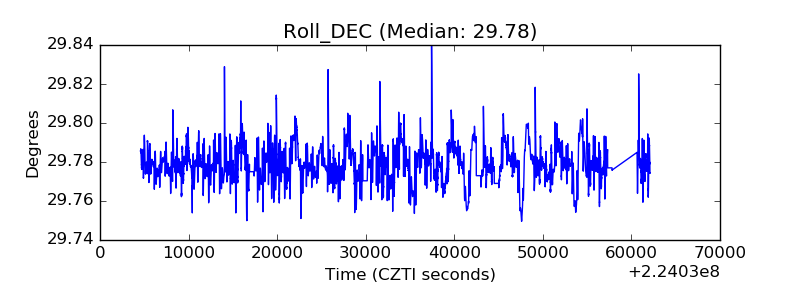 |
| _Roll_RA | 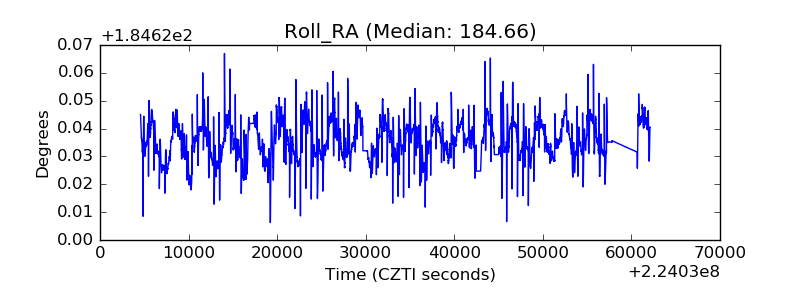 |
| Veto Counter | 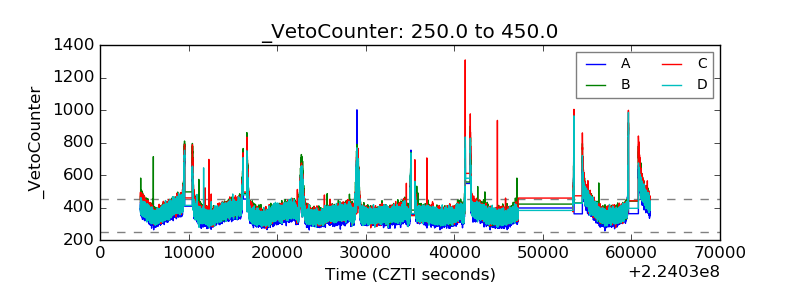 |