| Param | Original file | Final file |
|---|---|---|
| Filename | modeM0/AS1G06_157T02_9000001008_07365cztM0_level2.evt | modeM0/AS1G06_157T02_9000001008_07365cztM0_level2_quad_clean.evt |
| Size (bytes) | 1,235,332,800 | 218,764,800 |
| Size | 1.2 GB | 208.6 MB |
| Events in quadrant A | 8,437,545 | 1,363,632 |
| Events in quadrant B | 8,553,728 | 1,393,029 |
| Events in quadrant C | 8,434,728 | 1,378,599 |
| Events in quadrant D | 10,803,179 | 1,284,231 |
| Mode M0 | |||
|---|---|---|---|
| Quadrant | BADHDUFLAG | Total packets | Discarded packets |
| A | 0 | 37068 | 5 |
| B | 0 | 37147 | 4 |
| C | 0 | 36751 | 4 |
| D | 0 | 44283 | 4 |
| Mode SS | |||
|---|---|---|---|
| Quadrant | BADHDUFLAG | Total packets | Discarded packets |
| A | 0 | 358 | 0 |
| B | 0 | 358 | 0 |
| C | 0 | 358 | 0 |
| D | 0 | 358 | 0 |
| Mode M9 | |||
|---|---|---|---|
| Quadrant | BADHDUFLAG | Total packets | Discarded packets |
| A | 0 | 29 | 0 |
| B | 0 | 29 | 0 |
| C | 0 | 29 | 0 |
| D | 0 | 30 | 0 |
| Quadrant | Total seconds | Saturated seconds | Saturation percentage |
|---|---|---|---|
| A | 17488 | 259 | 1.481016% |
| B | 17488 | 198 | 1.132205% |
| C | 17488 | 139 | 0.794831% |
| D | 17488 | 872 | 4.986276% |
Noise dominated data is calculated using 1-second bins in cleaned event files. If a bin has >2000 counts, and if more than 50% of those come from <1% of pixels, then it is considered to be noise-dominated and hence unusable.
| Quadrant | # 1 sec bins | Bins with >0 counts | Bins with >2000 counts | High rate bins dominated by noise | Noise dominated (total time) | Noise dominated (detector-on time) | Marked lightcurve |
|---|---|---|---|---|---|---|---|
| A | 23394 | 17490 | 90 | 90 | 0.38% | 0.51% | 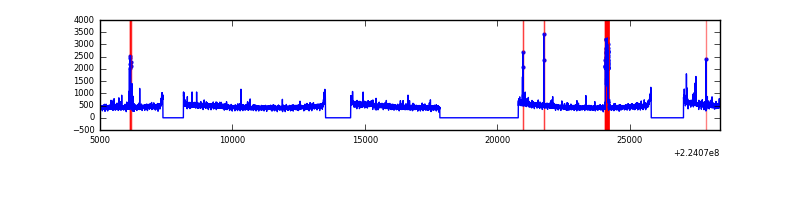 |
| B | 23394 | 17490 | 18 | 18 | 0.08% | 0.10% |  |
| C | 23394 | 17490 | 1 | 1 | 0.00% | 0.01% | 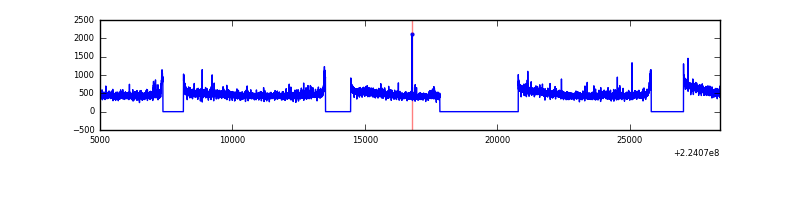 |
| D | 23394 | 17489 | 647 | 647 | 2.77% | 3.70% |  |
Top three noisy pixels from each quadrant. If the there are fewer than three noisy pixels in the level2.evt file, extra rows are filled as -1
| Pixel properties | Quadrant properties | ||||||
|---|---|---|---|---|---|---|---|
| Quadrant | DetID | PixID | Counts | Sigma | Mean | Median | Sigma |
| A | 15 | 239 | 321120 | 753.23 | 2093 | 2050 | 423.6 |
| A | 15 | 234 | 28918 | 63.43 | 2093 | 2050 | 423.6 |
| A | 14 | 111 | 21351 | 45.56 | 2093 | 2050 | 423.6 |
| B | 0 | 214 | 160815 | 392.98 | 2119 | 2067 | 404.0 |
| B | 11 | 51 | 139696 | 340.7 | 2119 | 2067 | 404.0 |
| B | 12 | 111 | 40282 | 94.6 | 2119 | 2067 | 404.0 |
| C | 9 | 68 | 235124 | 487.95 | 2065 | 2074 | 477.6 |
| C | 8 | 229 | 98766 | 202.45 | 2065 | 2074 | 477.6 |
| C | 1 | 16 | 21133 | 39.9 | 2065 | 2074 | 477.6 |
| D | 1 | 52 | 1908557 | 3893.56 | 2012 | 1951 | 489.7 |
| D | 2 | 216 | 389007 | 790.42 | 2012 | 1951 | 489.7 |
| D | 2 | 14 | 327149 | 664.1 | 2012 | 1951 | 489.7 |
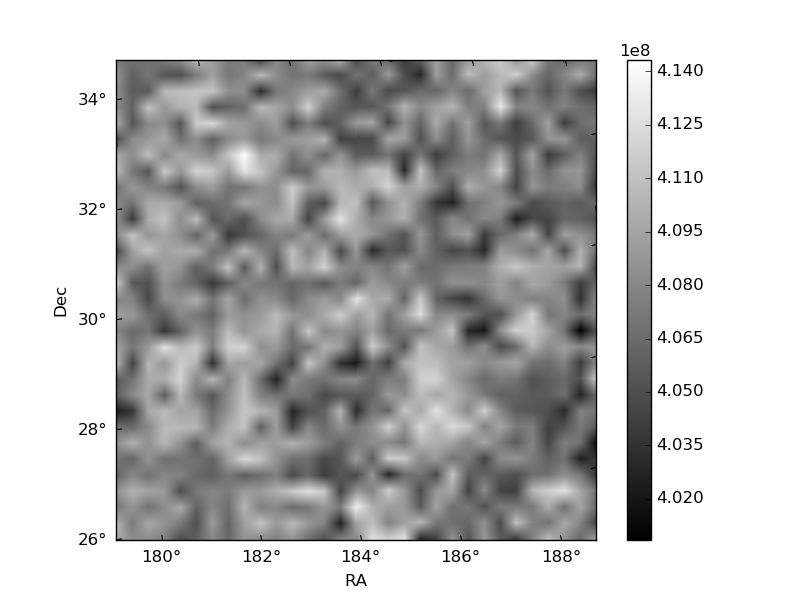
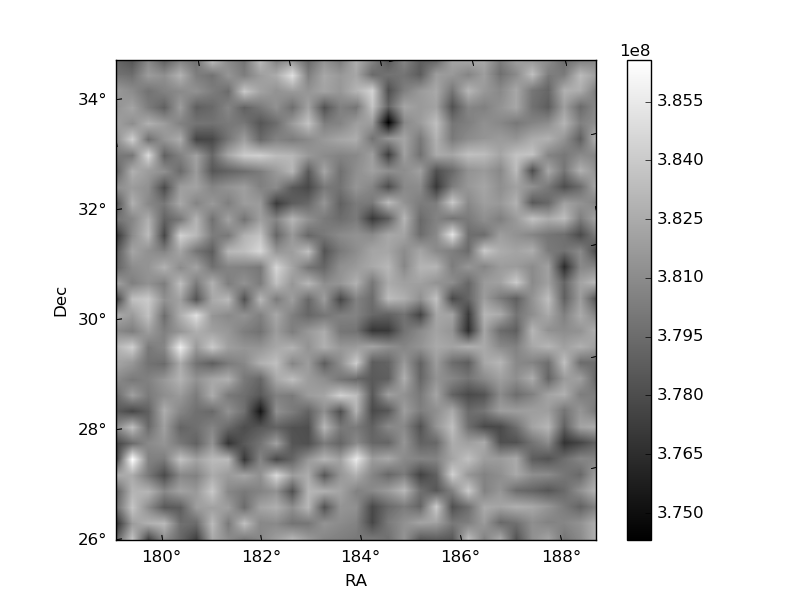
Histogram calculated using DETX and DETY for each event in the final _common_clean file
| Quadrant A | 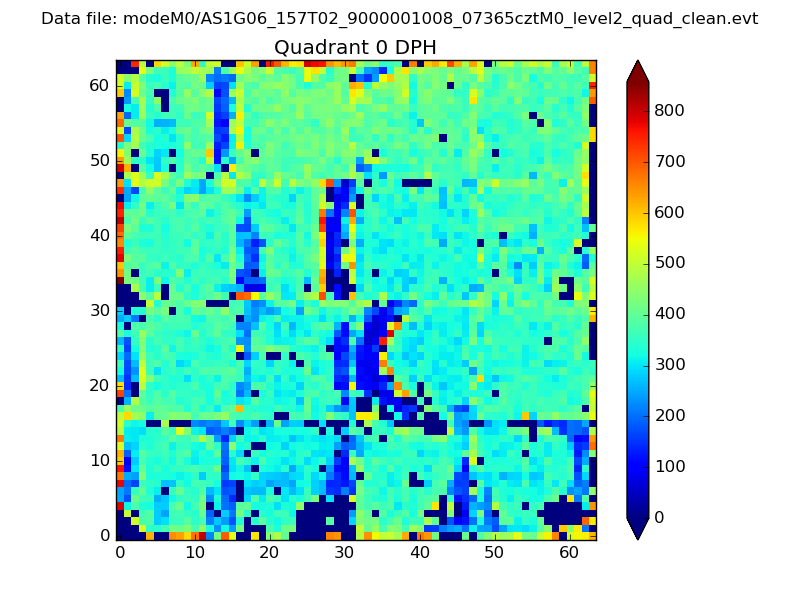 |
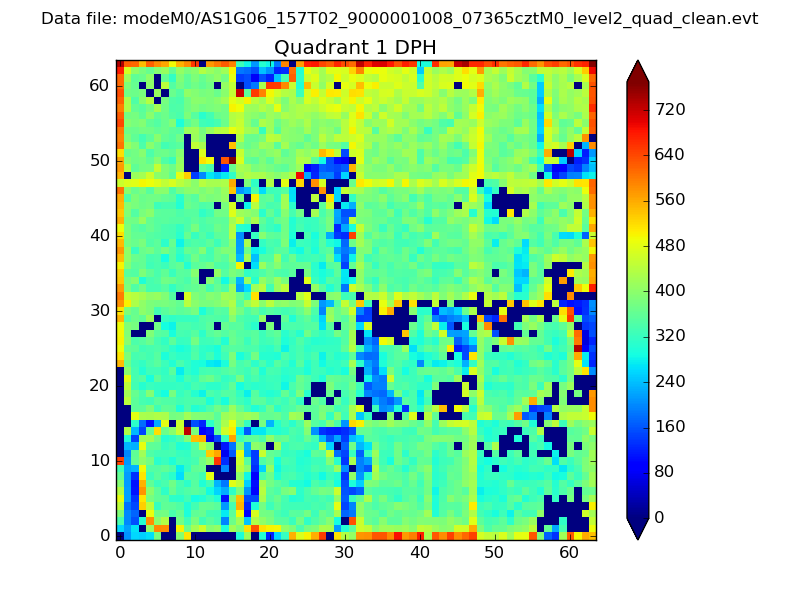 |
Quadrant B |
|---|---|---|---|
| Quadrant D | 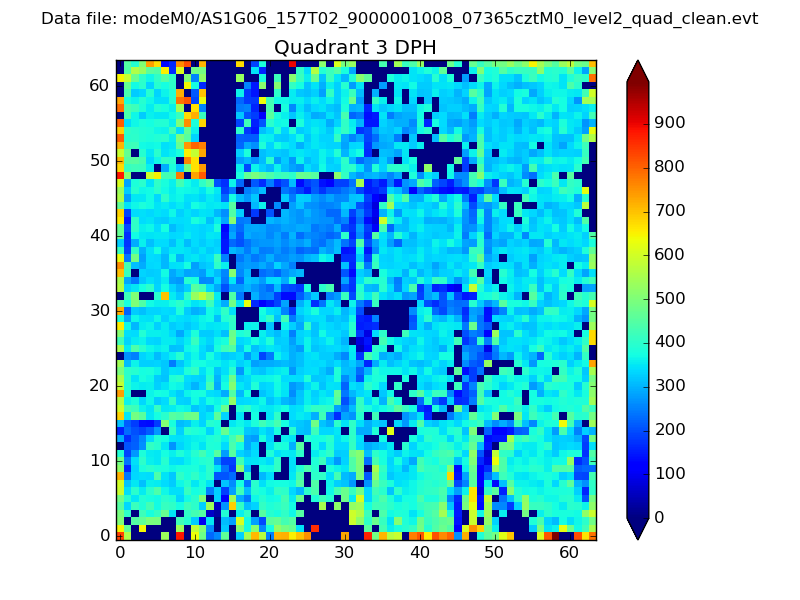 |
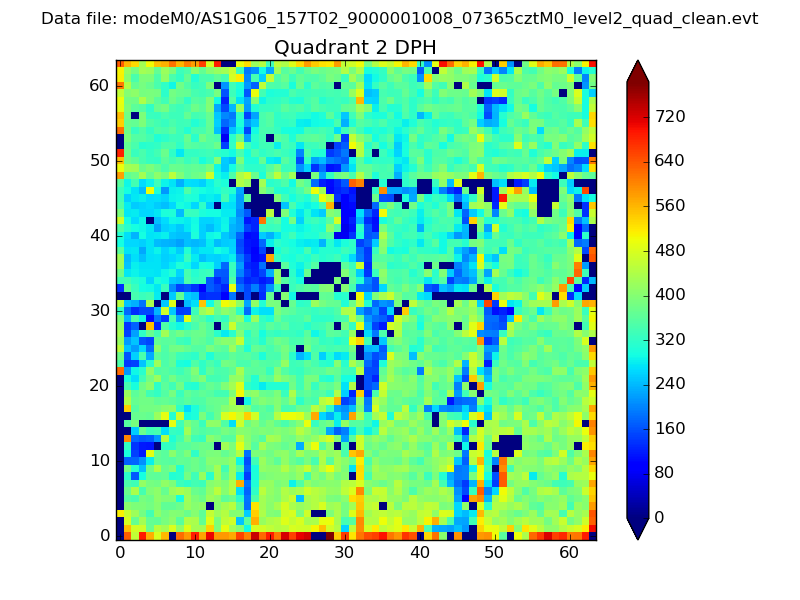 |
Quadrant C |
| Plot type | Count rate plots | Images |
|---|---|---|
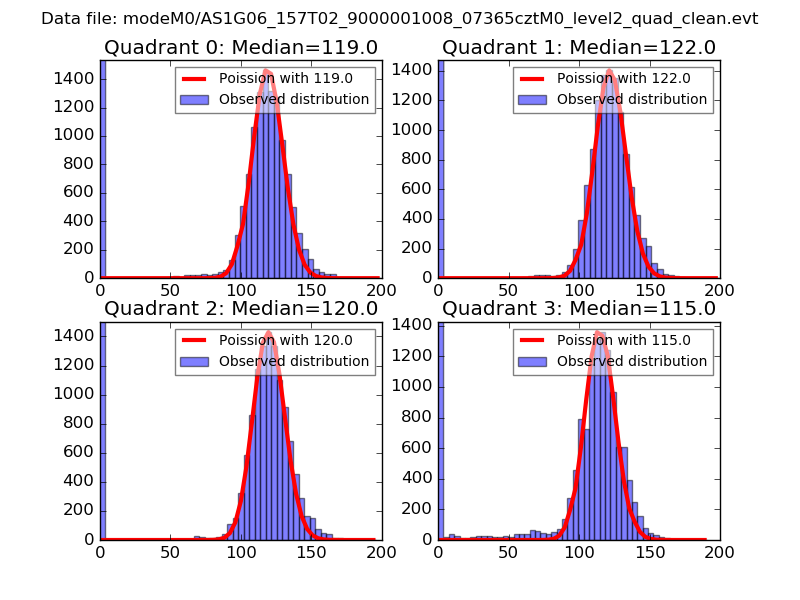
| Comparison with Poisson distribution Blue bars denote a histogram of data divided into 1 sec bins. Red curve is a Poisson curve with rate = median count rate of data. |
 |
 |
| Quadrant-wise count rates Data is divided into 100 sec bins |
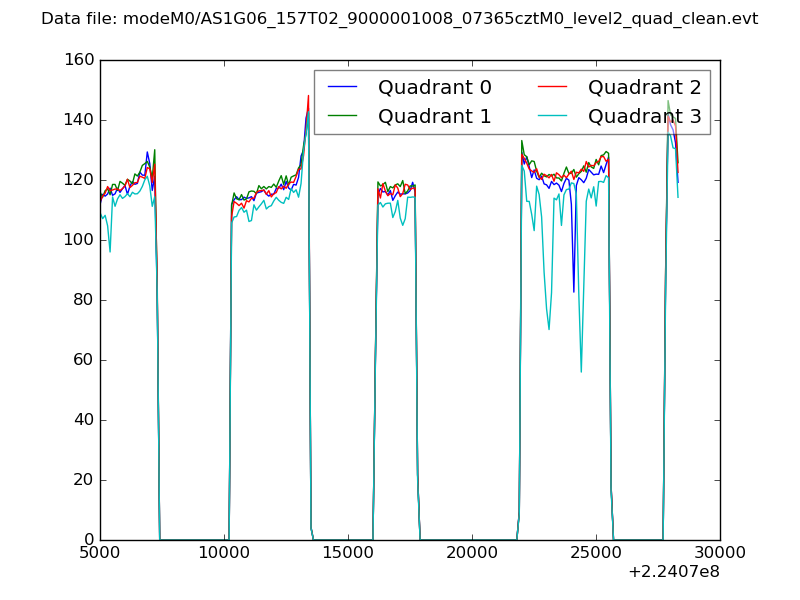 |
|
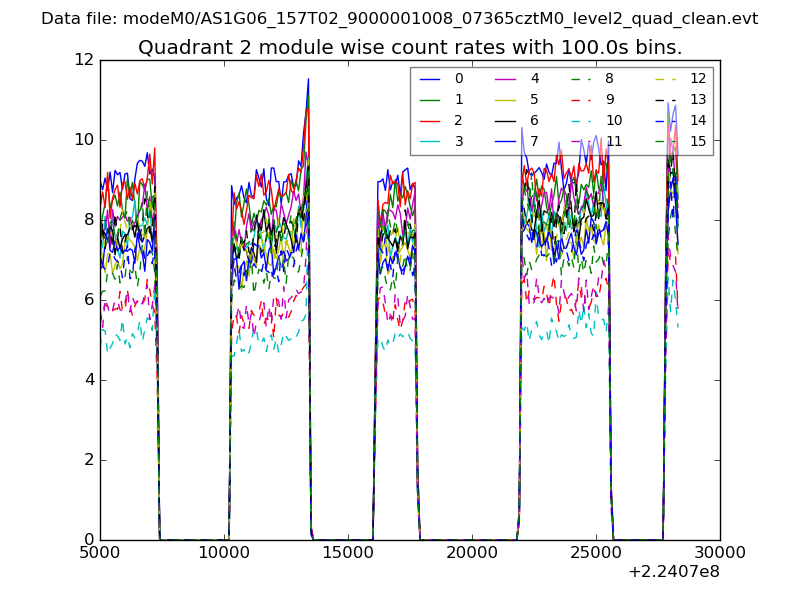
| Module-wise count rates for Quadrant A Data is divided into 100 sec bins |
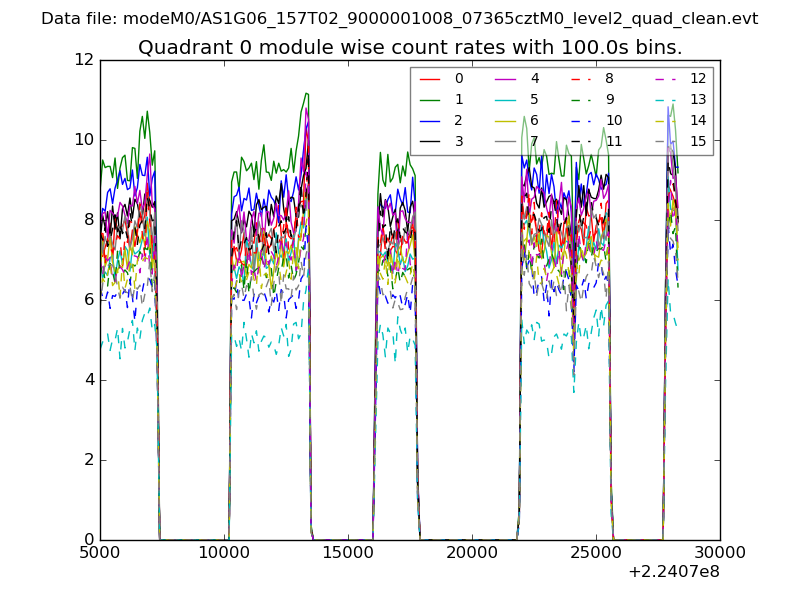 |
 |
| Module-wise count rates for Quadrant B Data is divided into 100 sec bins |
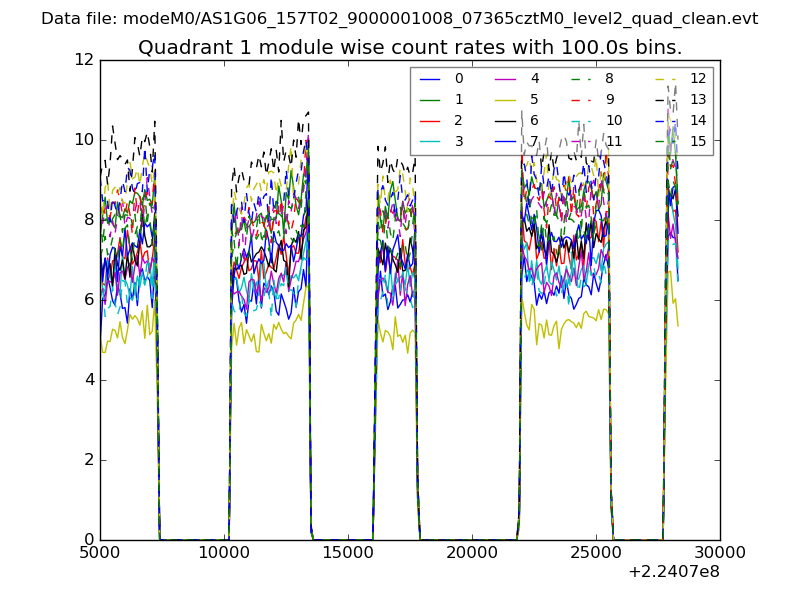 |
 |
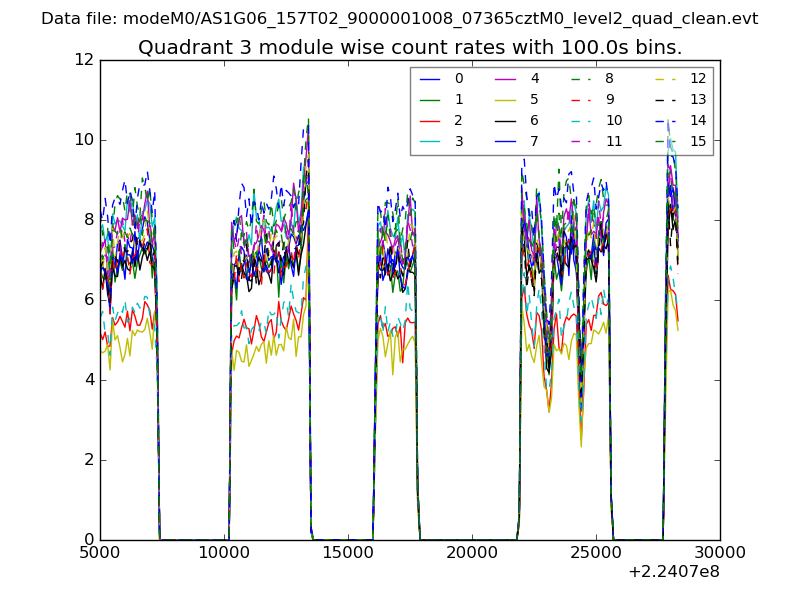
| Module-wise count rates for Quadrant C Data is divided into 100 sec bins |
 |
 |
| Module-wise count rates for Quadrant D Data is divided into 100 sec bins |
 |
 |
| Parameter | Plot |
|---|---|
| CZT HV Monitor | 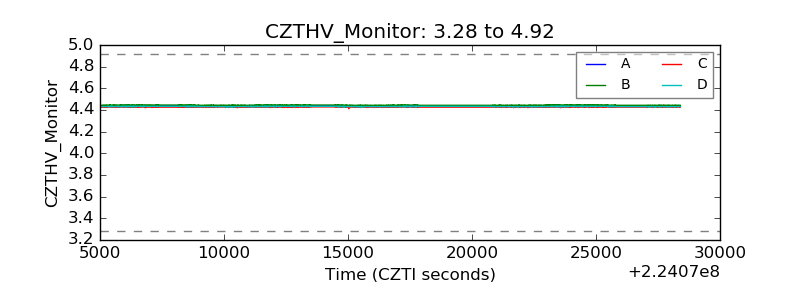 |
| D_VDD |  |
| Temperature 1 | 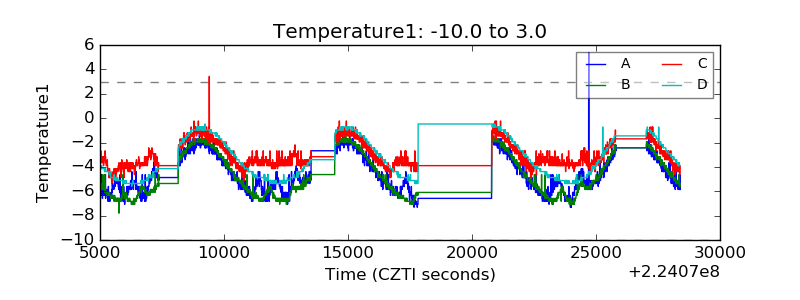 |
| Veto HV Monitor | 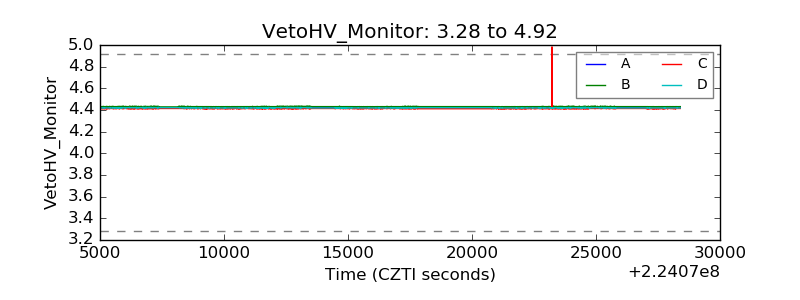 |
| Veto LLD | 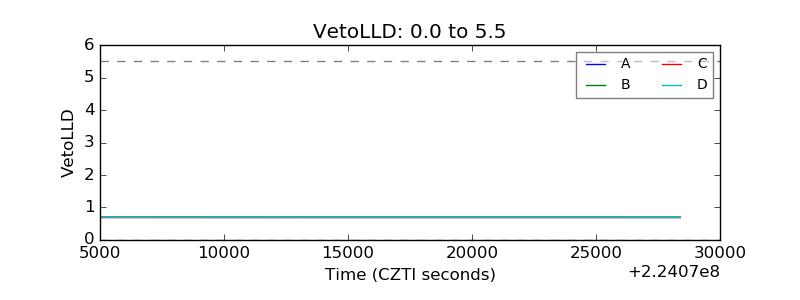 |
| Alpha Counter | 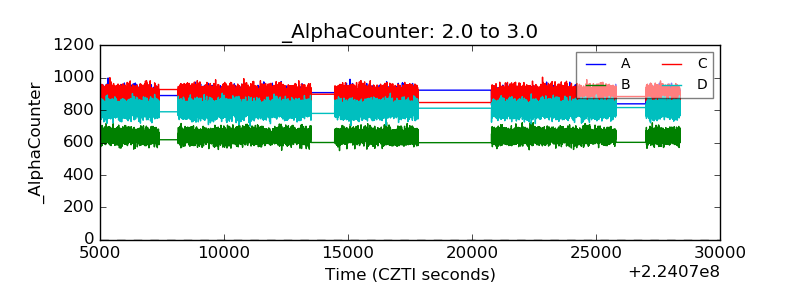 |
| _CPM_Rate | 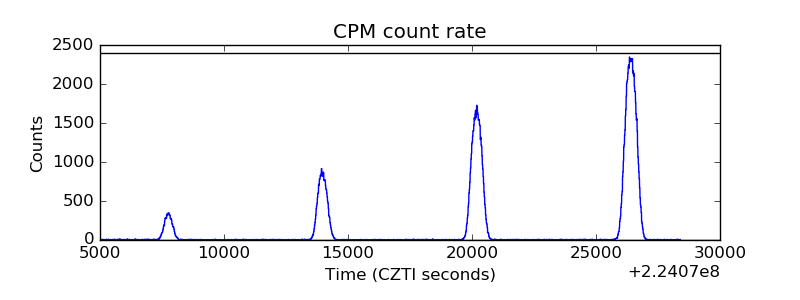 |
| CZT Counter | 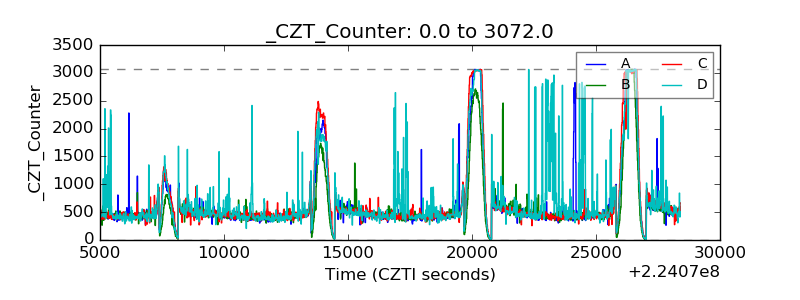 |
| +2.5 Volts monitor |  |
| +5 Volts monitor |  |
| _ROLL_ROT | 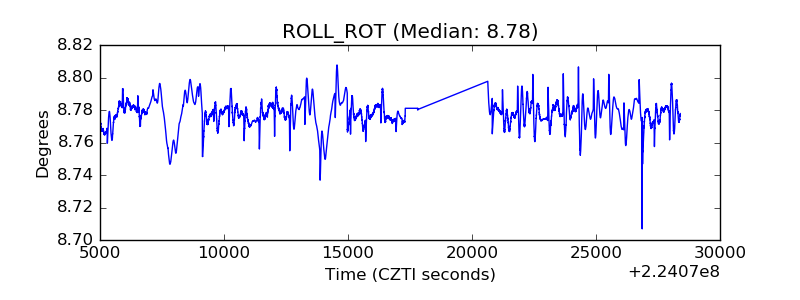 |
| _Roll_DEC | 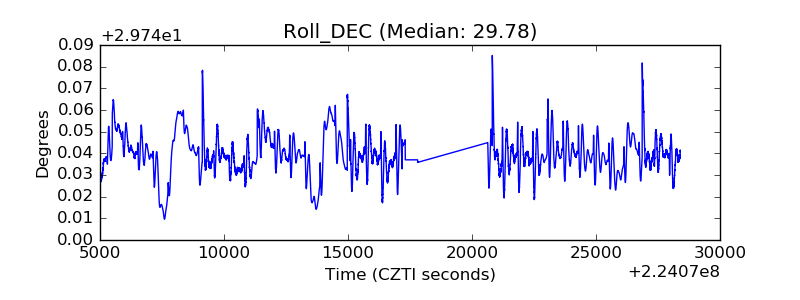 |
| _Roll_RA | 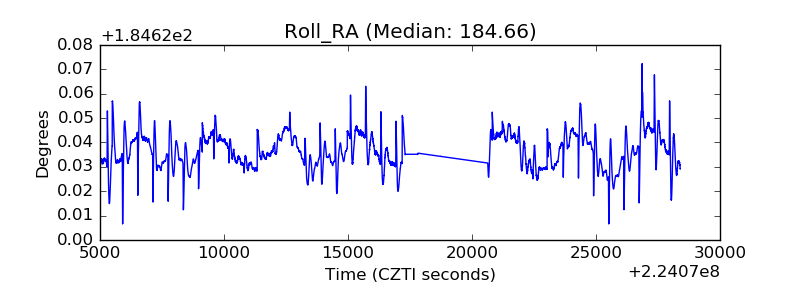 |
| Veto Counter | 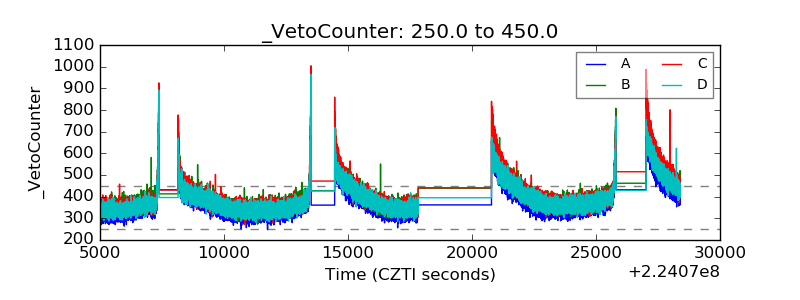 |