| Param | Original file | Final file |
|---|---|---|
| Filename | modeM0/AS1G06_157T02_9000001008_07366cztM0_level2.evt | modeM0/AS1G06_157T02_9000001008_07366cztM0_level2_quad_clean.evt |
| Size (bytes) | 512,107,200 | 90,892,800 |
| Size | 488.4 MB | 86.7 MB |
| Events in quadrant A | 3,413,814 | 574,495 |
| Events in quadrant B | 3,281,590 | 594,067 |
| Events in quadrant C | 3,545,242 | 589,294 |
| Events in quadrant D | 4,836,468 | 550,020 |
| Mode M0 | |||
|---|---|---|---|
| Quadrant | BADHDUFLAG | Total packets | Discarded packets |
| A | 0 | 14481 | 3 |
| B | 0 | 13979 | 2 |
| C | 0 | 14510 | 2 |
| D | 0 | 18750 | 2 |
| Mode SS | |||
|---|---|---|---|
| Quadrant | BADHDUFLAG | Total packets | Discarded packets |
| A | 0 | 132 | 0 |
| B | 0 | 132 | 0 |
| C | 0 | 132 | 0 |
| D | 0 | 132 | 0 |
| Mode M9 | |||
|---|---|---|---|
| Quadrant | BADHDUFLAG | Total packets | Discarded packets |
| A | 0 | 25 | 0 |
| B | 0 | 25 | 0 |
| C | 0 | 25 | 0 |
| D | 0 | 25 | 0 |
| Quadrant | Total seconds | Saturated seconds | Saturation percentage |
|---|---|---|---|
| A | 6369 | 122 | 1.915528% |
| B | 6369 | 84 | 1.318888% |
| C | 6369 | 77 | 1.208981% |
| D | 6369 | 357 | 5.605276% |
Noise dominated data is calculated using 1-second bins in cleaned event files. If a bin has >2000 counts, and if more than 50% of those come from <1% of pixels, then it is considered to be noise-dominated and hence unusable.
| Quadrant | # 1 sec bins | Bins with >0 counts | Bins with >2000 counts | High rate bins dominated by noise | Noise dominated (total time) | Noise dominated (detector-on time) | Marked lightcurve |
|---|---|---|---|---|---|---|---|
| A | 8909 | 6371 | 38 | 38 | 0.43% | 0.60% | 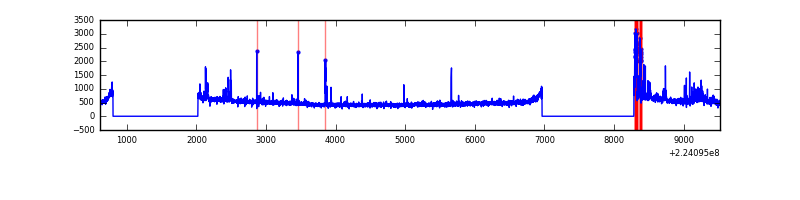 |
| B | 8909 | 6371 | 1 | 1 | 0.01% | 0.02% | 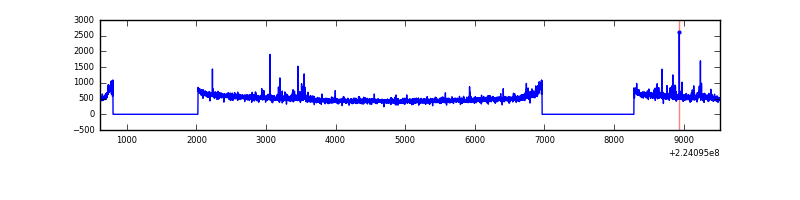 |
| C | 8909 | 6371 | 0 | 0 | 0.00% | 0.00% | 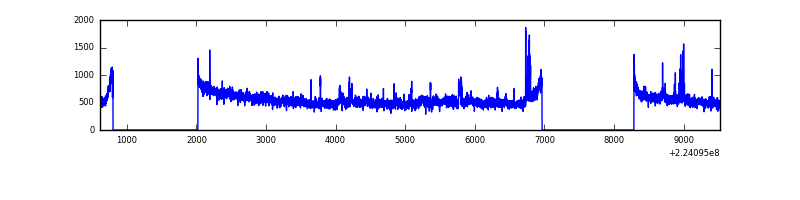 |
| D | 8909 | 6369 | 250 | 250 | 2.81% | 3.93% | 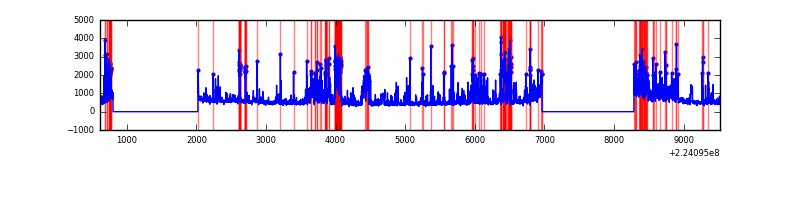 |
Top three noisy pixels from each quadrant. If the there are fewer than three noisy pixels in the level2.evt file, extra rows are filled as -1
| Pixel properties | Quadrant properties | ||||||
|---|---|---|---|---|---|---|---|
| Quadrant | DetID | PixID | Counts | Sigma | Mean | Median | Sigma |
| A | 15 | 239 | 130201 | 793.28 | 804 | 788 | 163.1 |
| A | 15 | 234 | 109589 | 666.93 | 804 | 788 | 163.1 |
| A | 14 | 111 | 70553 | 427.65 | 804 | 788 | 163.1 |
| B | 0 | 214 | 71315 | 452.74 | 821 | 802 | 155.7 |
| B | 12 | 111 | 15013 | 91.24 | 821 | 802 | 155.7 |
| B | 11 | 111 | 11968 | 71.69 | 821 | 802 | 155.7 |
| C | 9 | 68 | 371008 | 1988.16 | 804 | 809 | 186.2 |
| C | 1 | 16 | 18701 | 96.09 | 804 | 809 | 186.2 |
| C | 8 | 229 | 18300 | 93.94 | 804 | 809 | 186.2 |
| D | 1 | 52 | 1025441 | 5292.53 | 784 | 761 | 193.6 |
| D | 2 | 216 | 309062 | 1592.39 | 784 | 761 | 193.6 |
| D | 14 | 34 | 204709 | 1053.4 | 784 | 761 | 193.6 |
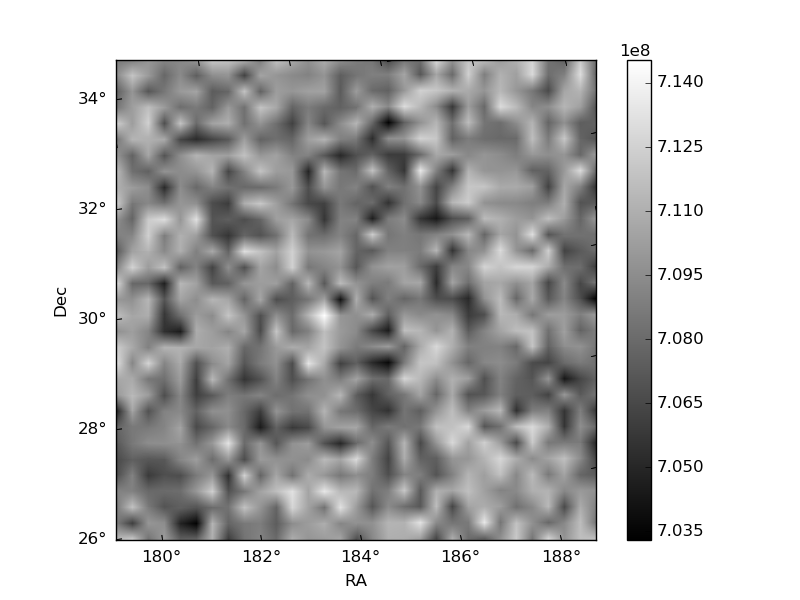
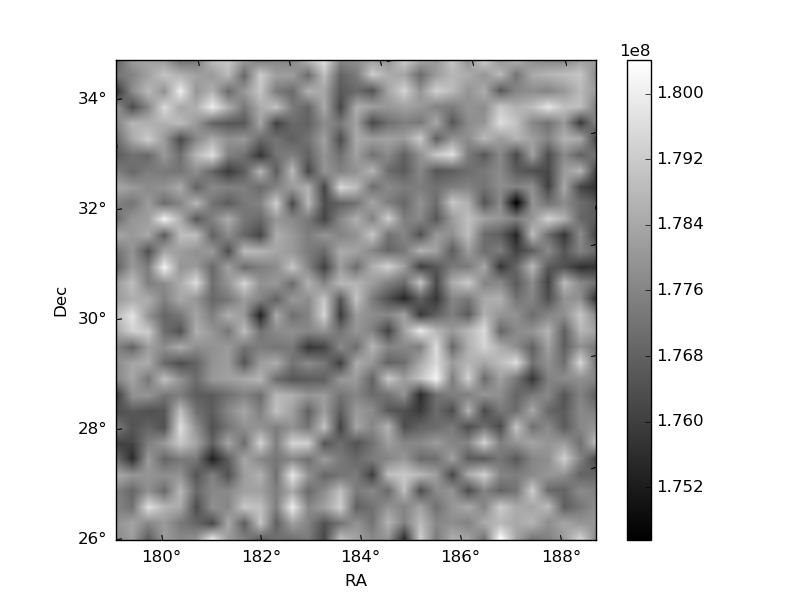
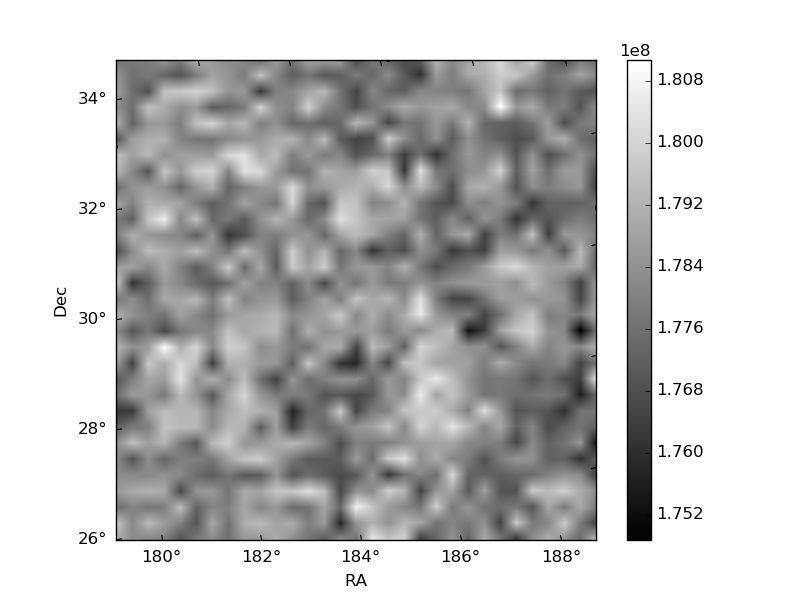
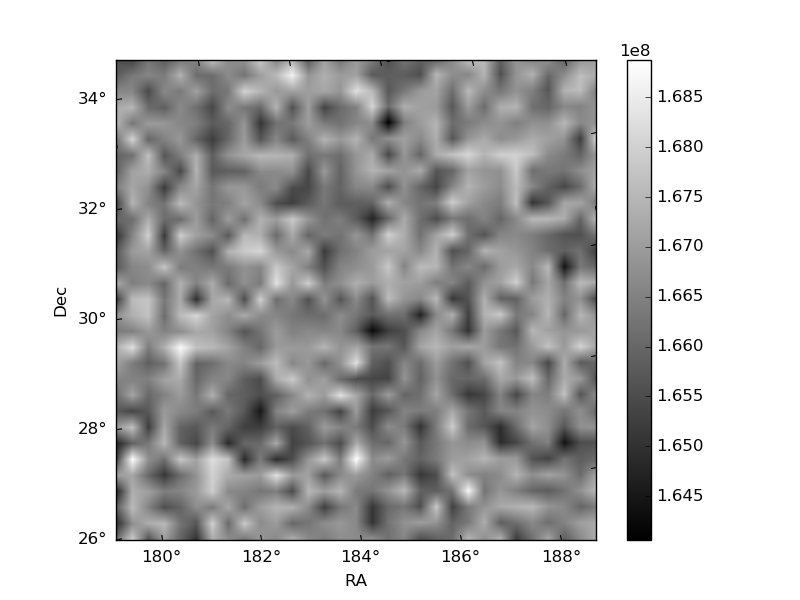
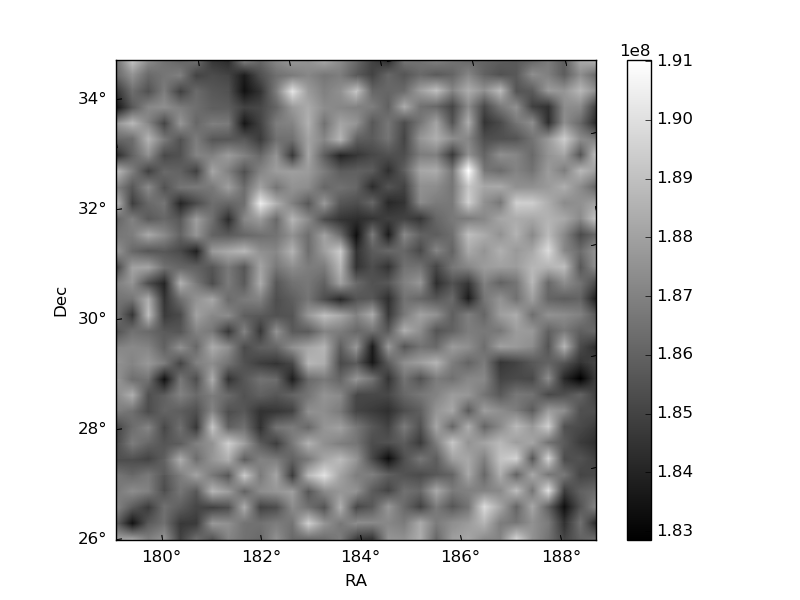
Histogram calculated using DETX and DETY for each event in the final _common_clean file
| Quadrant A | 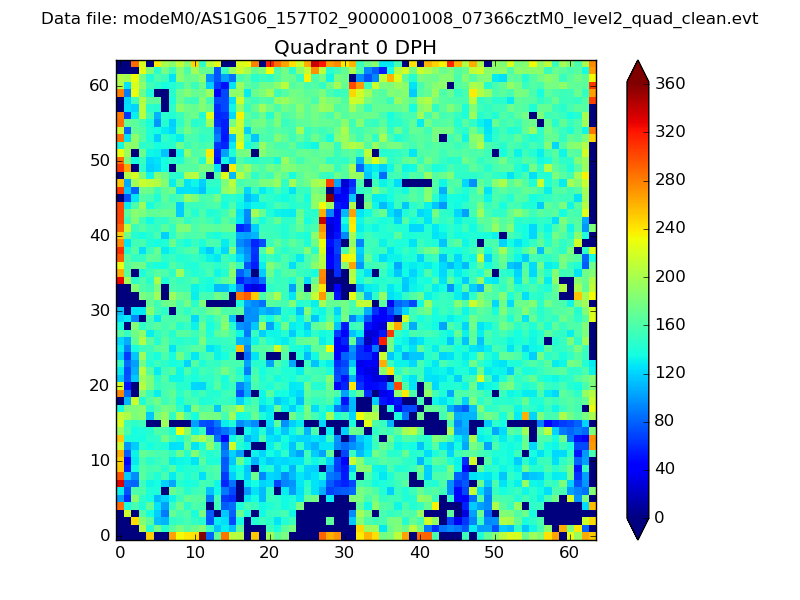 |
 |
Quadrant B |
|---|---|---|---|
| Quadrant D | 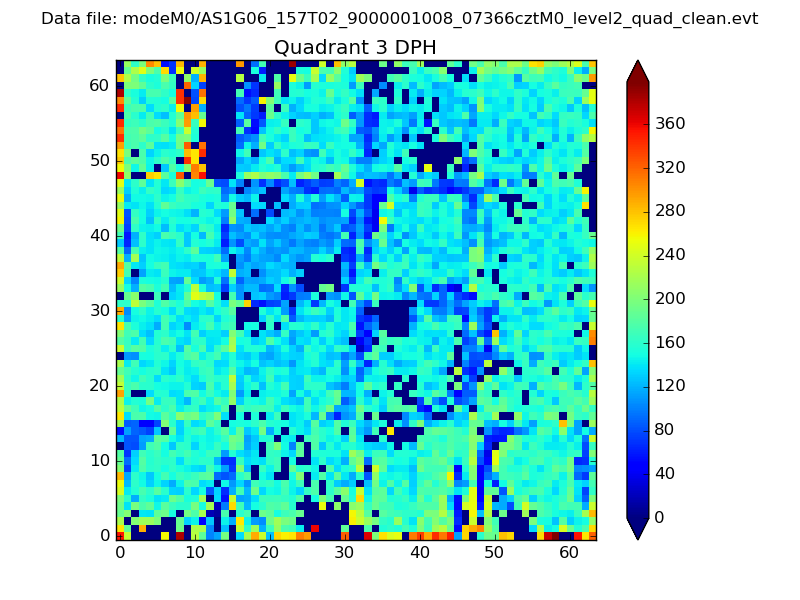 |
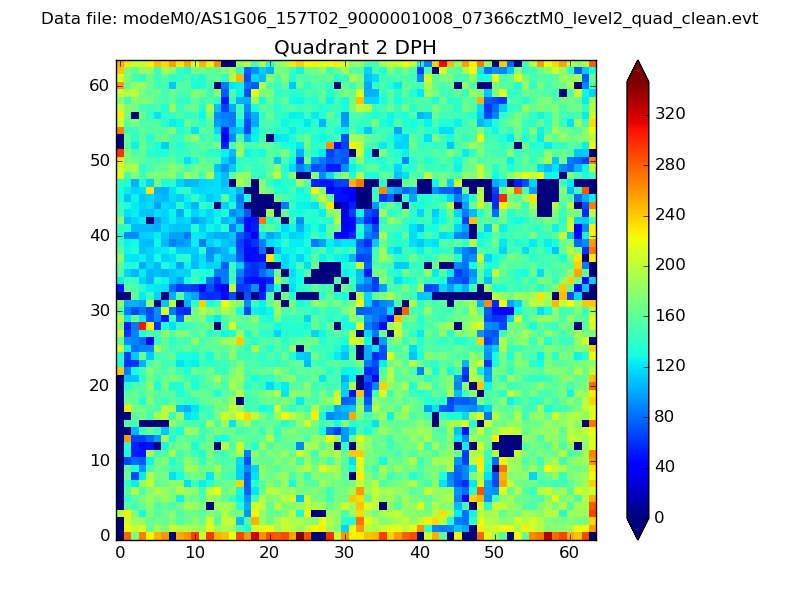 |
Quadrant C |
| Plot type | Count rate plots | Images |
|---|---|---|
| Comparison with Poisson distribution Blue bars denote a histogram of data divided into 1 sec bins. Red curve is a Poisson curve with rate = median count rate of data. |
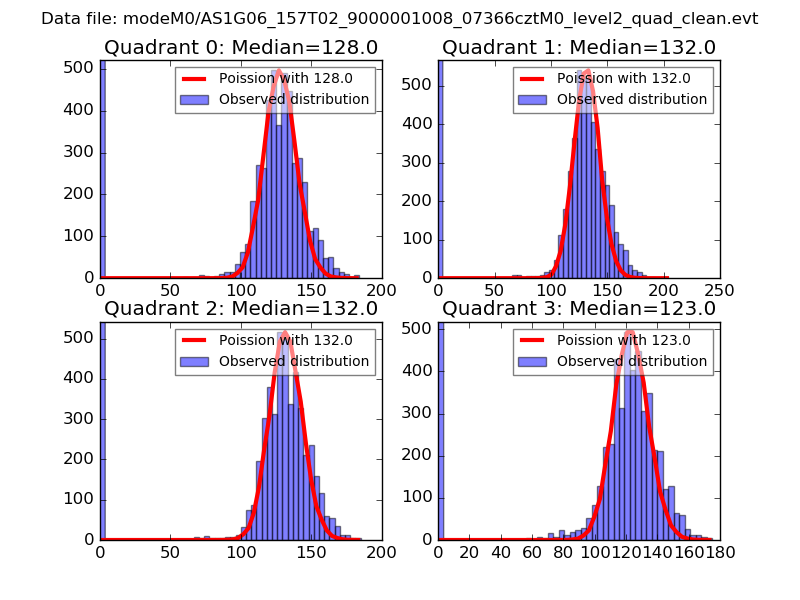 |
 |
| Quadrant-wise count rates Data is divided into 100 sec bins |
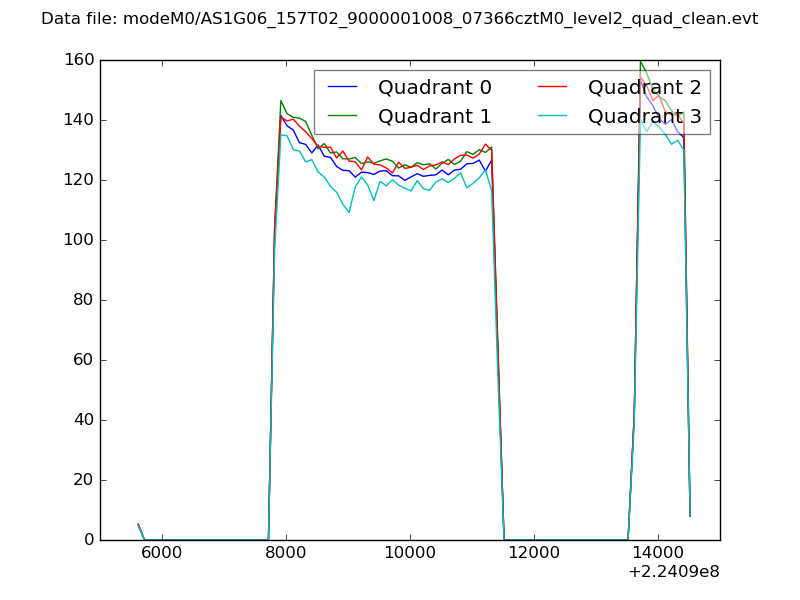 |
|
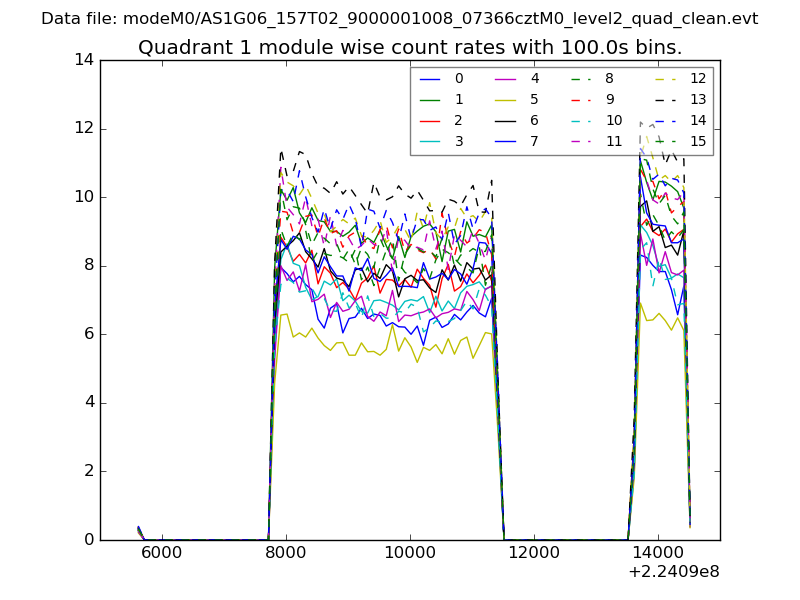
| Module-wise count rates for Quadrant A Data is divided into 100 sec bins |
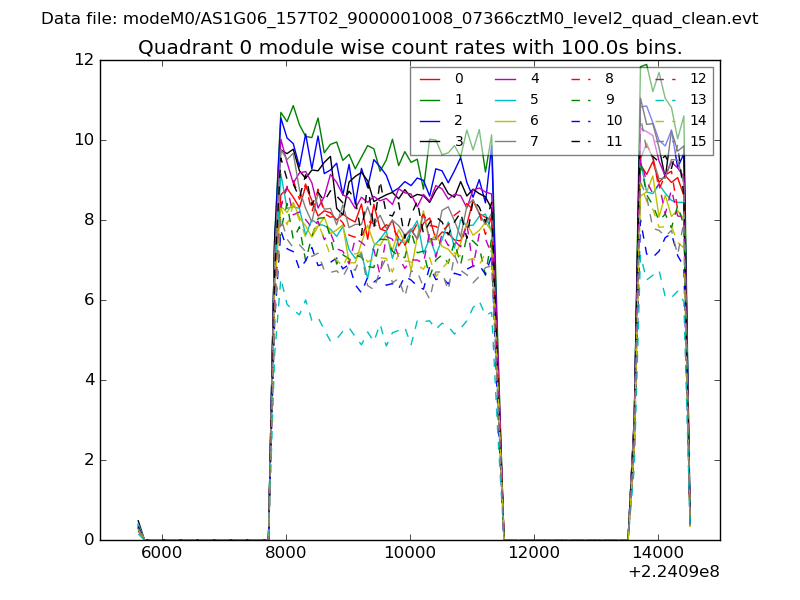 |
 |
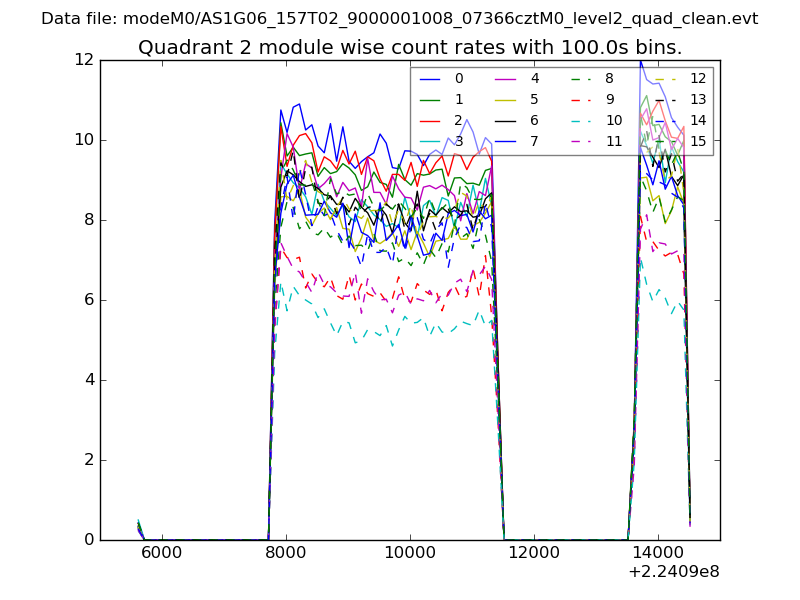
| Module-wise count rates for Quadrant B Data is divided into 100 sec bins |
 |
 |
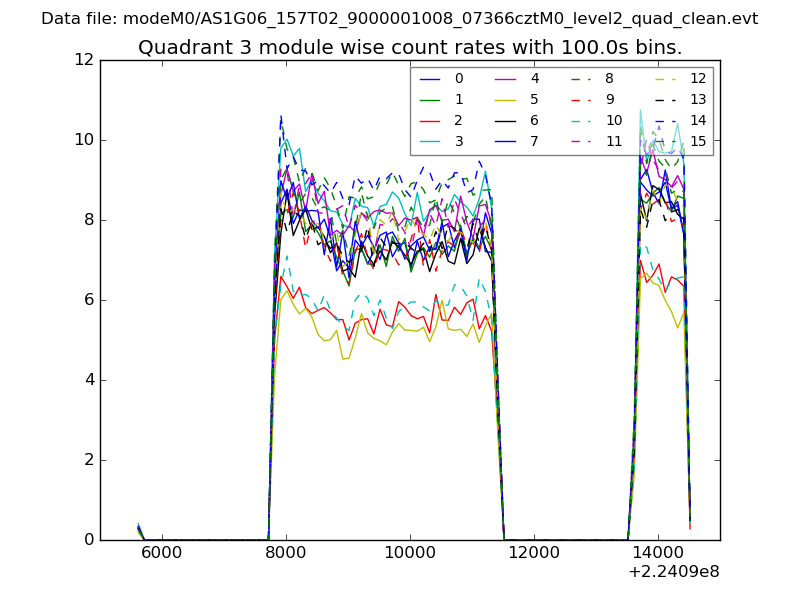
| Module-wise count rates for Quadrant C Data is divided into 100 sec bins |
 |
 |
| Module-wise count rates for Quadrant D Data is divided into 100 sec bins |
 |
 |
| Parameter | Plot |
|---|---|
| CZT HV Monitor | 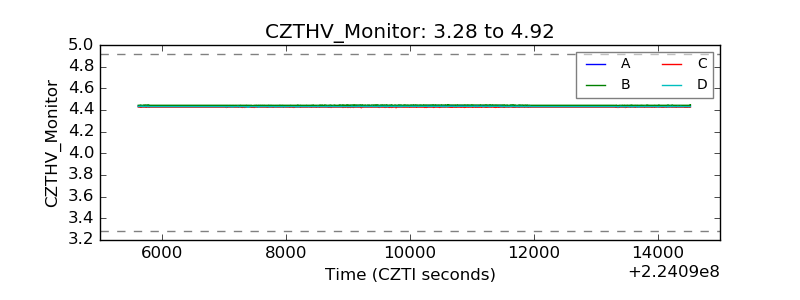 |
| D_VDD | 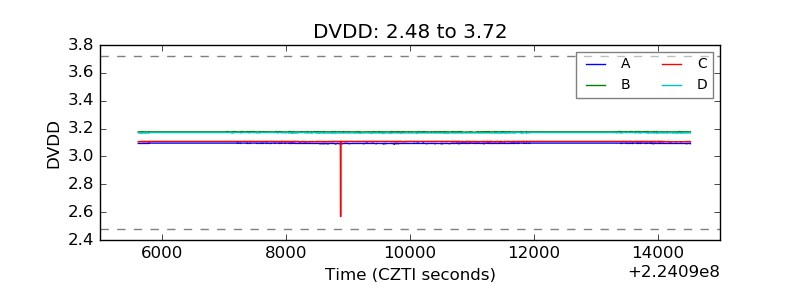 |
| Temperature 1 | 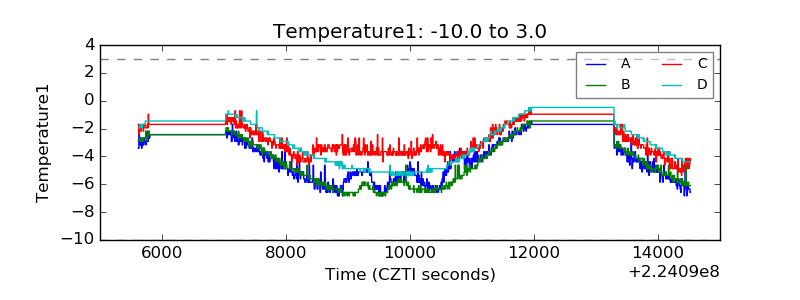 |
| Veto HV Monitor | 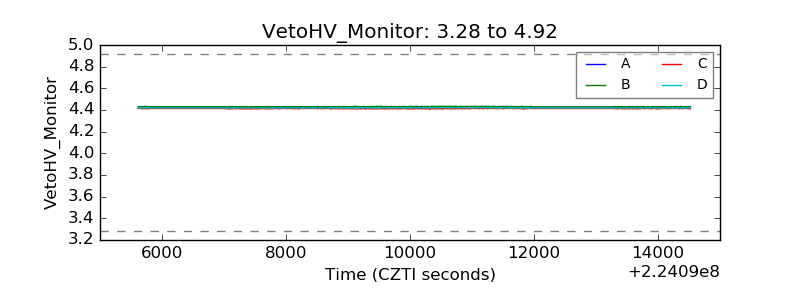 |
| Veto LLD | 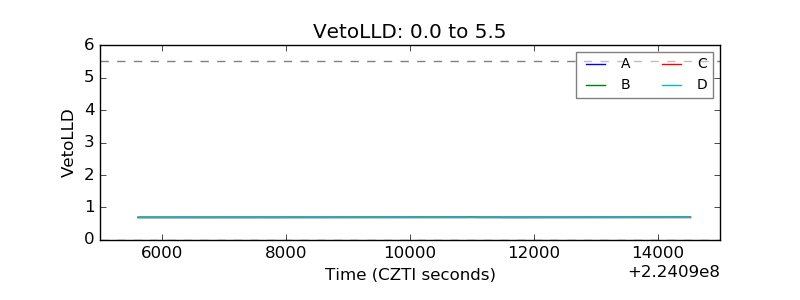 |
| Alpha Counter | 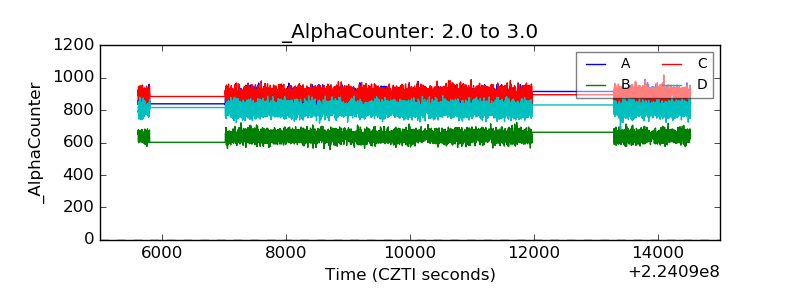 |
| _CPM_Rate | 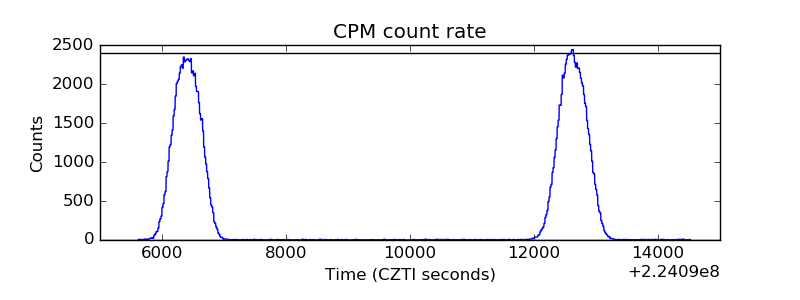 |
| CZT Counter | 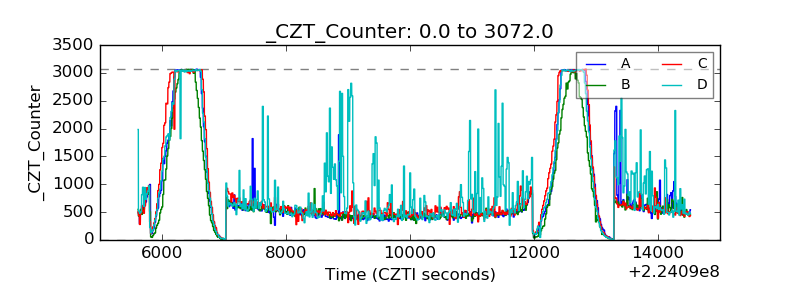 |
| +2.5 Volts monitor |  |
| +5 Volts monitor |  |
| _ROLL_ROT | 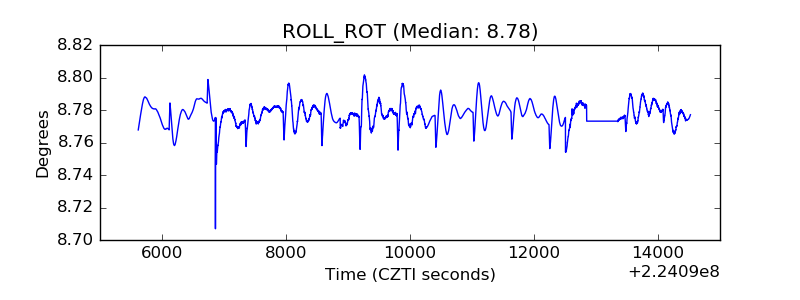 |
| _Roll_DEC | 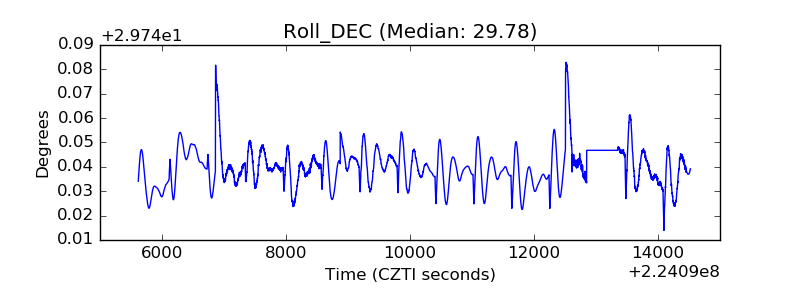 |
| _Roll_RA | 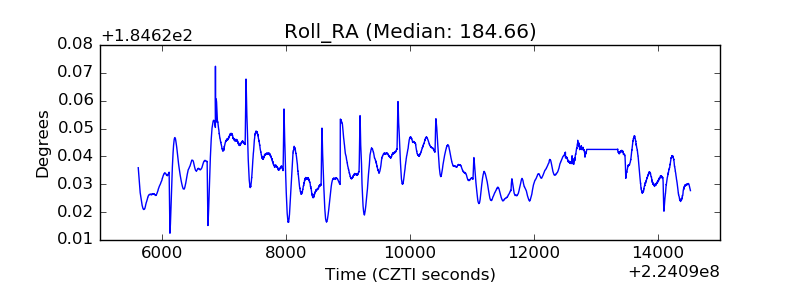 |
| Veto Counter | 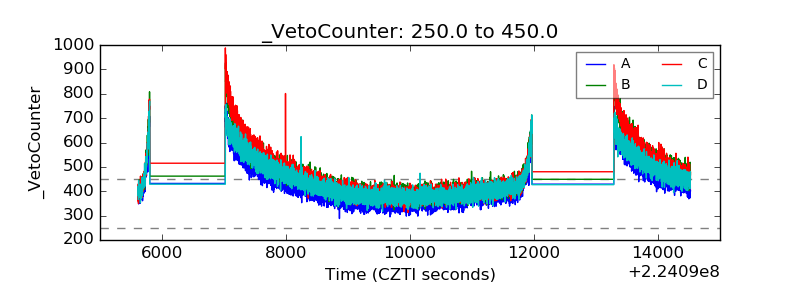 |