| Param | Original file | Final file |
|---|---|---|
| Filename | modeM0/AS1G06_157T02_9000001008_07368cztM0_level2.evt | modeM0/AS1G06_157T02_9000001008_07368cztM0_level2_quad_clean.evt |
| Size (bytes) | 472,078,080 | 100,958,400 |
| Size | 450.2 MB | 96.3 MB |
| Events in quadrant A | 3,352,640 | 651,558 |
| Events in quadrant B | 3,080,453 | 677,911 |
| Events in quadrant C | 3,313,816 | 669,083 |
| Events in quadrant D | 4,131,607 | 628,664 |
| Mode M0 | |||
|---|---|---|---|
| Quadrant | BADHDUFLAG | Total packets | Discarded packets |
| A | 0 | 13907 | 1 |
| B | 0 | 13275 | 1 |
| C | 0 | 13697 | 1 |
| D | 0 | 16526 | 1 |
| Mode SS | |||
|---|---|---|---|
| Quadrant | BADHDUFLAG | Total packets | Discarded packets |
| A | 0 | 124 | 0 |
| B | 0 | 124 | 0 |
| C | 0 | 124 | 0 |
| D | 0 | 124 | 0 |
| Mode M9 | |||
|---|---|---|---|
| Quadrant | BADHDUFLAG | Total packets | Discarded packets |
| A | 0 | 14 | 0 |
| B | 0 | 14 | 0 |
| C | 0 | 14 | 0 |
| D | 0 | 14 | 0 |
| Quadrant | Total seconds | Saturated seconds | Saturation percentage |
|---|---|---|---|
| A | 6170 | 74 | 1.199352% |
| B | 6170 | 26 | 0.421394% |
| C | 6170 | 33 | 0.534846% |
| D | 6170 | 136 | 2.204214% |
Noise dominated data is calculated using 1-second bins in cleaned event files. If a bin has >2000 counts, and if more than 50% of those come from <1% of pixels, then it is considered to be noise-dominated and hence unusable.
| Quadrant | # 1 sec bins | Bins with >0 counts | Bins with >2000 counts | High rate bins dominated by noise | Noise dominated (total time) | Noise dominated (detector-on time) | Marked lightcurve |
|---|---|---|---|---|---|---|---|
| A | 7540 | 6171 | 35 | 35 | 0.46% | 0.57% | 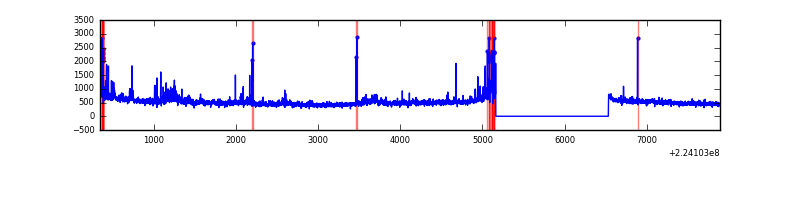 |
| B | 7540 | 6171 | 1 | 1 | 0.01% | 0.02% | 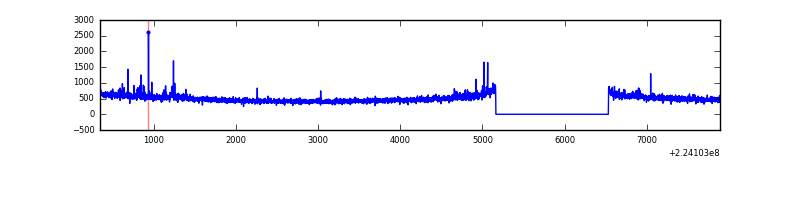 |
| C | 7540 | 6171 | 4 | 4 | 0.05% | 0.06% | 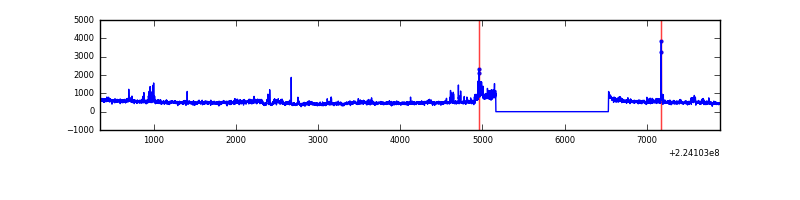 |
| D | 7540 | 6171 | 101 | 101 | 1.34% | 1.64% | 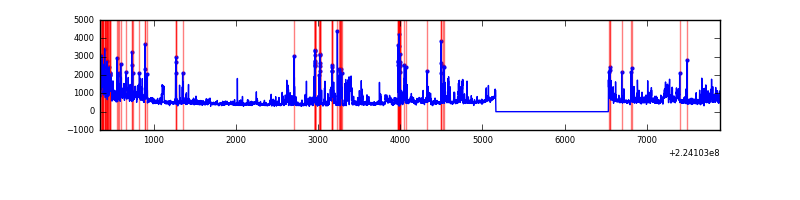 |
Top three noisy pixels from each quadrant. If the there are fewer than three noisy pixels in the level2.evt file, extra rows are filled as -1
| Pixel properties | Quadrant properties | ||||||
|---|---|---|---|---|---|---|---|
| Quadrant | DetID | PixID | Counts | Sigma | Mean | Median | Sigma |
| A | 15 | 234 | 237510 | 1543.66 | 754 | 738 | 153.4 |
| A | 14 | 111 | 100630 | 651.26 | 754 | 738 | 153.4 |
| A | 15 | 239 | 97496 | 630.83 | 754 | 738 | 153.4 |
| B | 0 | 214 | 65527 | 445.52 | 772 | 756 | 145.4 |
| B | 12 | 111 | 14430 | 94.05 | 772 | 756 | 145.4 |
| B | 11 | 111 | 11414 | 73.31 | 772 | 756 | 145.4 |
| C | 9 | 68 | 336694 | 1932.32 | 752 | 757 | 173.9 |
| C | 1 | 16 | 34400 | 193.52 | 752 | 757 | 173.9 |
| C | 8 | 229 | 11582 | 62.27 | 752 | 757 | 173.9 |
| D | 1 | 52 | 585000 | 3208.34 | 739 | 717 | 182.1 |
| D | 2 | 216 | 354412 | 1942.16 | 739 | 717 | 182.1 |
| D | 14 | 34 | 244801 | 1340.28 | 739 | 717 | 182.1 |
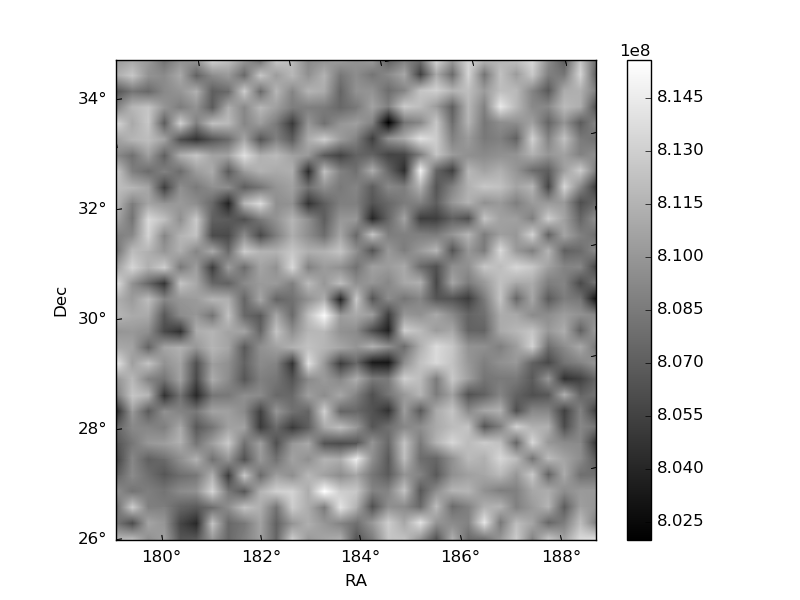
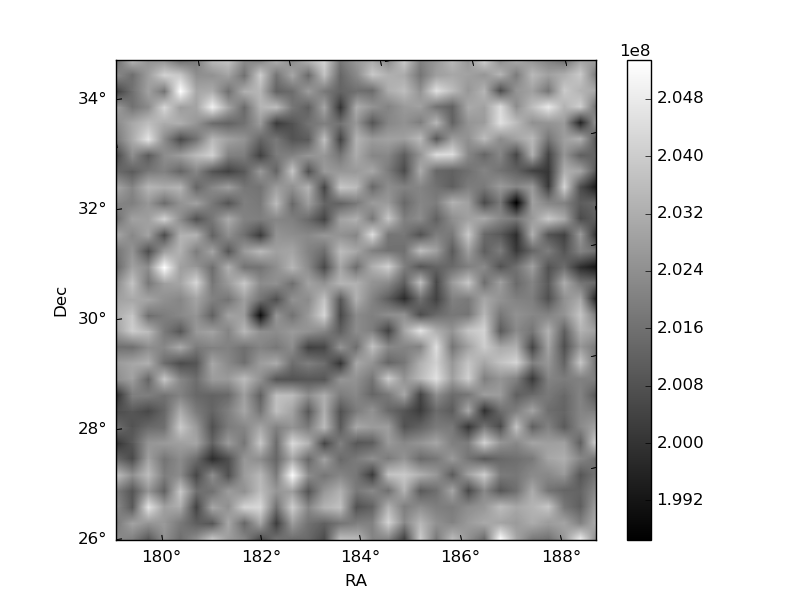
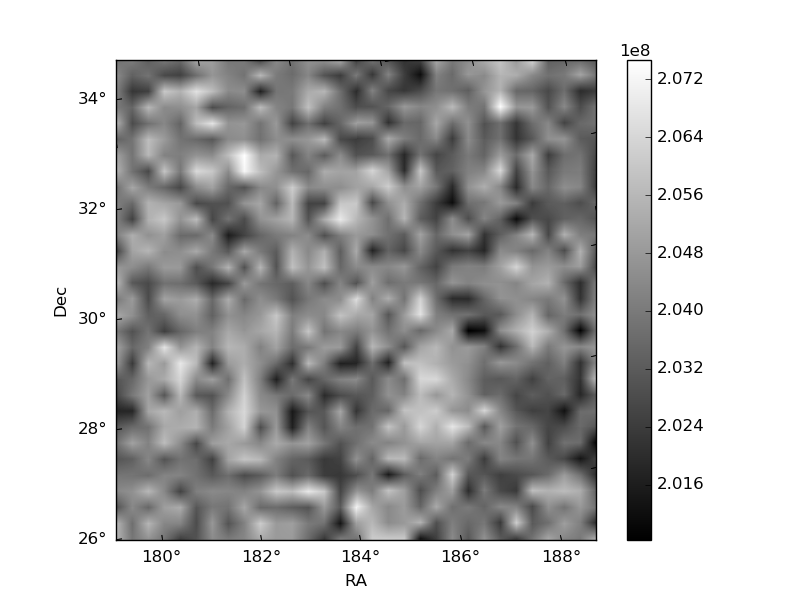
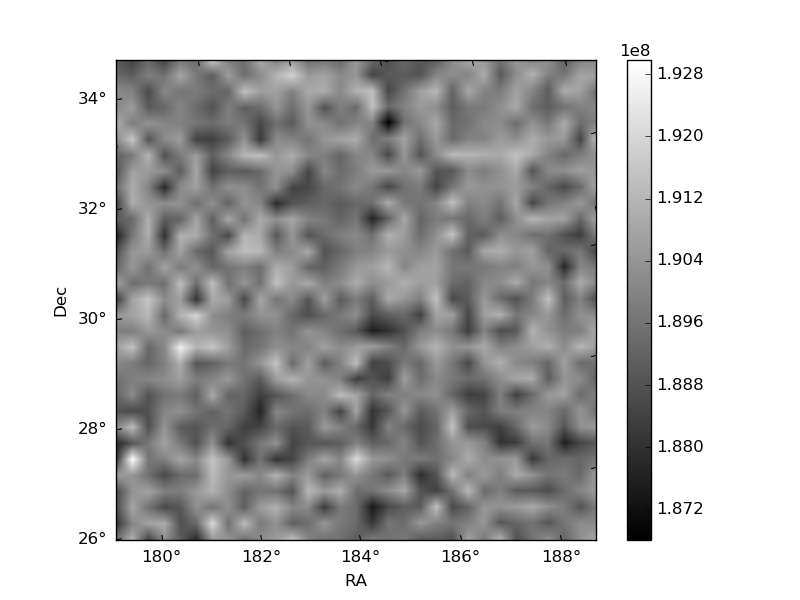
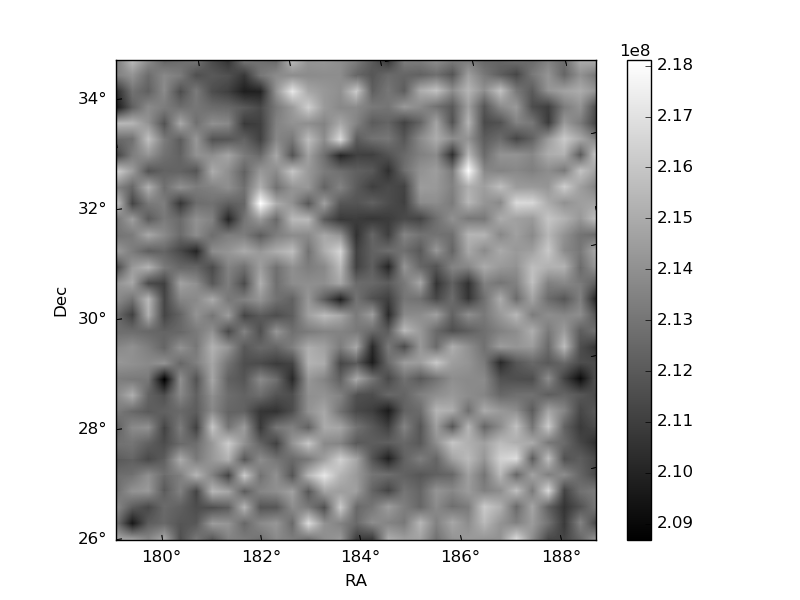
Histogram calculated using DETX and DETY for each event in the final _common_clean file
| Quadrant A | 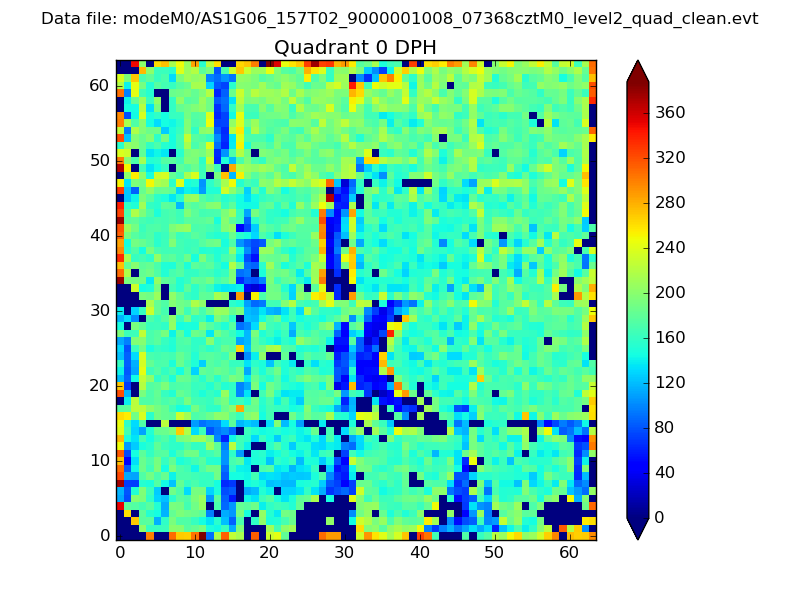 |
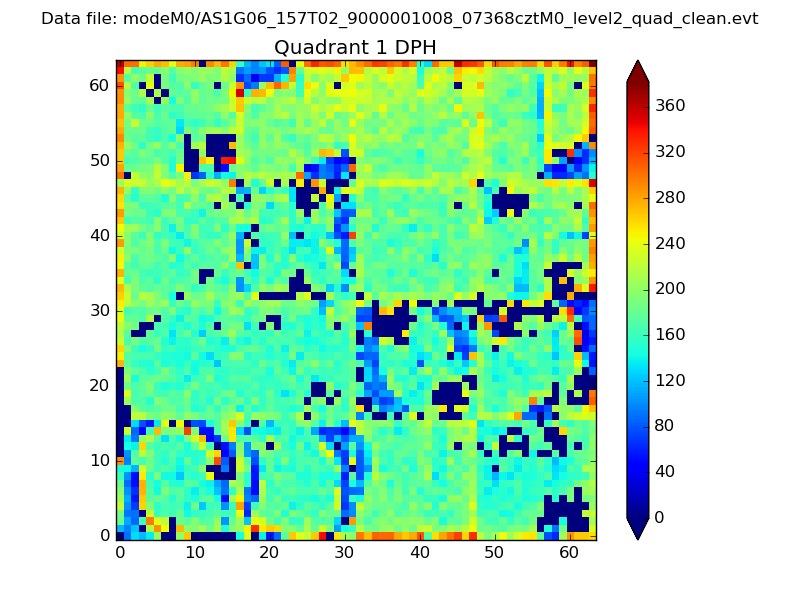 |
Quadrant B |
|---|---|---|---|
| Quadrant D | 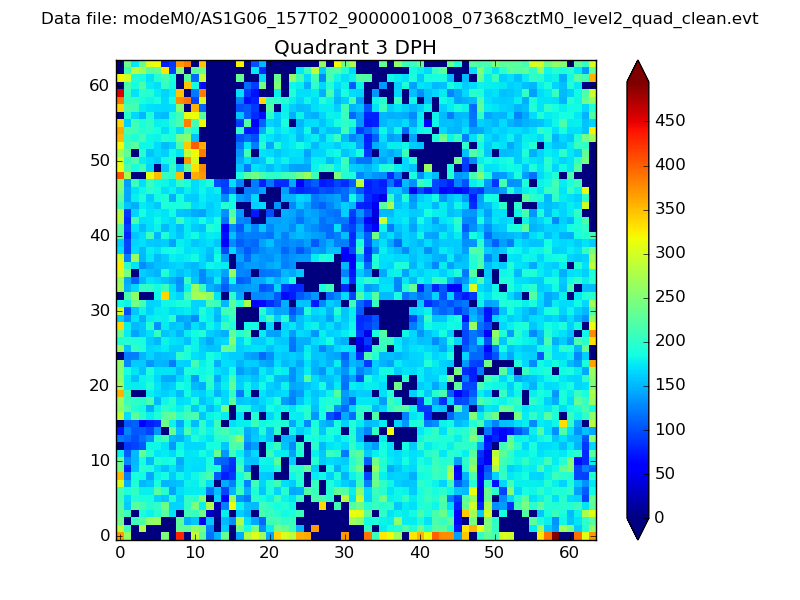 |
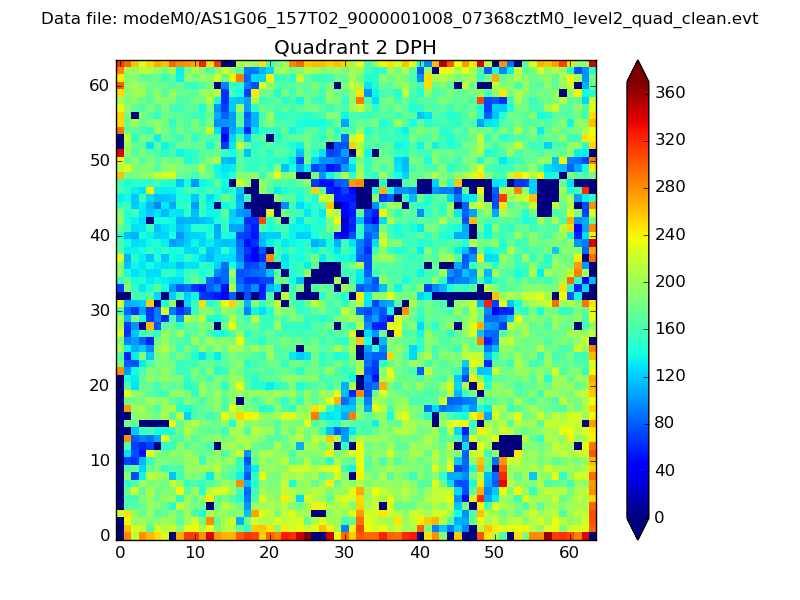 |
Quadrant C |
| Plot type | Count rate plots | Images |
|---|---|---|
| Comparison with Poisson distribution Blue bars denote a histogram of data divided into 1 sec bins. Red curve is a Poisson curve with rate = median count rate of data. |
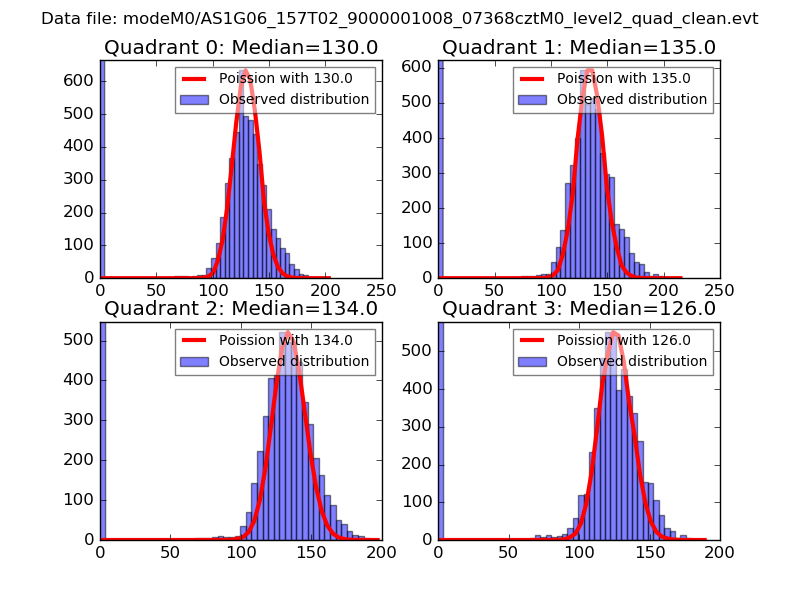 |
 |
| Quadrant-wise count rates Data is divided into 100 sec bins |
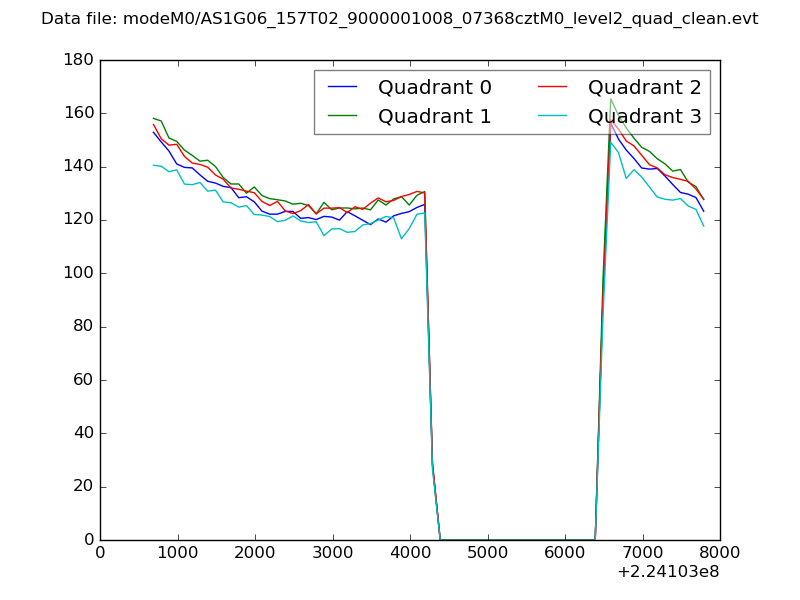 |
|
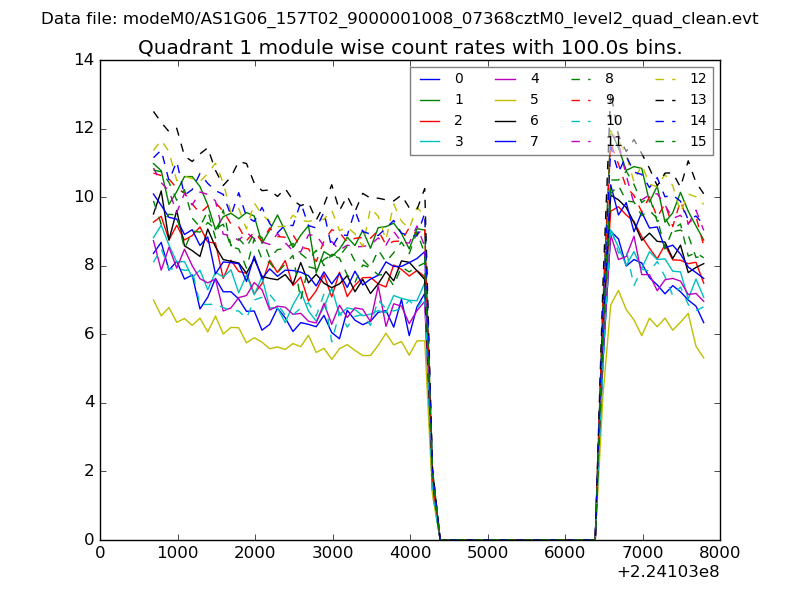
| Module-wise count rates for Quadrant A Data is divided into 100 sec bins |
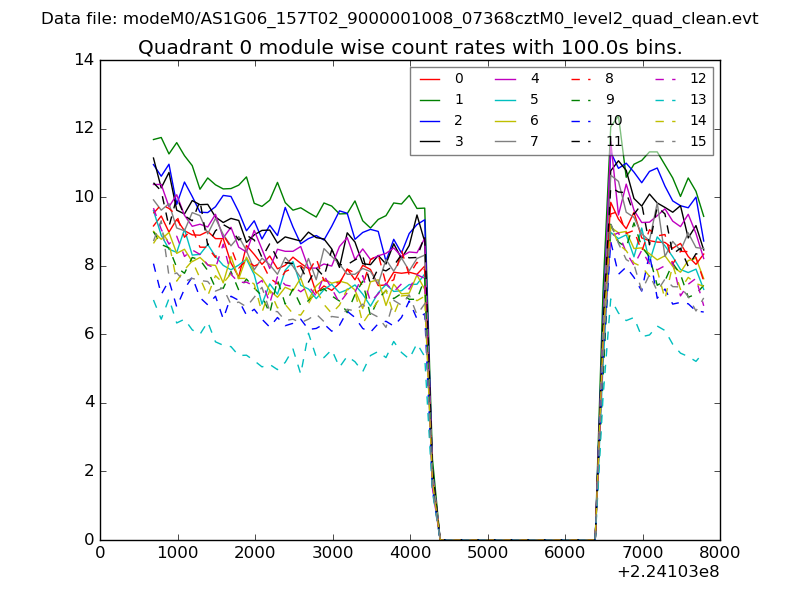 |
 |
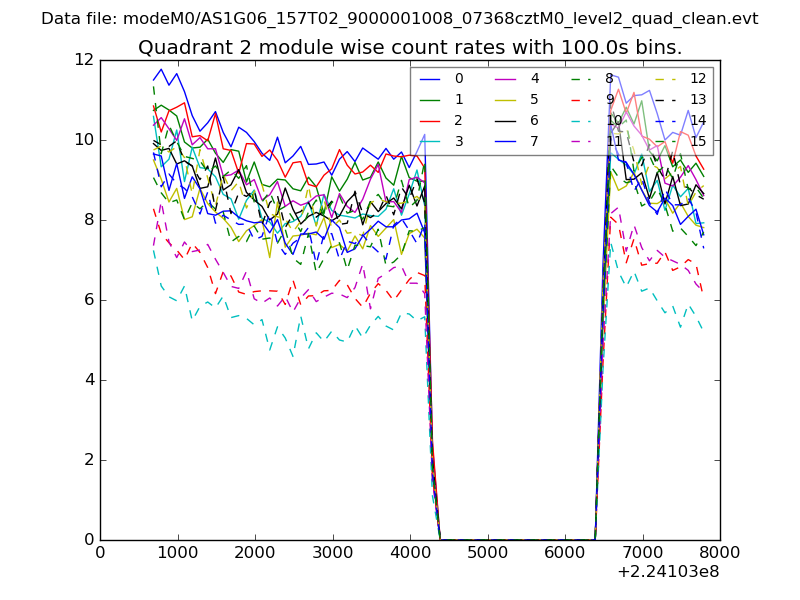
| Module-wise count rates for Quadrant B Data is divided into 100 sec bins |
 |
 |
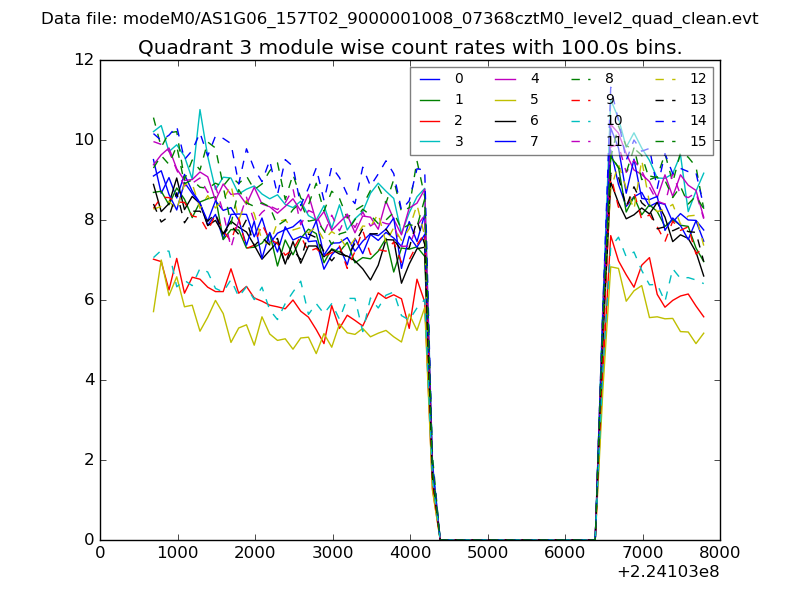
| Module-wise count rates for Quadrant C Data is divided into 100 sec bins |
 |
 |
| Module-wise count rates for Quadrant D Data is divided into 100 sec bins |
 |
 |
| Parameter | Plot |
|---|---|
| CZT HV Monitor | 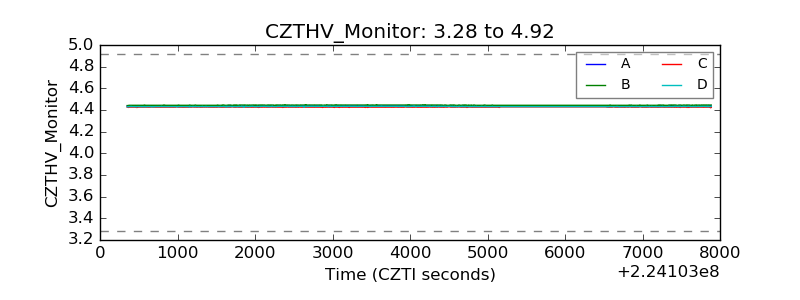 |
| D_VDD |  |
| Temperature 1 | 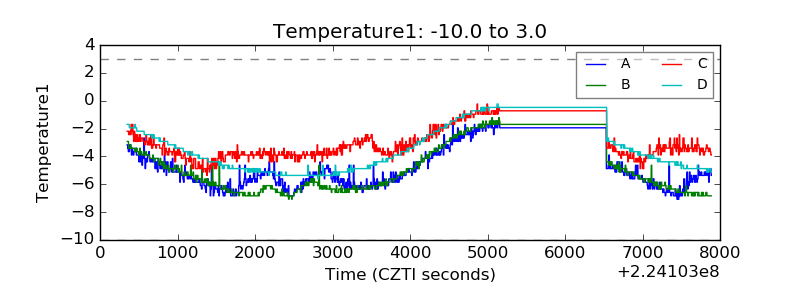 |
| Veto HV Monitor |  |
| Veto LLD | 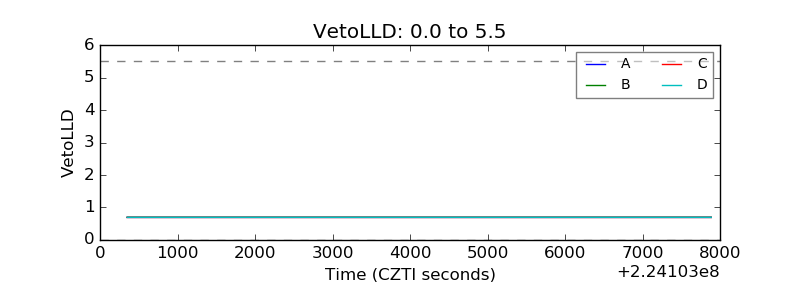 |
| Alpha Counter | 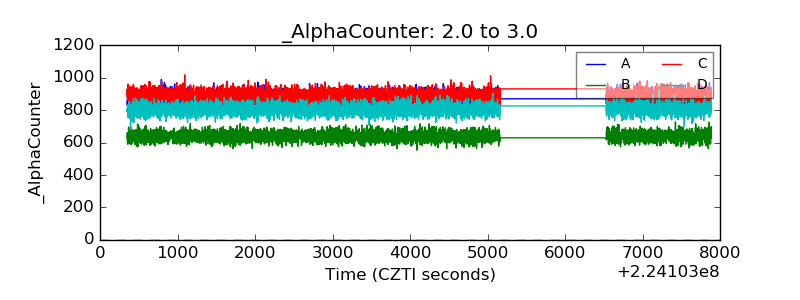 |
| _CPM_Rate | 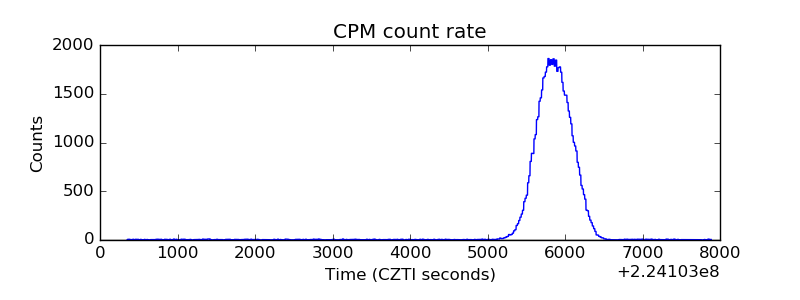 |
| CZT Counter |  |
| +2.5 Volts monitor |  |
| +5 Volts monitor |  |
| _ROLL_ROT | 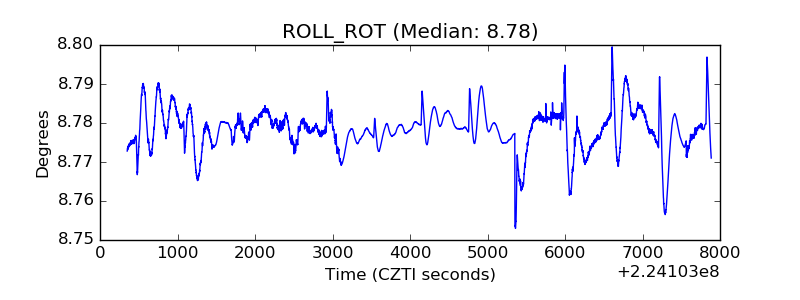 |
| _Roll_DEC | 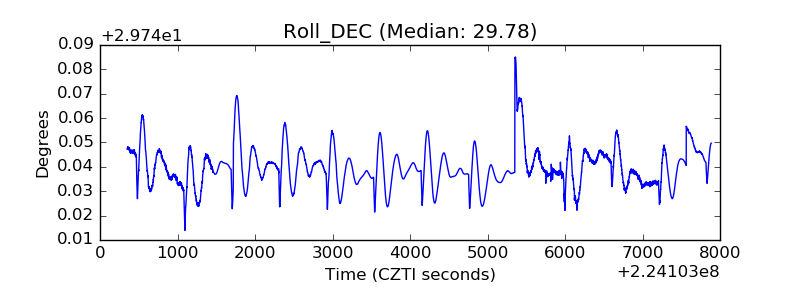 |
| _Roll_RA |  |
| Veto Counter | 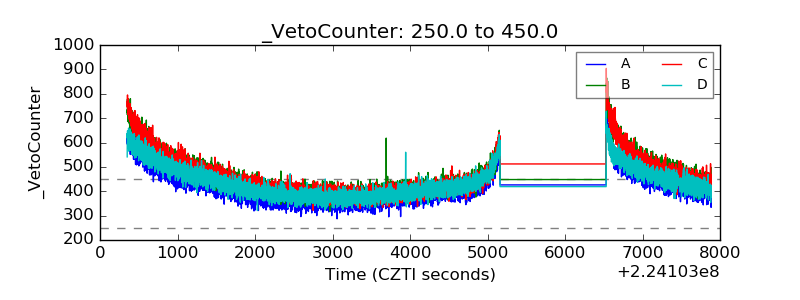 |