| Param | Original file | Final file |
|---|---|---|
| Filename | modeM0/AS1G06_151T02_9000001010cztM0_level2.fits | modeM0/AS1G06_151T02_9000001010cztM0_level2_quad_clean.evt |
| Size (bytes) | 234,613,440 | 229,610,880 |
| Size | 223.7 MB | 219.0 MB |
| Events in quadrant A | 1,347,882 | 1,314,342 |
| Events in quadrant B | 1,373,564 | 1,353,824 |
| Events in quadrant C | 1,405,980 | 1,311,611 |
| Events in quadrant D | 1,199,284 | 1,196,088 |
| Mode M9 | |||
|---|---|---|---|
| Quadrant | BADHDUFLAG | Total packets | Discarded packets |
| A | 0 | 36 | 0 |
| B | 0 | 36 | 0 |
| C | 0 | 36 | 0 |
| D | 0 | 36 | 0 |
| Mode M0 | |||
|---|---|---|---|
| Quadrant | BADHDUFLAG | Total packets | Discarded packets |
| A | 0 | 67829 | 0 |
| B | 0 | 54459 | 0 |
| C | 0 | 54014 | 0 |
| D | 0 | 60238 | 0 |
| Mode SS | |||
|---|---|---|---|
| Quadrant | BADHDUFLAG | Total packets | Discarded packets |
| A | 0 | 536 | 0 |
| B | 0 | 534 | 0 |
| C | 0 | 526 | 0 |
| D | 0 | 524 | 0 |
| Quadrant | Total seconds | Saturated seconds | Saturation percentage |
|---|---|---|---|
| A | 25845 | 1656 | 6.407429% |
| B | 25790 | 352 | 1.364870% |
| C | 25872 | 236 | 0.912183% |
| D | 25798 | 532 | 2.062175% |
Noise dominated data is calculated using 1-second bins in cleaned event files. If a bin has >2000 counts, and if more than 50% of those come from <1% of pixels, then it is considered to be noise-dominated and hence unusable.
| Quadrant | # 1 sec bins | Bins with >0 counts | Bins with >2000 counts | High rate bins dominated by noise | Noise dominated (total time) | Noise dominated (detector-on time) | Marked lightcurve |
|---|---|---|---|---|---|---|---|
| A | 38879 | 26233 | 0 | 0 | 0.00% | 0.00% | 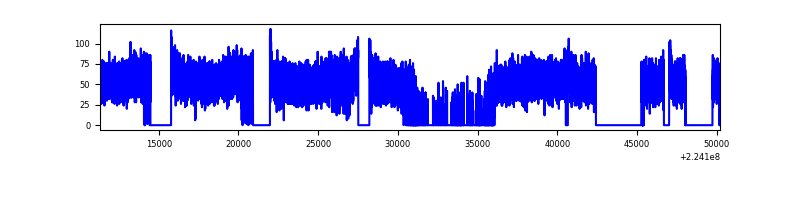 |
| B | 38885 | 26180 | 0 | 0 | 0.00% | 0.00% | 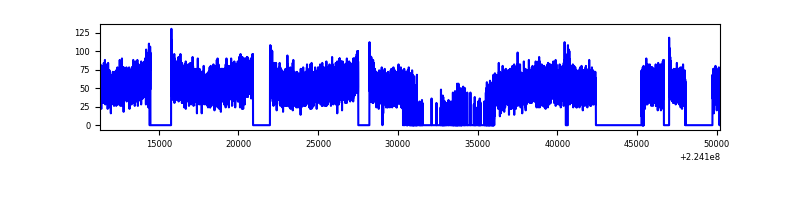 |
| C | 38882 | 26309 | 0 | 0 | 0.00% | 0.00% | 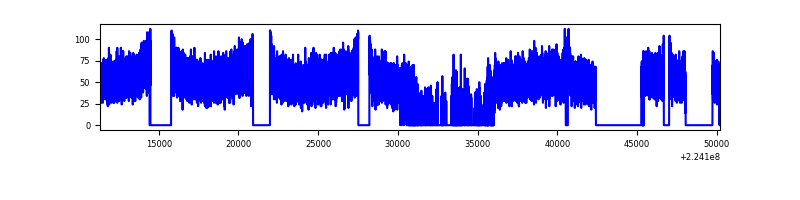 |
| D | 38886 | 26171 | 0 | 0 | 0.00% | 0.00% | 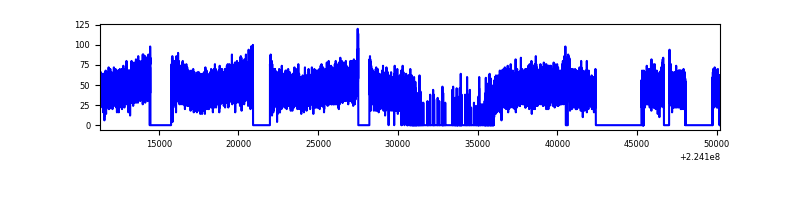 |
Top three noisy pixels from each quadrant. If the there are fewer than three noisy pixels in the level2.evt file, extra rows are filled as -1
| Pixel properties | Quadrant properties | ||||||
|---|---|---|---|---|---|---|---|
| Quadrant | DetID | PixID | Counts | Sigma | Mean | Median | Sigma |
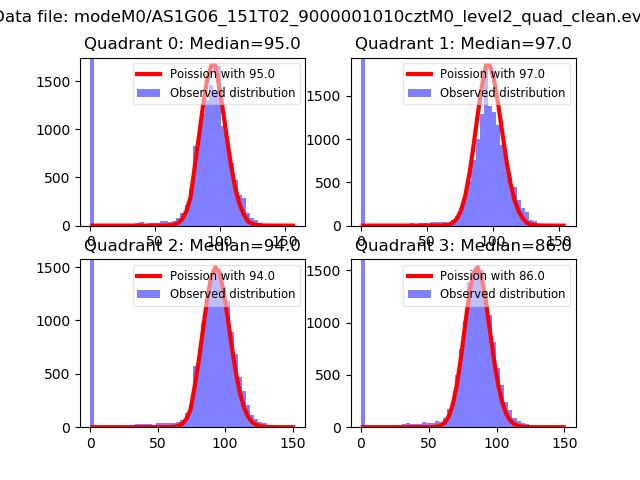
| A | 0 | 29 | 1326 | 10.91 | 350 | 326 | 91.6 |
| A | 7 | 110 | 1124 | 8.71 | 350 | 326 | 91.6 |
| A | 0 | 30 | 1009 | 7.45 | 350 | 326 | 91.6 |
| B | 2 | 9 | 1179 | 11.14 | 361 | 343 | 75.0 |
| B | 5 | 128 | 954 | 8.14 | 361 | 343 | 75.0 |
| B | 14 | 254 | 949 | 8.08 | 361 | 343 | 75.0 |
| C | 1 | 80 | 1069 | 7.21 | 371 | 343 | 100.7 |
| C | 1 | 81 | 1027 | 6.79 | 371 | 343 | 100.7 |
| C | 12 | 241 | 983 | 6.35 | 371 | 343 | 100.7 |
| D | 15 | 47 | 909 | 6.36 | 341 | 310 | 94.2 |
| D | 3 | 14 | 908 | 6.35 | 341 | 310 | 94.2 |
| D | 6 | 231 | 908 | 6.35 | 341 | 310 | 94.2 |
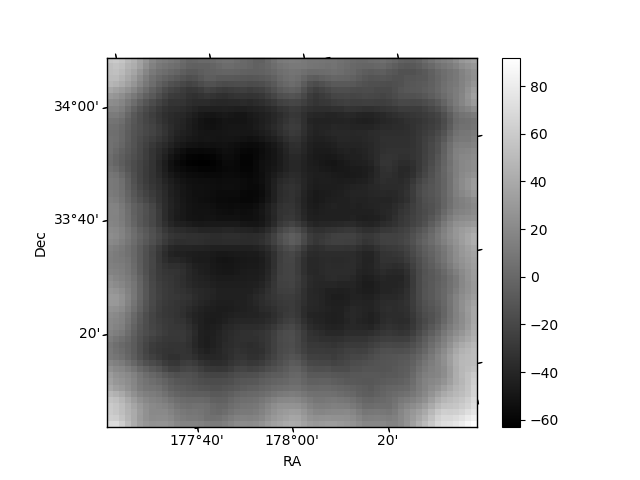
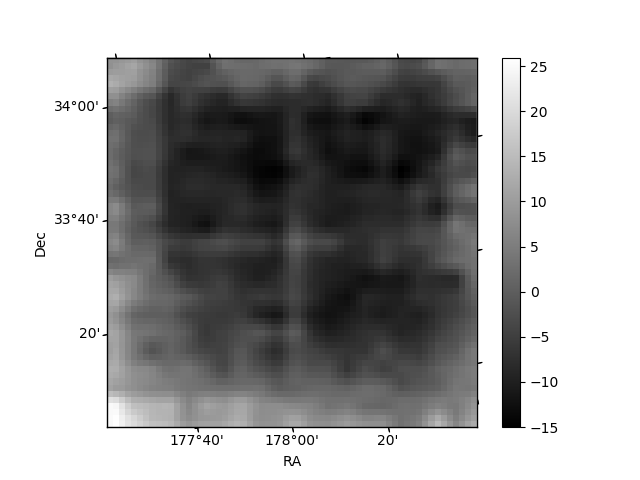
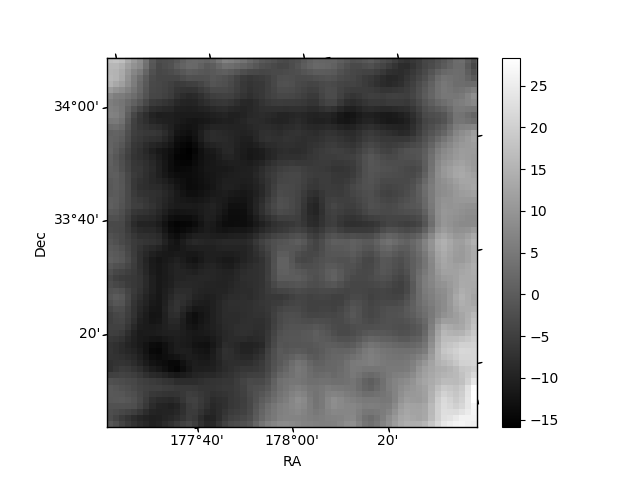
Histogram calculated using DETX and DETY for each event in the final _common_clean file
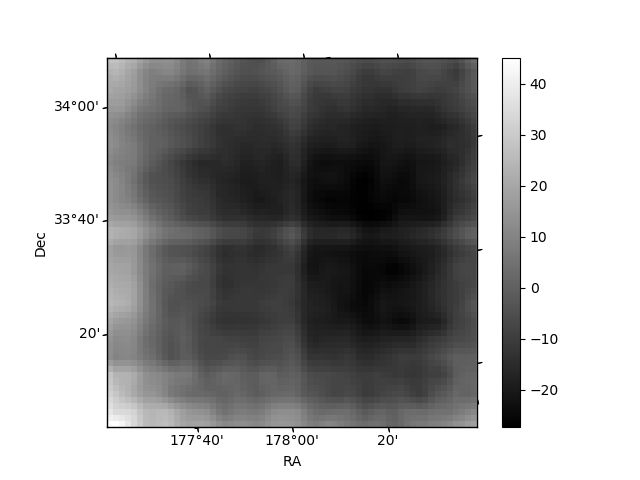
| Quadrant A | 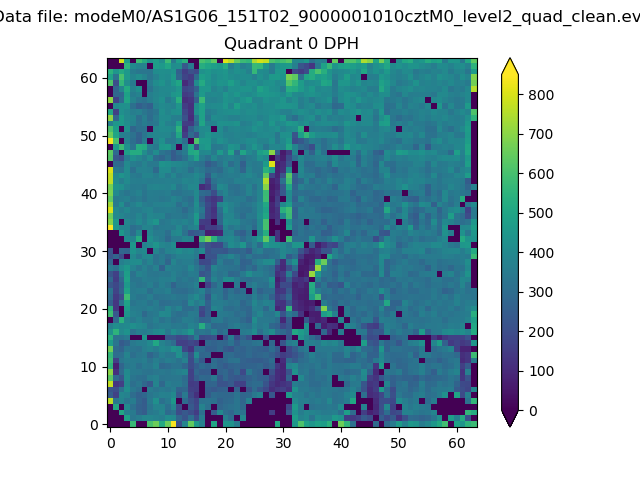 |
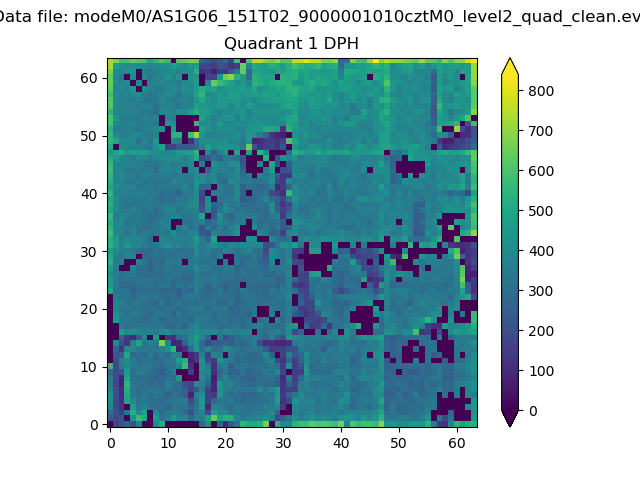 |
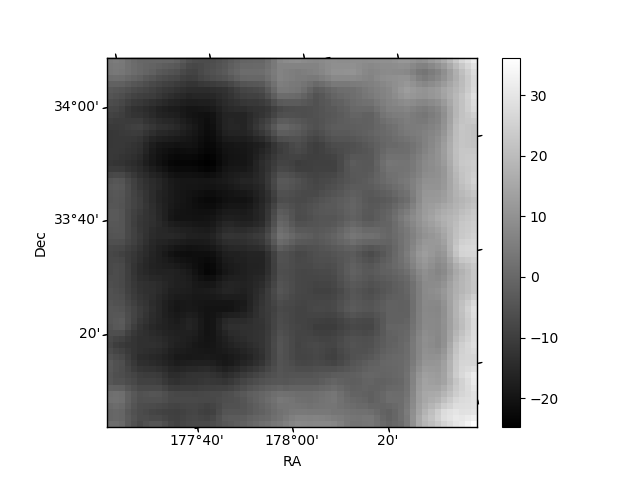
Quadrant B |
|---|---|---|---|
| Quadrant D | 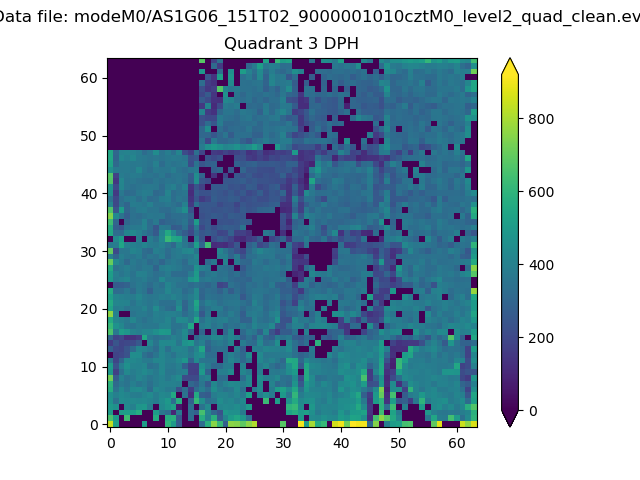 |
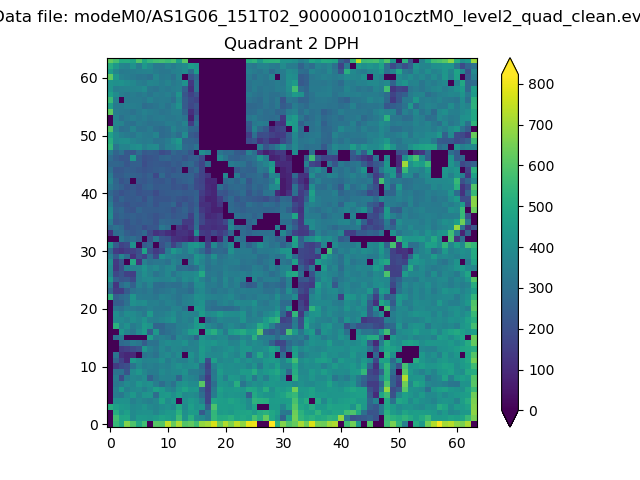 |
Quadrant C |
| Plot type | Count rate plots | Images |
|---|---|---|
| Comparison with Poisson distribution Blue bars denote a histogram of data divided into 1 sec bins. Red curve is a Poisson curve with rate = median count rate of data. |
 |
 |
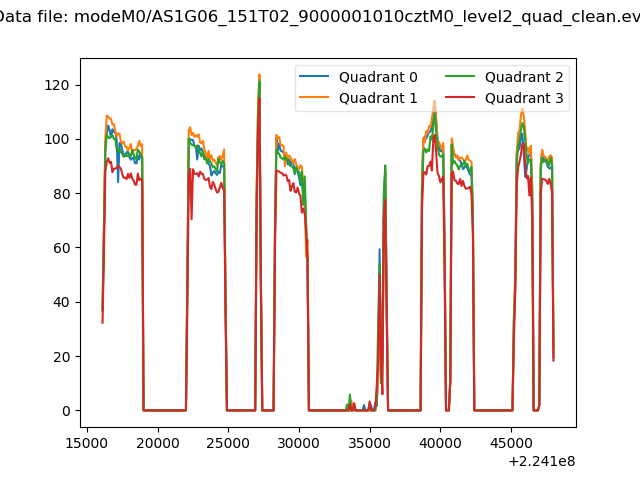
| Quadrant-wise count rates Data is divided into 100 sec bins |
 |
|
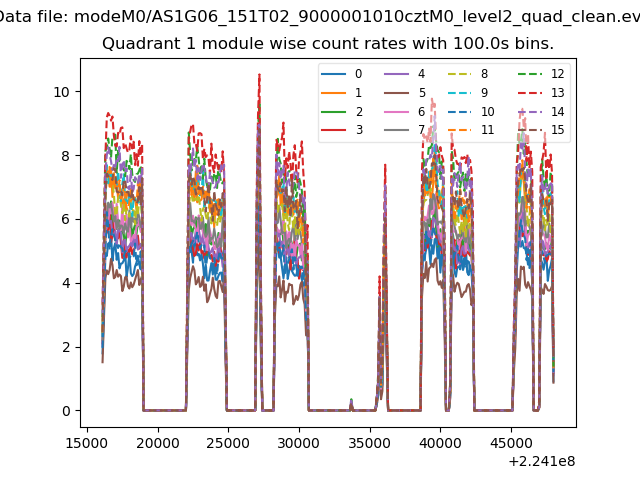
| Module-wise count rates for Quadrant A Data is divided into 100 sec bins |
 |
 |
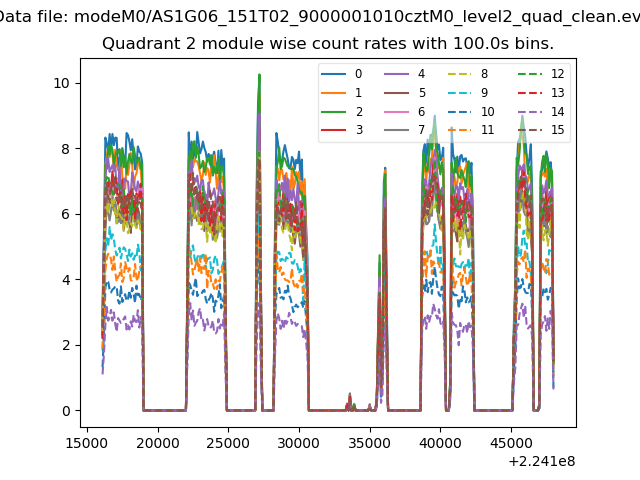
| Module-wise count rates for Quadrant B Data is divided into 100 sec bins |
 |
 |
| Module-wise count rates for Quadrant C Data is divided into 100 sec bins |
 |
 |
| Module-wise count rates for Quadrant D Data is divided into 100 sec bins |
 |
 |
| Parameter | Plot |
|---|---|
| CZT HV Monitor | 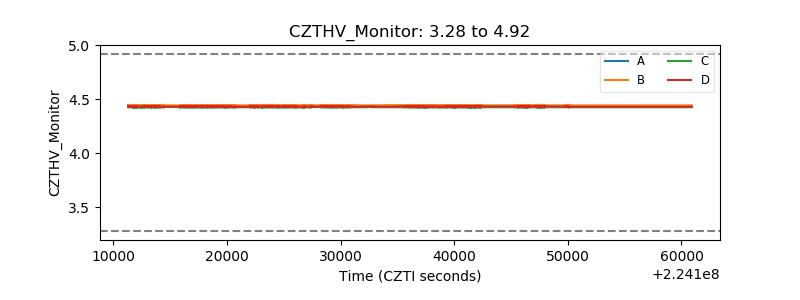 |
| D_VDD | 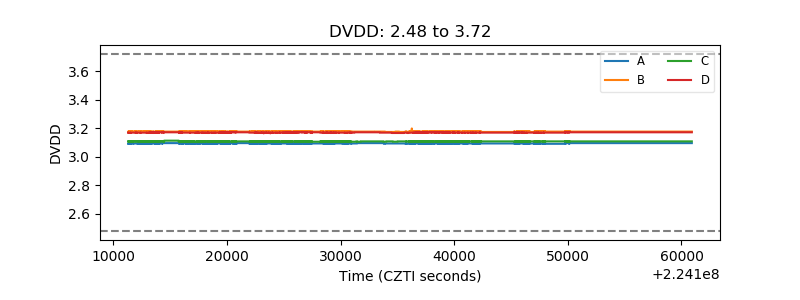 |
| Temperature 1 | 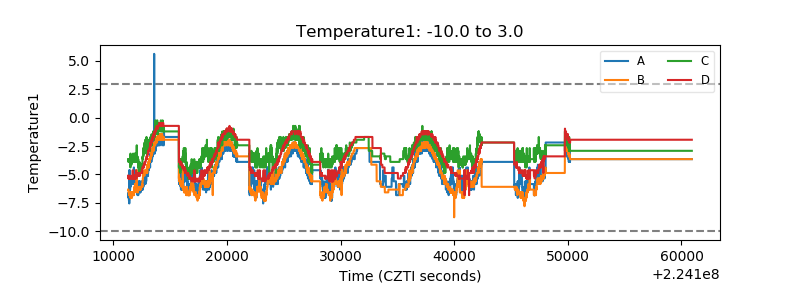 |
| Veto HV Monitor |  |
| Veto LLD | 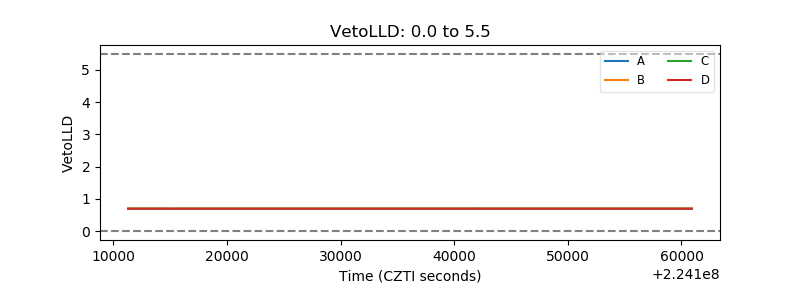 |
| Alpha Counter | 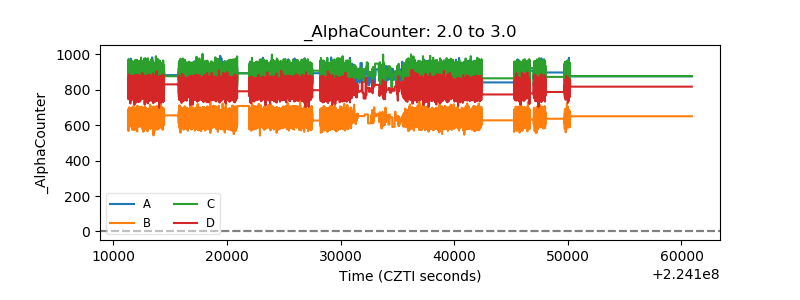 |
| _CPM_Rate | 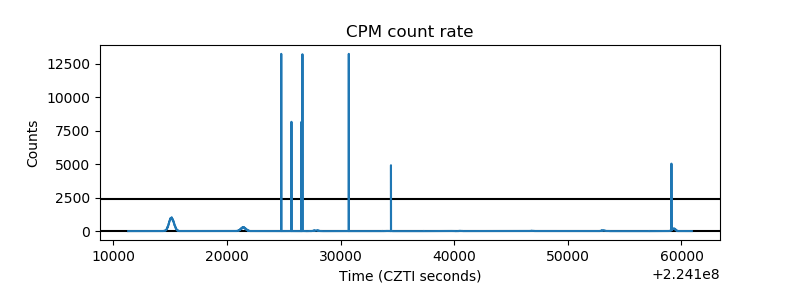 |
| CZT Counter | 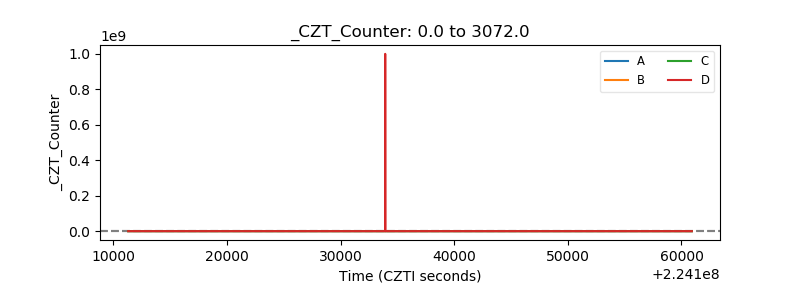 |
| +2.5 Volts monitor | 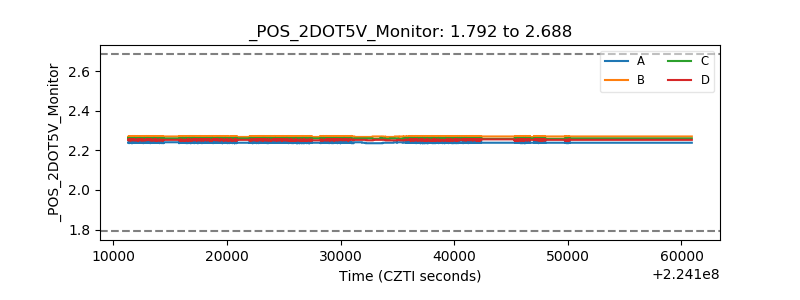 |
| +5 Volts monitor | 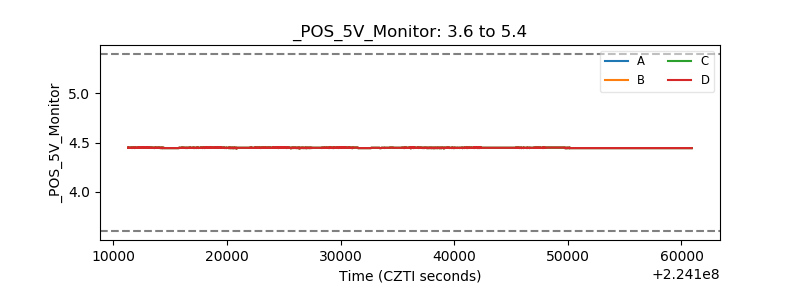 |
| _ROLL_ROT | 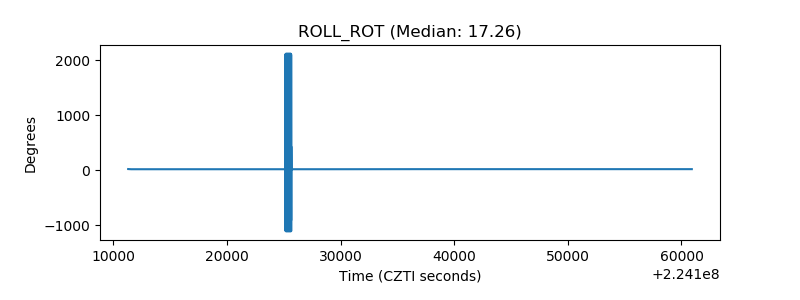 |
| _Roll_DEC | 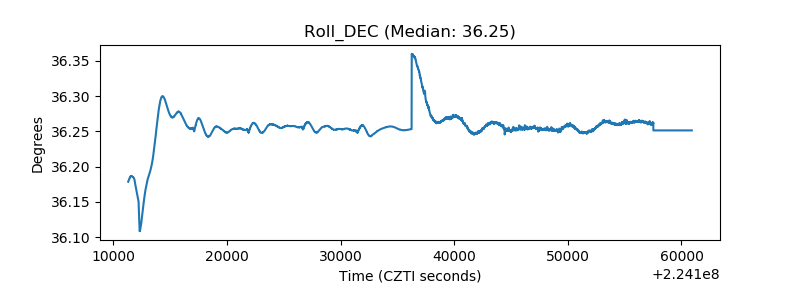 |
| _Roll_RA | 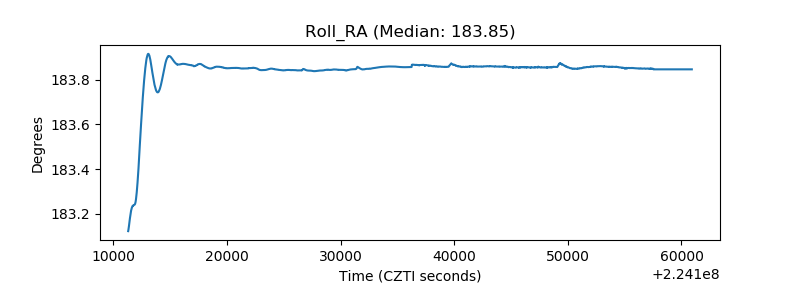 |
| Veto Counter | 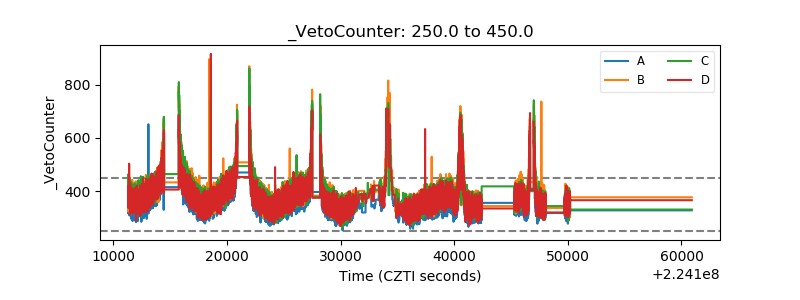 |