| Param | Original file | Final file |
|---|---|---|
| Filename | modeM0/AS1G06_151T02_9000001010_07368cztM0_level2.evt | modeM0/AS1G06_151T02_9000001010_07368cztM0_level2_quad_clean.evt |
| Size (bytes) | 329,097,600 | 61,649,280 |
| Size | 313.9 MB | 58.8 MB |
| Events in quadrant A | 2,711,546 | 385,400 |
| Events in quadrant B | 2,121,002 | 402,394 |
| Events in quadrant C | 2,150,618 | 397,673 |
| Events in quadrant D | 2,682,620 | 370,651 |
| Mode M9 | |||
|---|---|---|---|
| Quadrant | BADHDUFLAG | Total packets | Discarded packets |
| A | 0 | 13 | 0 |
| B | 0 | 13 | 0 |
| C | 0 | 13 | 0 |
| D | 0 | 13 | 0 |
| Mode M0 | |||
|---|---|---|---|
| Quadrant | BADHDUFLAG | Total packets | Discarded packets |
| A | 0 | 11169 | 2 |
| B | 0 | 9363 | 1 |
| C | 0 | 9401 | 1 |
| D | 0 | 10981 | 1 |
| Mode SS | |||
|---|---|---|---|
| Quadrant | BADHDUFLAG | Total packets | Discarded packets |
| A | 0 | 90 | 0 |
| B | 0 | 90 | 0 |
| C | 0 | 90 | 0 |
| D | 0 | 90 | 0 |
| Quadrant | Total seconds | Saturated seconds | Saturation percentage |
|---|---|---|---|
| A | 4414 | 299 | 6.773901% |
| B | 4414 | 33 | 0.747621% |
| C | 4414 | 26 | 0.589035% |
| D | 4414 | 128 | 2.899864% |
Noise dominated data is calculated using 1-second bins in cleaned event files. If a bin has >2000 counts, and if more than 50% of those come from <1% of pixels, then it is considered to be noise-dominated and hence unusable.
| Quadrant | # 1 sec bins | Bins with >0 counts | Bins with >2000 counts | High rate bins dominated by noise | Noise dominated (total time) | Noise dominated (detector-on time) | Marked lightcurve |
|---|---|---|---|---|---|---|---|
| A | 5739 | 4416 | 183 | 183 | 3.19% | 4.14% | 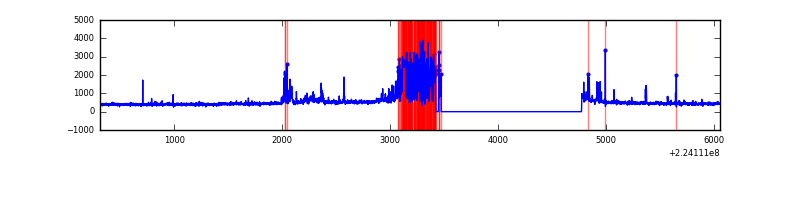 |
| B | 5739 | 4416 | 0 | 0 | 0.00% | 0.00% |  |
| C | 5739 | 4416 | 3 | 3 | 0.05% | 0.07% |  |
| D | 5739 | 4416 | 87 | 87 | 1.52% | 1.97% | 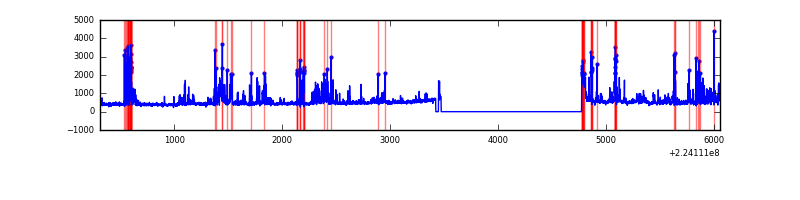 |
Top three noisy pixels from each quadrant. If the there are fewer than three noisy pixels in the level2.evt file, extra rows are filled as -1
| Pixel properties | Quadrant properties | ||||||
|---|---|---|---|---|---|---|---|
| Quadrant | DetID | PixID | Counts | Sigma | Mean | Median | Sigma |
| A | 15 | 234 | 527578 | 5165.7 | 497 | 486 | 102.0 |
| A | 14 | 111 | 249450 | 2439.94 | 497 | 486 | 102.0 |
| A | 15 | 239 | 15776 | 149.85 | 497 | 486 | 102.0 |
| B | 0 | 214 | 51582 | 502.71 | 528 | 516 | 101.6 |
| B | 10 | 246 | 13739 | 130.17 | 528 | 516 | 101.6 |
| B | 12 | 111 | 10238 | 95.71 | 528 | 516 | 101.6 |
| C | 9 | 68 | 138474 | 1165.86 | 508 | 511 | 118.3 |
| C | 1 | 16 | 21700 | 179.06 | 508 | 511 | 118.3 |
| C | 13 | 61 | 3992 | 29.42 | 508 | 511 | 118.3 |
| D | 1 | 52 | 502451 | 4052.74 | 501 | 486 | 123.9 |
| D | 14 | 34 | 147018 | 1183.06 | 501 | 486 | 123.9 |
| D | 2 | 14 | 54031 | 432.31 | 501 | 486 | 123.9 |
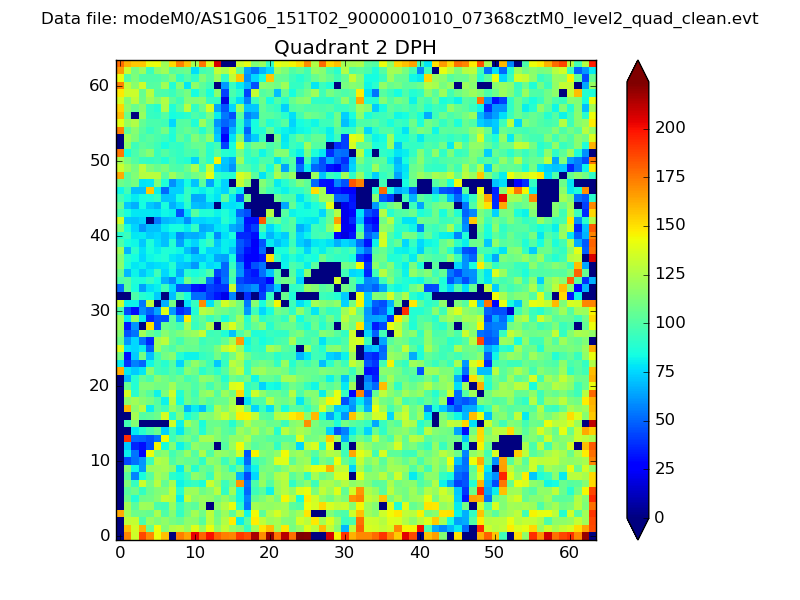
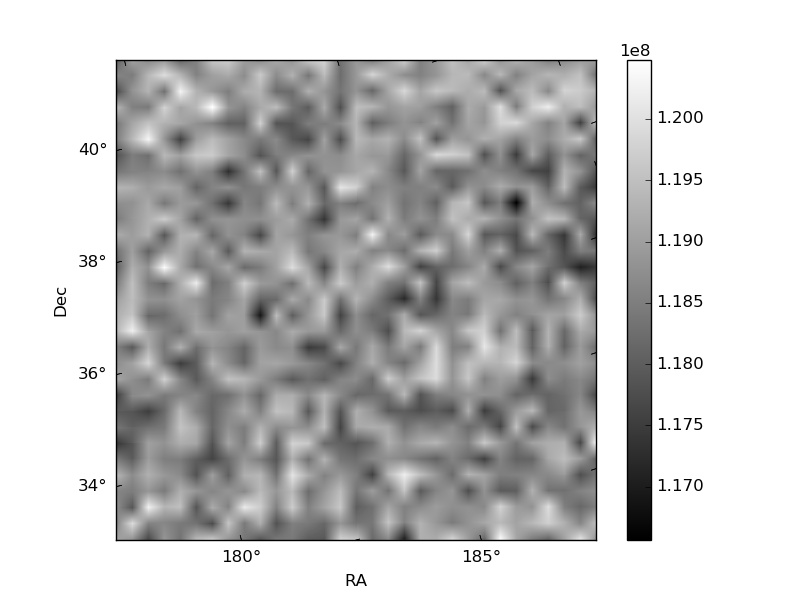
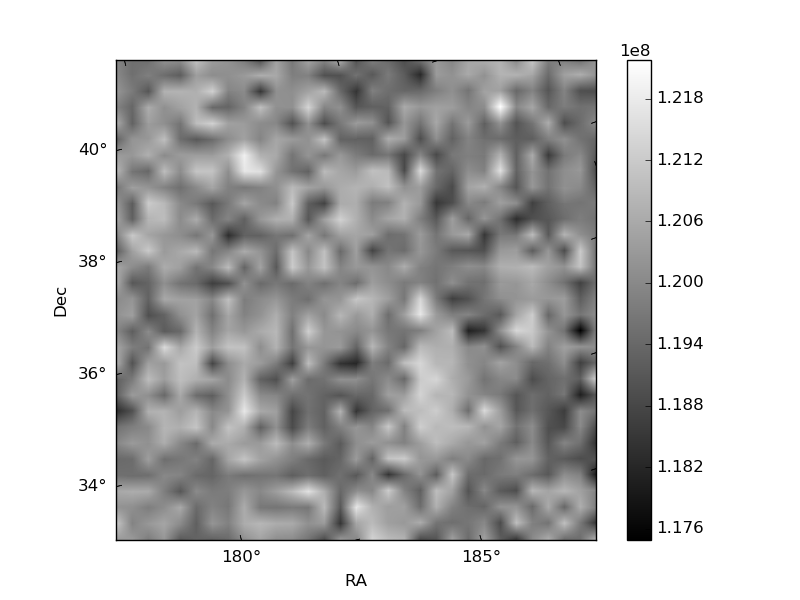
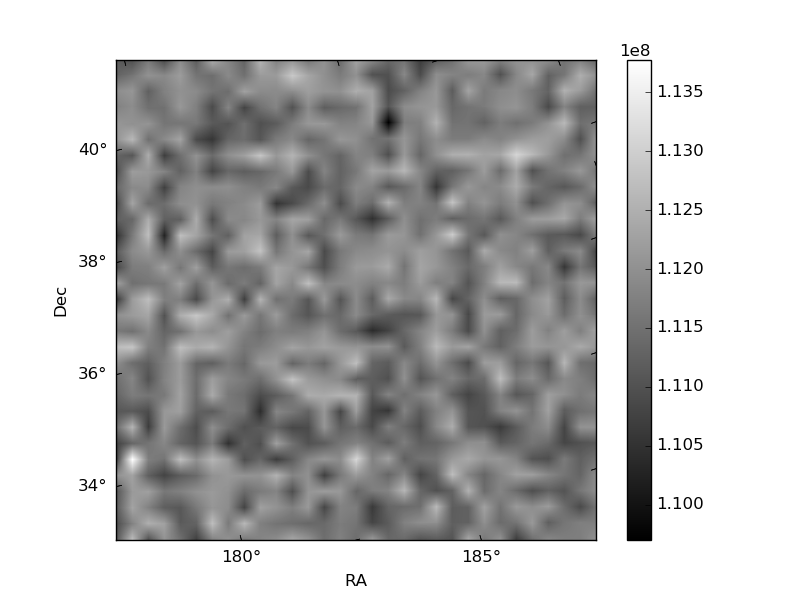
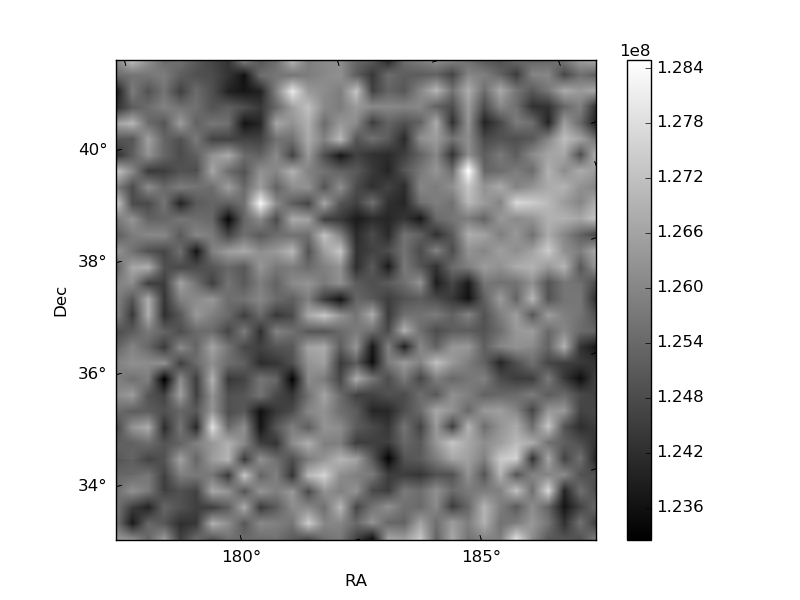
Histogram calculated using DETX and DETY for each event in the final _common_clean file
| Quadrant A | 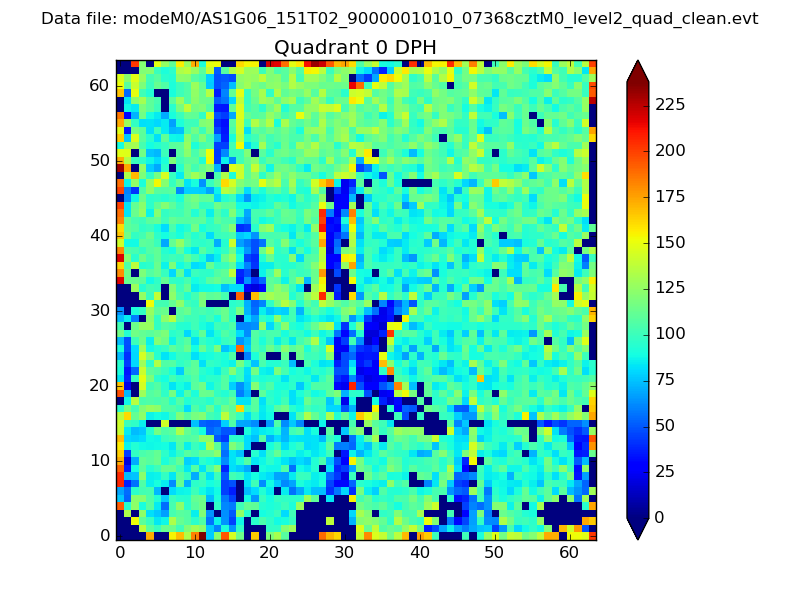 |
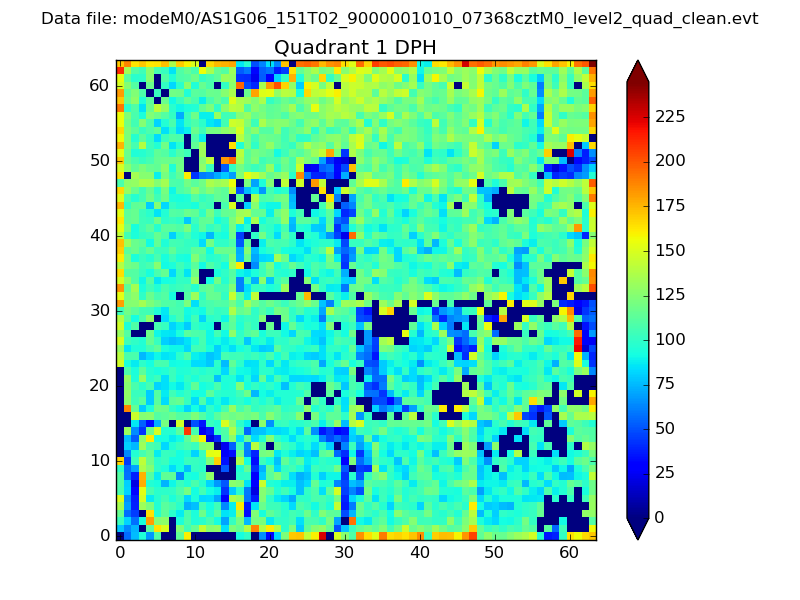 |
Quadrant B |
|---|---|---|---|
| Quadrant D | 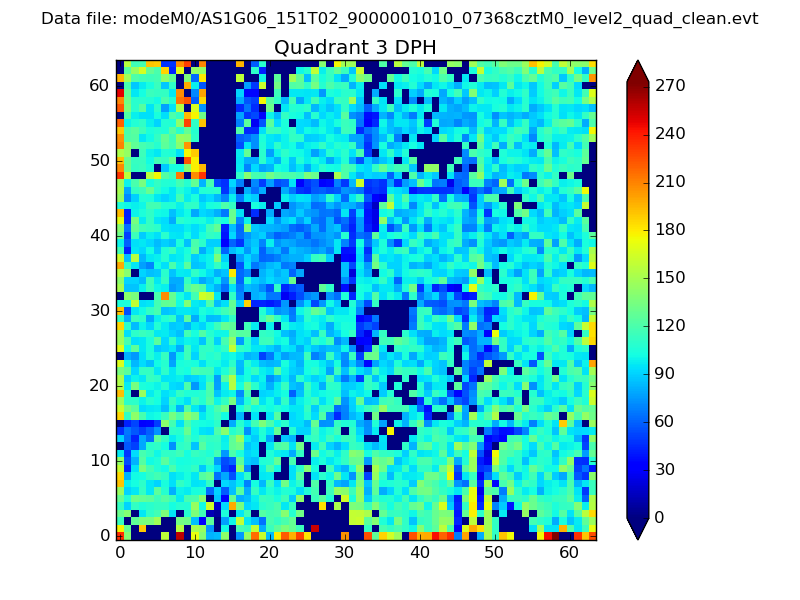 |
 |
Quadrant C |
| Plot type | Count rate plots | Images |
|---|---|---|
| Comparison with Poisson distribution Blue bars denote a histogram of data divided into 1 sec bins. Red curve is a Poisson curve with rate = median count rate of data. |
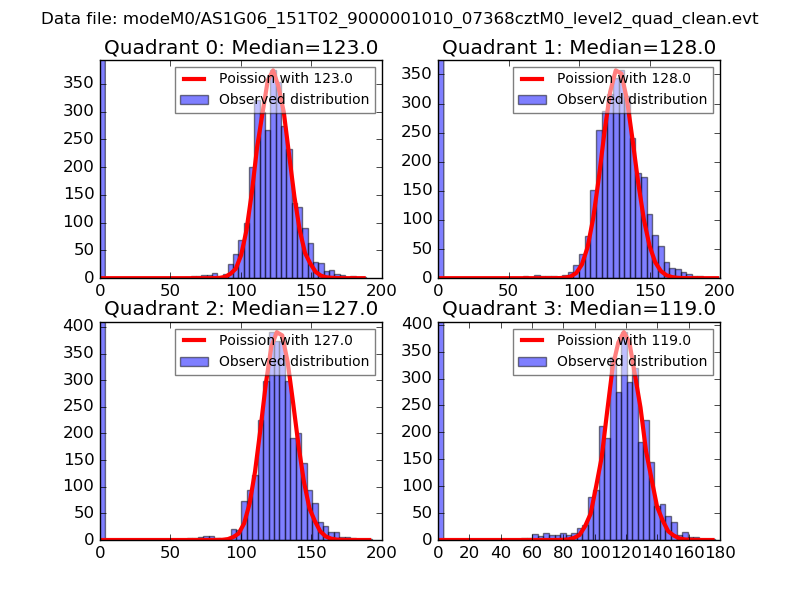 |
 |
| Quadrant-wise count rates Data is divided into 100 sec bins |
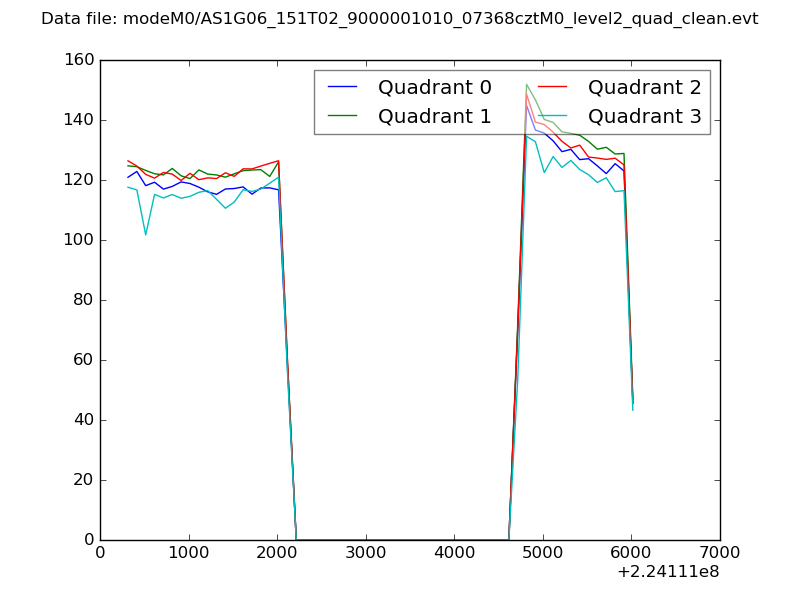 |
|
| Module-wise count rates for Quadrant A Data is divided into 100 sec bins |
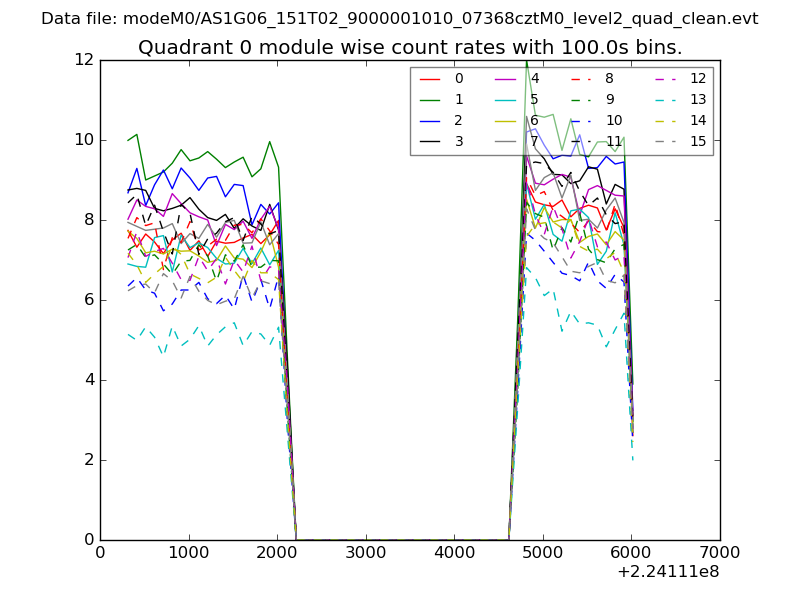 |
 |
| Module-wise count rates for Quadrant B Data is divided into 100 sec bins |
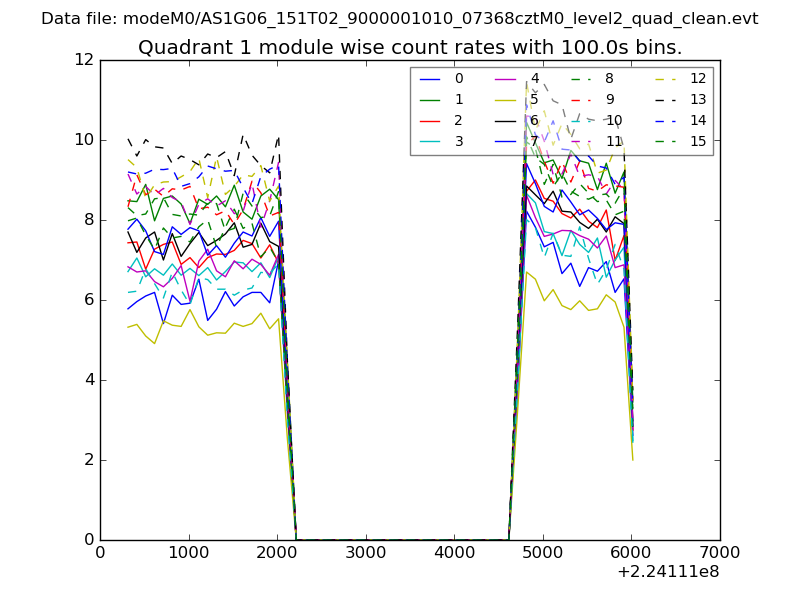 |
 |
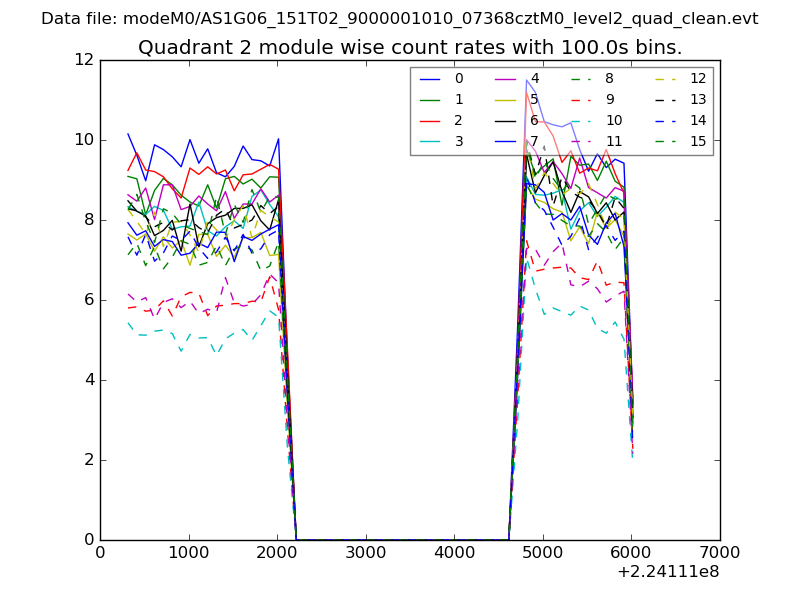
| Module-wise count rates for Quadrant C Data is divided into 100 sec bins |
 |
 |
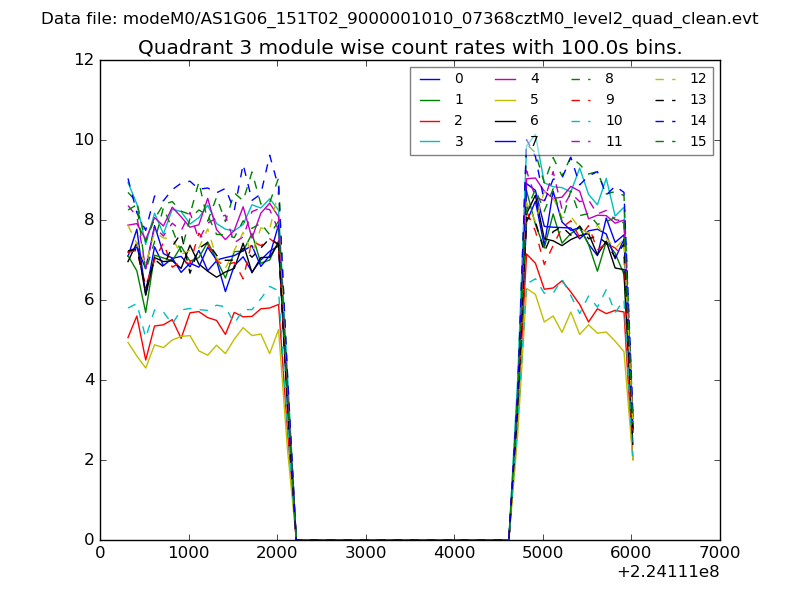
| Module-wise count rates for Quadrant D Data is divided into 100 sec bins |
 |
 |
| Parameter | Plot |
|---|---|
| CZT HV Monitor | 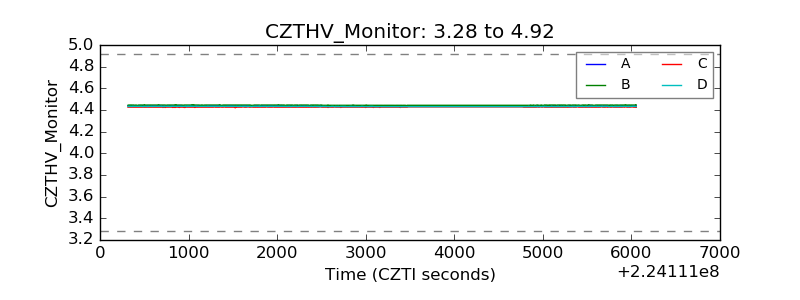 |
| D_VDD | 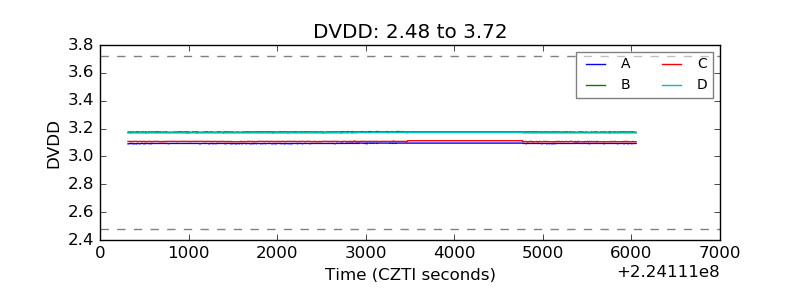 |
| Temperature 1 | 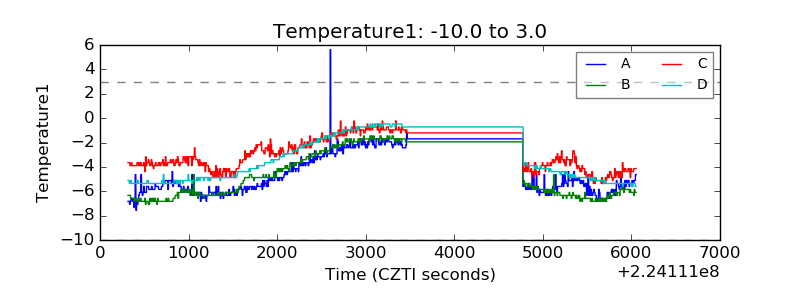 |
| Veto HV Monitor | 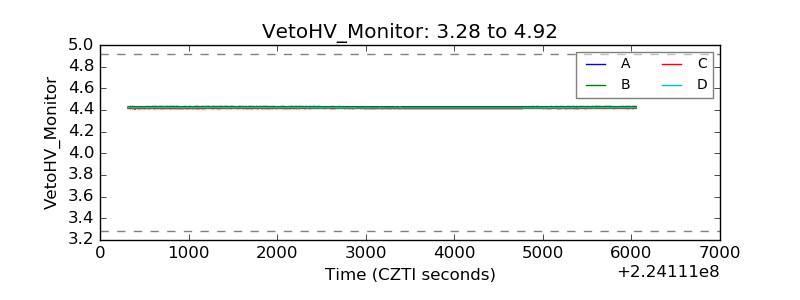 |
| Veto LLD | 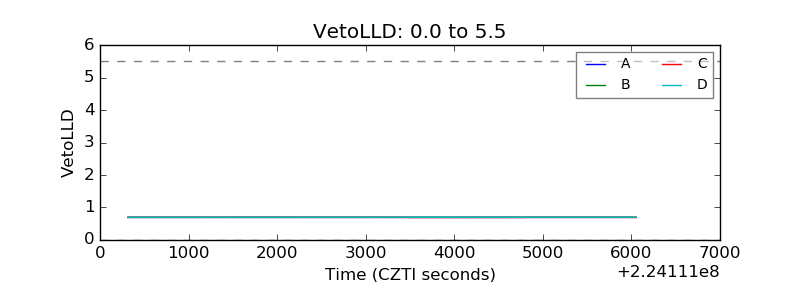 |
| Alpha Counter | 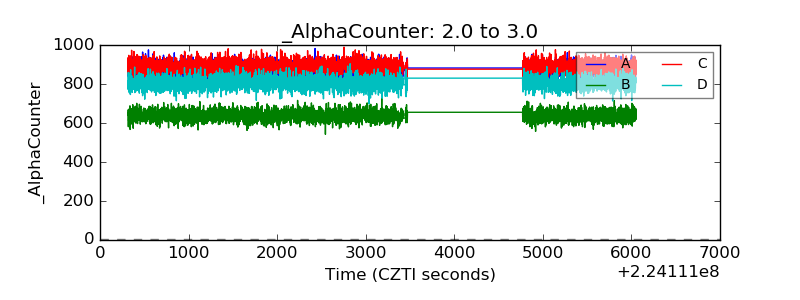 |
| _CPM_Rate | 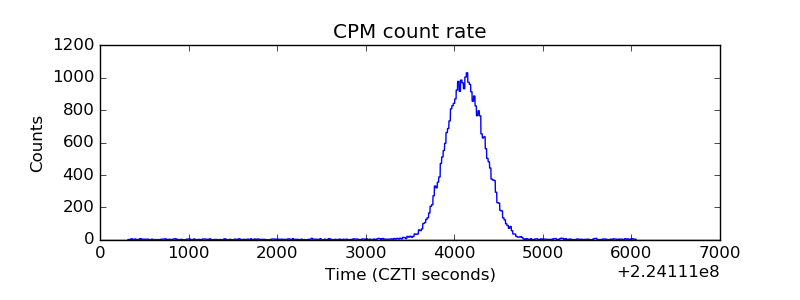 |
| CZT Counter | 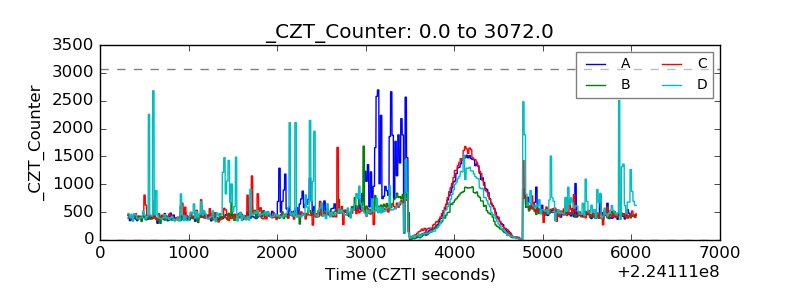 |
| +2.5 Volts monitor |  |
| +5 Volts monitor |  |
| _ROLL_ROT | 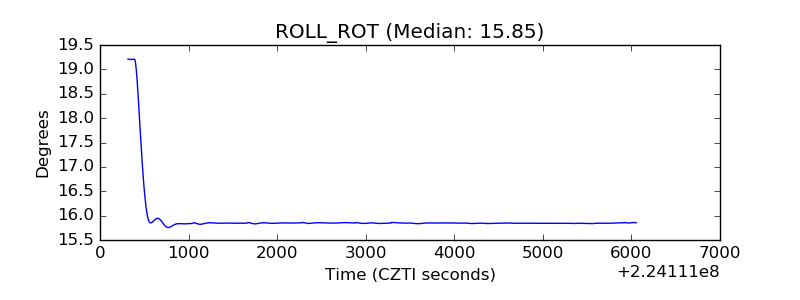 |
| _Roll_DEC | 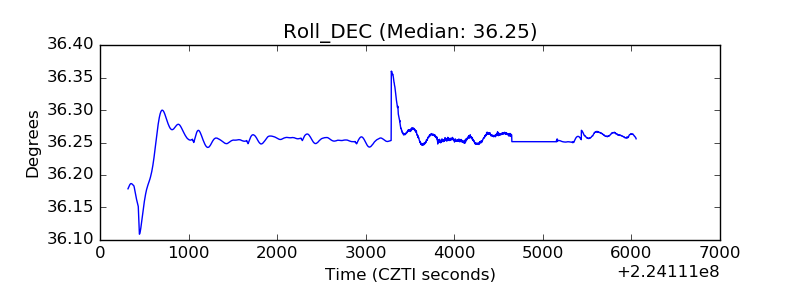 |
| _Roll_RA | 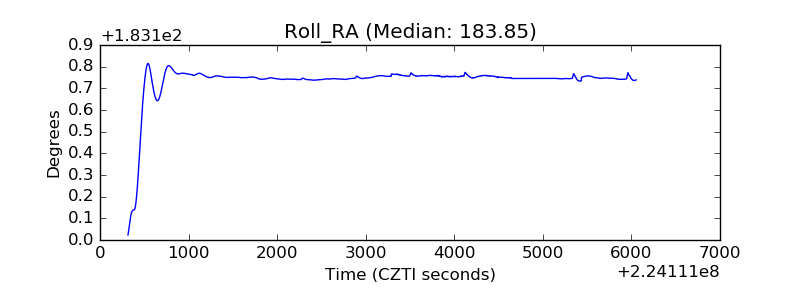 |
| Veto Counter | 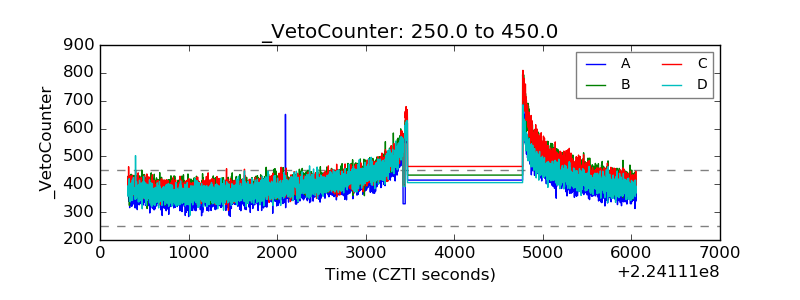 |