| Param | Original file | Final file |
|---|---|---|
| Filename | modeM0/AS1G06_151T02_9000001010_07369cztM0_level2.evt | modeM0/AS1G06_151T02_9000001010_07369cztM0_level2_quad_clean.evt |
| Size (bytes) | 539,421,120 | 88,551,360 |
| Size | 514.4 MB | 84.4 MB |
| Events in quadrant A | 4,963,891 | 546,648 |
| Events in quadrant B | 3,314,601 | 573,484 |
| Events in quadrant C | 3,280,629 | 562,850 |
| Events in quadrant D | 4,316,472 | 525,210 |
| Mode M9 | |||
|---|---|---|---|
| Quadrant | BADHDUFLAG | Total packets | Discarded packets |
| A | 0 | 23 | 0 |
| B | 0 | 23 | 0 |
| C | 0 | 23 | 0 |
| D | 0 | 23 | 0 |
| Mode M0 | |||
|---|---|---|---|
| Quadrant | BADHDUFLAG | Total packets | Discarded packets |
| A | 0 | 19461 | 3 |
| B | 0 | 14566 | 2 |
| C | 0 | 14424 | 2 |
| D | 0 | 17492 | 2 |
| Mode SS | |||
|---|---|---|---|
| Quadrant | BADHDUFLAG | Total packets | Discarded packets |
| A | 0 | 142 | 0 |
| B | 0 | 142 | 0 |
| C | 0 | 142 | 0 |
| D | 0 | 142 | 0 |
| Quadrant | Total seconds | Saturated seconds | Saturation percentage |
|---|---|---|---|
| A | 6783 | 815 | 12.015332% |
| B | 6783 | 66 | 0.973021% |
| C | 6783 | 78 | 1.149934% |
| D | 6783 | 210 | 3.095975% |
Noise dominated data is calculated using 1-second bins in cleaned event files. If a bin has >2000 counts, and if more than 50% of those come from <1% of pixels, then it is considered to be noise-dominated and hence unusable.
| Quadrant | # 1 sec bins | Bins with >0 counts | Bins with >2000 counts | High rate bins dominated by noise | Noise dominated (total time) | Noise dominated (detector-on time) | Marked lightcurve |
|---|---|---|---|---|---|---|---|
| A | 9173 | 6786 | 571 | 571 | 6.22% | 8.41% | 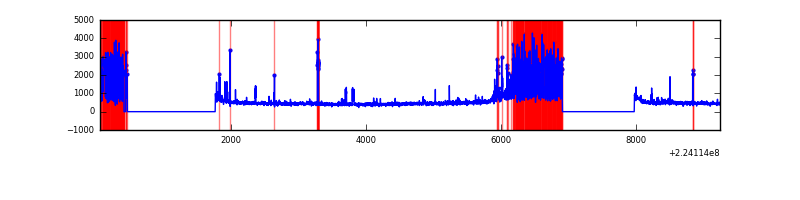 |
| B | 9173 | 6786 | 1 | 1 | 0.01% | 0.01% | 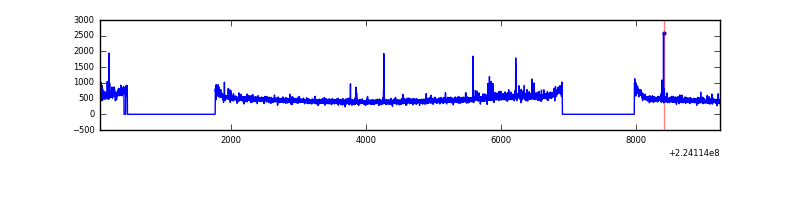 |
| C | 9173 | 6786 | 25 | 25 | 0.27% | 0.37% | 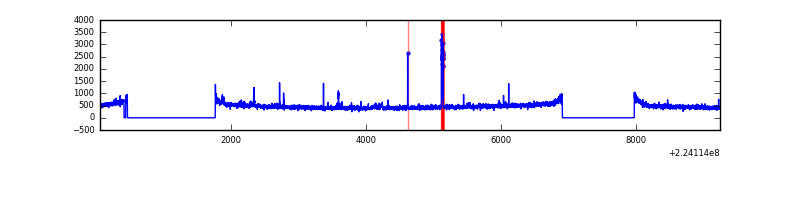 |
| D | 9173 | 6786 | 138 | 138 | 1.50% | 2.03% | 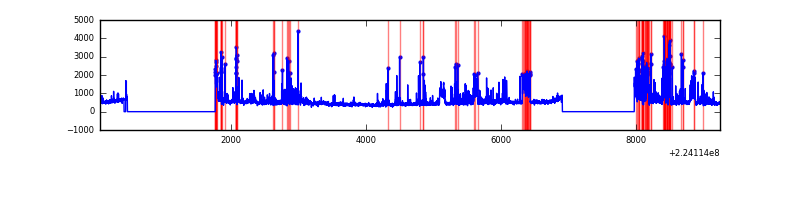 |
Top three noisy pixels from each quadrant. If the there are fewer than three noisy pixels in the level2.evt file, extra rows are filled as -1
| Pixel properties | Quadrant properties | ||||||
|---|---|---|---|---|---|---|---|
| Quadrant | DetID | PixID | Counts | Sigma | Mean | Median | Sigma |
| A | 15 | 234 | 1758843 | 11522.66 | 753 | 736 | 152.6 |
| A | 14 | 111 | 280297 | 1832.25 | 753 | 736 | 152.6 |
| A | 15 | 239 | 23086 | 146.48 | 753 | 736 | 152.6 |
| B | 0 | 214 | 82479 | 516.12 | 827 | 807 | 158.2 |
| B | 12 | 111 | 16177 | 97.13 | 827 | 807 | 158.2 |
| B | 11 | 111 | 12566 | 74.31 | 827 | 807 | 158.2 |
| C | 9 | 68 | 129602 | 692.37 | 797 | 801 | 186.0 |
| C | 1 | 16 | 22808 | 118.3 | 797 | 801 | 186.0 |
| C | 8 | 229 | 16155 | 82.53 | 797 | 801 | 186.0 |
| D | 1 | 52 | 682207 | 3536.9 | 783 | 758 | 192.7 |
| D | 1 | 20 | 296077 | 1532.78 | 783 | 758 | 192.7 |
| D | 14 | 34 | 254626 | 1317.64 | 783 | 758 | 192.7 |
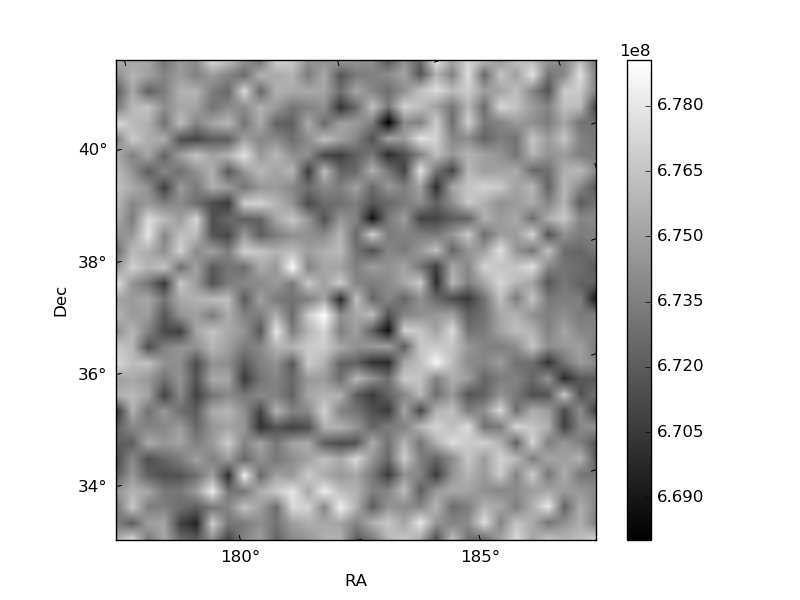
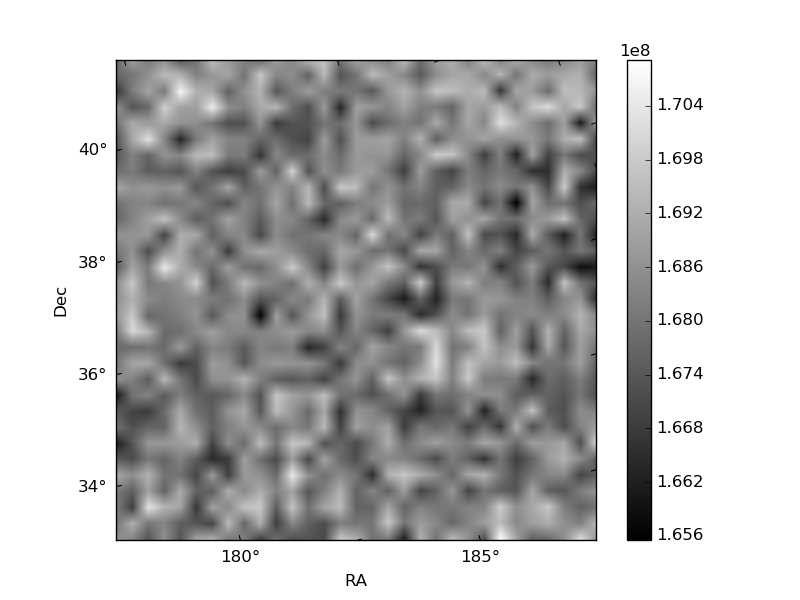
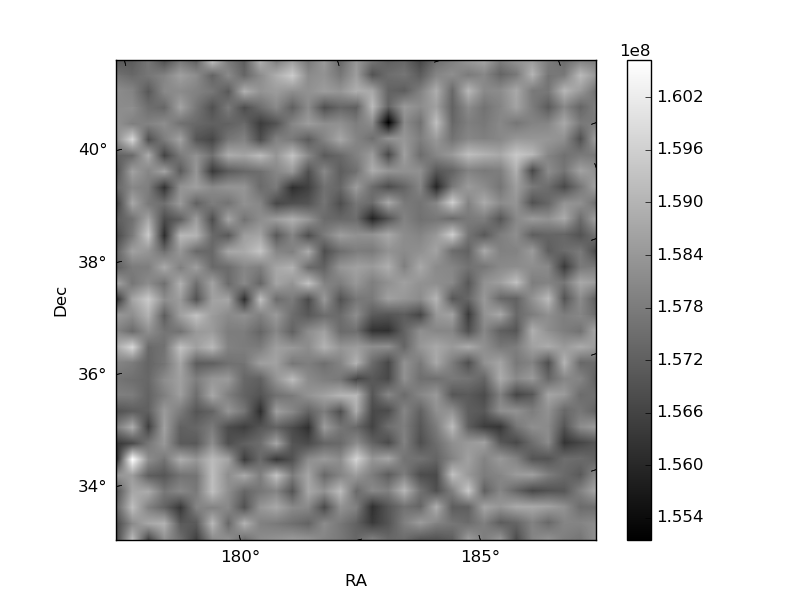
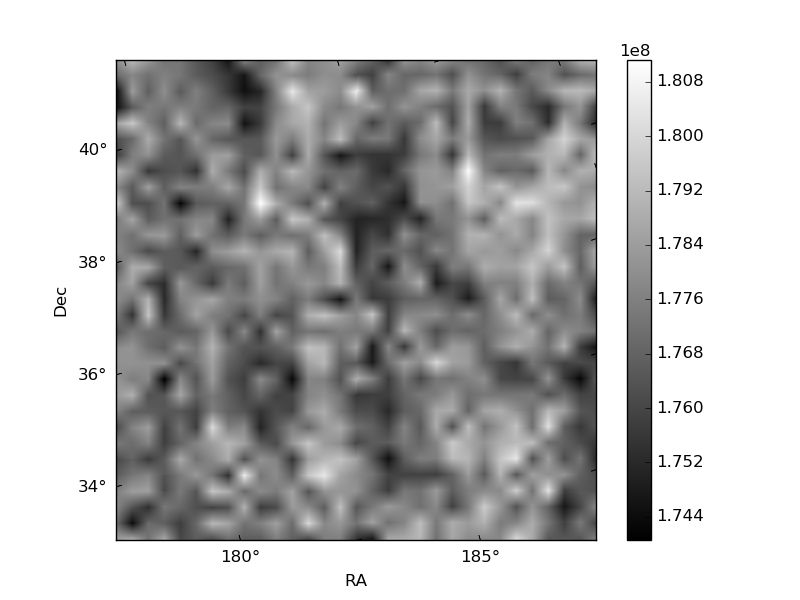
Histogram calculated using DETX and DETY for each event in the final _common_clean file
| Quadrant A | 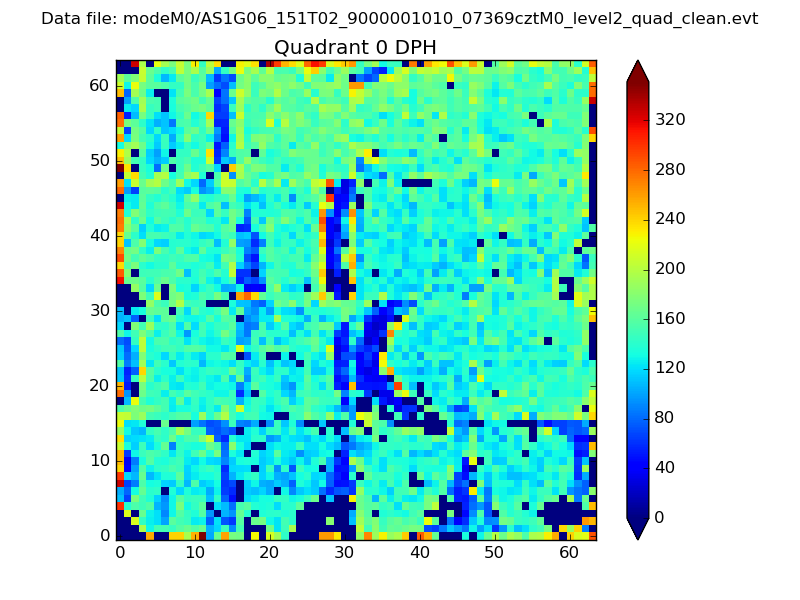 |
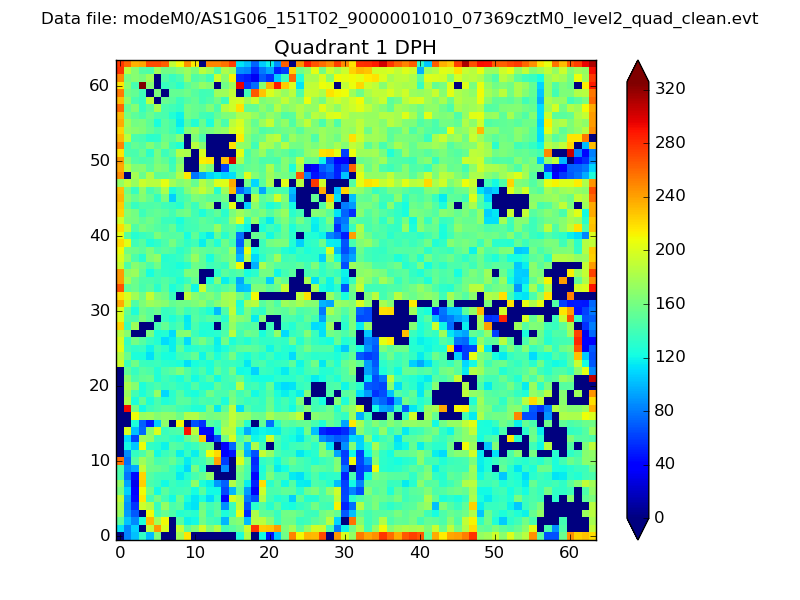 |
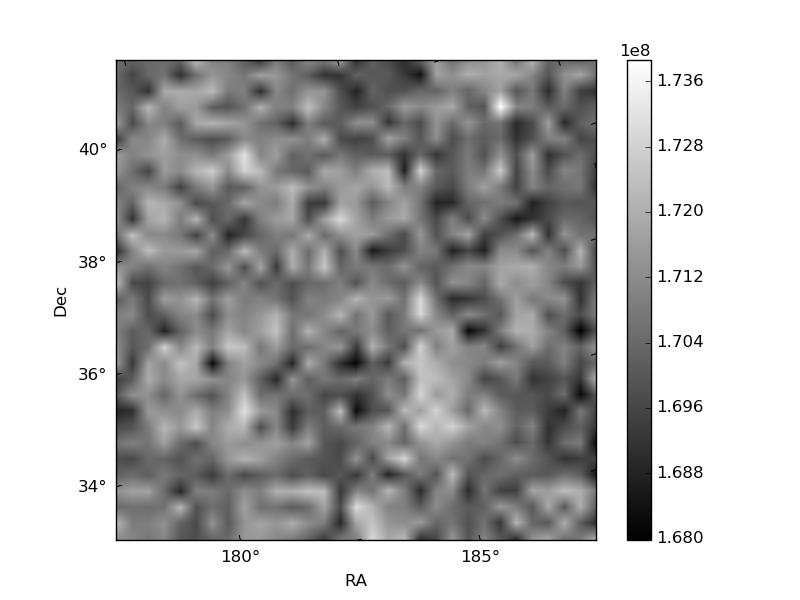
Quadrant B |
|---|---|---|---|
| Quadrant D | 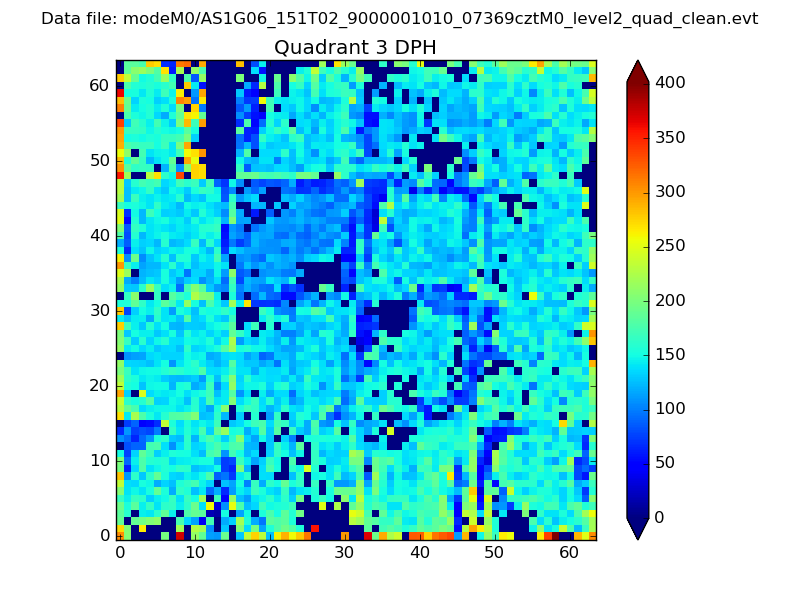 |
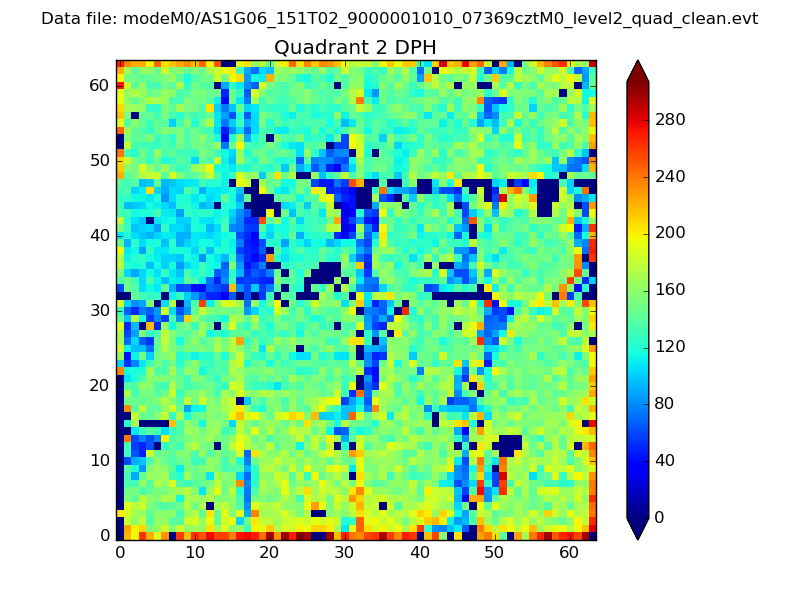 |
Quadrant C |
| Plot type | Count rate plots | Images |
|---|---|---|
| Comparison with Poisson distribution Blue bars denote a histogram of data divided into 1 sec bins. Red curve is a Poisson curve with rate = median count rate of data. |
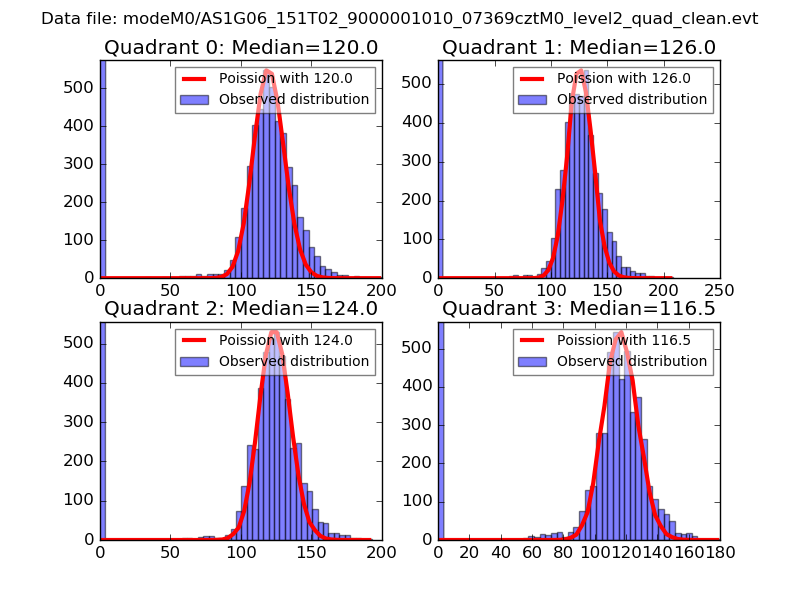 |
 |
| Quadrant-wise count rates Data is divided into 100 sec bins |
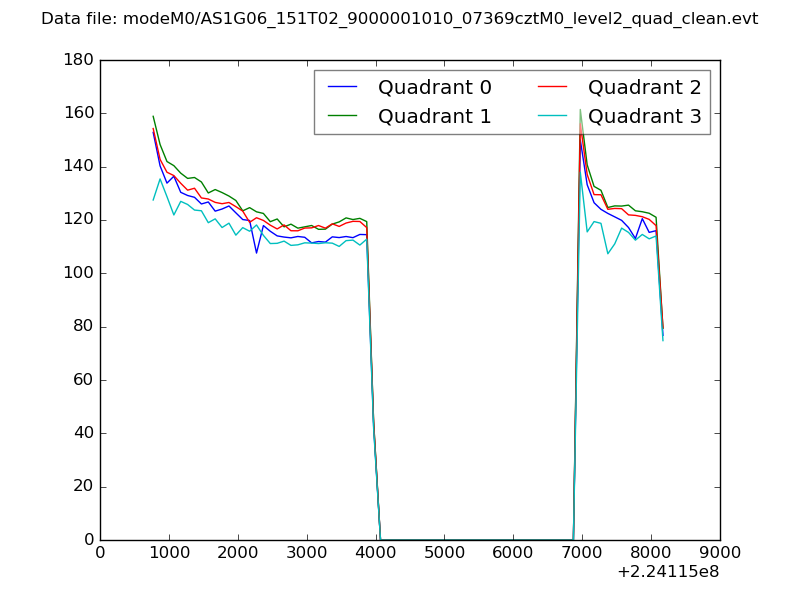 |
|
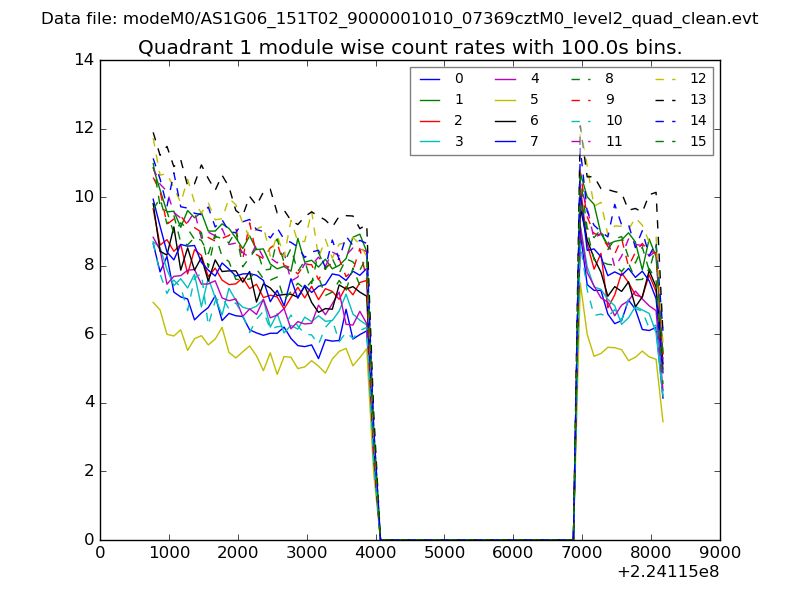
| Module-wise count rates for Quadrant A Data is divided into 100 sec bins |
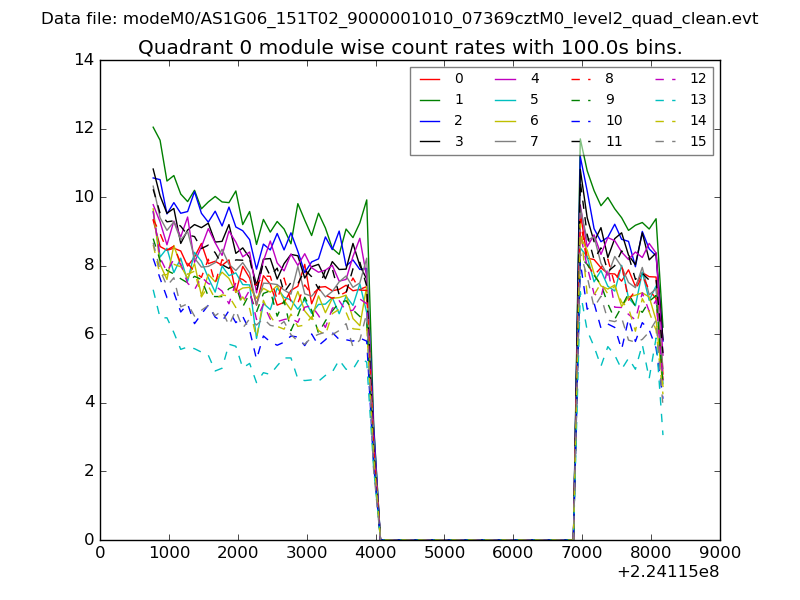 |
 |
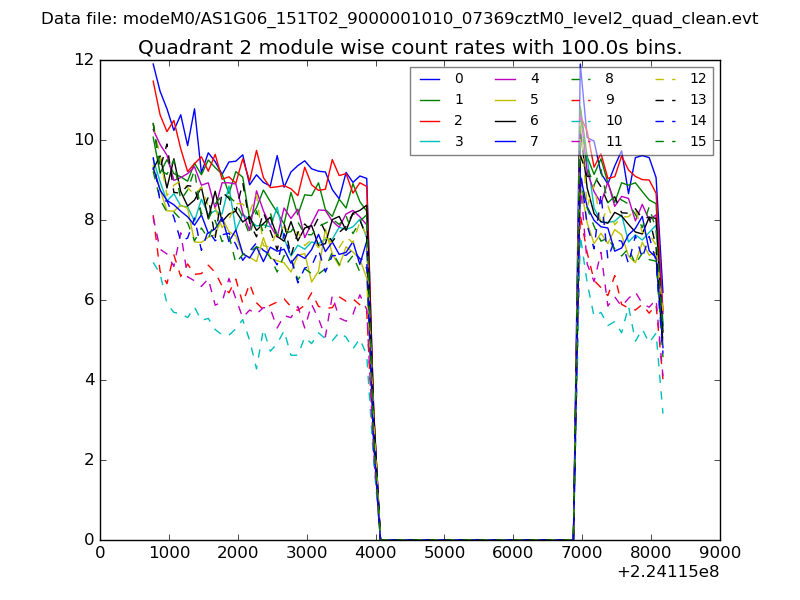
| Module-wise count rates for Quadrant B Data is divided into 100 sec bins |
 |
 |
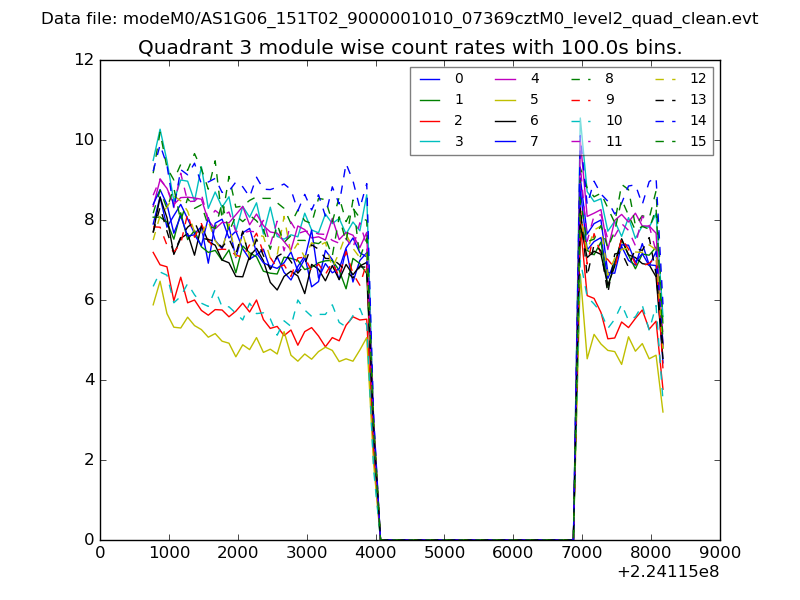
| Module-wise count rates for Quadrant C Data is divided into 100 sec bins |
 |
 |
| Module-wise count rates for Quadrant D Data is divided into 100 sec bins |
 |
 |
| Parameter | Plot |
|---|---|
| CZT HV Monitor | 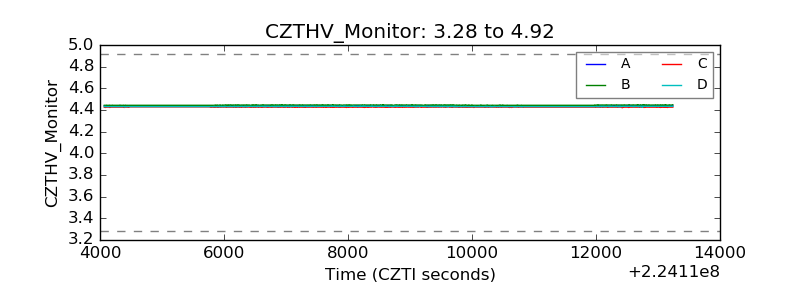 |
| D_VDD | 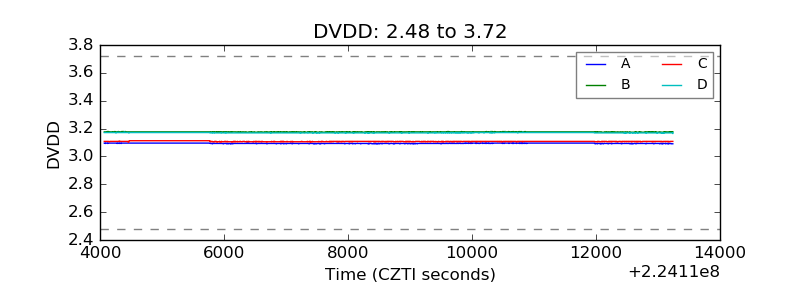 |
| Temperature 1 | 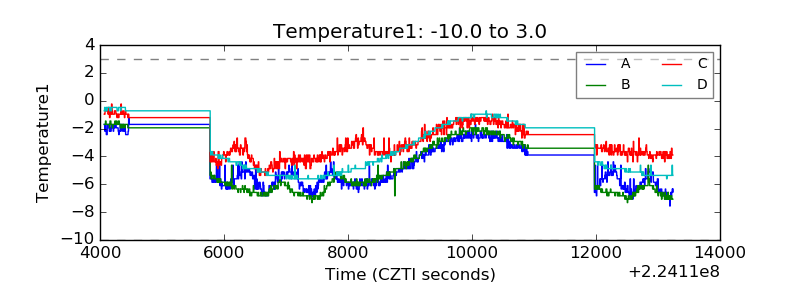 |
| Veto HV Monitor | 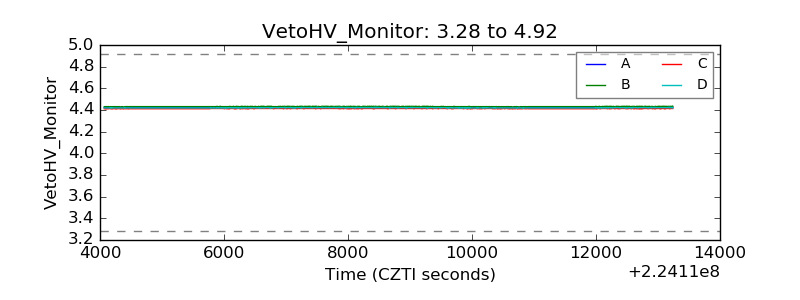 |
| Veto LLD | 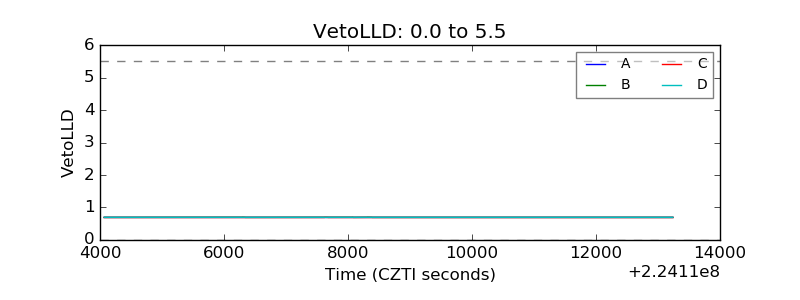 |
| Alpha Counter | 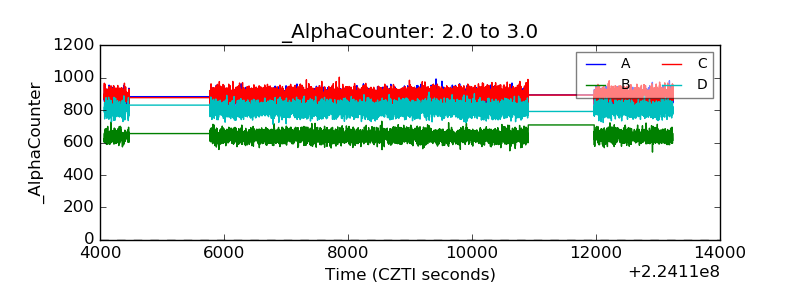 |
| _CPM_Rate | 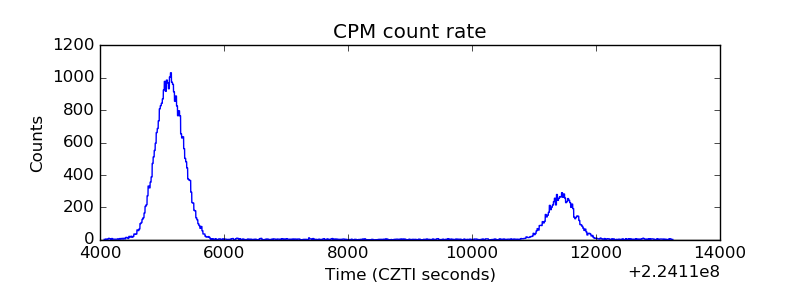 |
| CZT Counter | 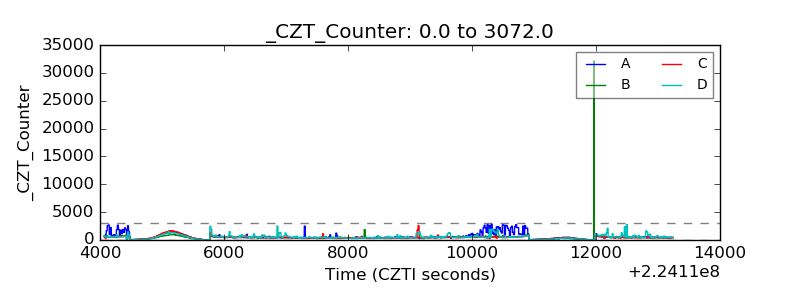 |
| +2.5 Volts monitor |  |
| +5 Volts monitor |  |
| _ROLL_ROT | 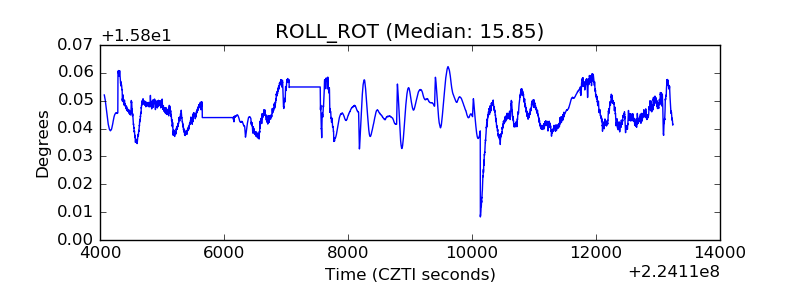 |
| _Roll_DEC | 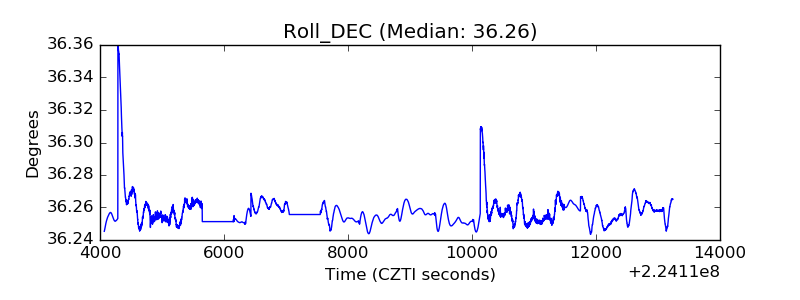 |
| _Roll_RA | 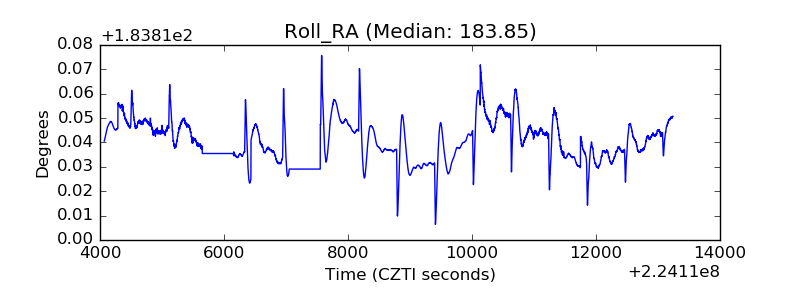 |
| Veto Counter | 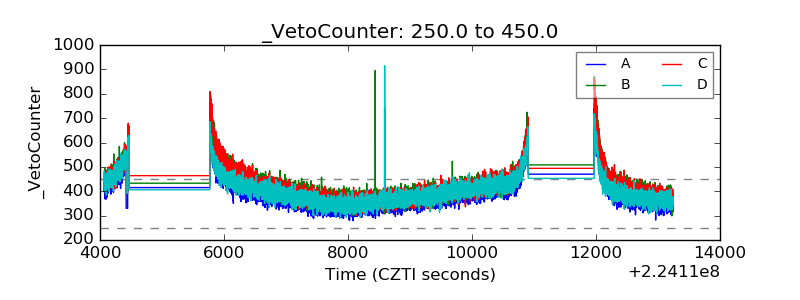 |