| Param | Original file | Final file |
|---|---|---|
| Filename | modeM0/AS1G06_151T02_9000001010_07371cztM0_level2.evt | modeM0/AS1G06_151T02_9000001010_07371cztM0_level2_quad_clean.evt |
| Size (bytes) | 568,247,040 | 99,659,520 |
| Size | 541.9 MB | 95.0 MB |
| Events in quadrant A | 5,550,290 | 610,573 |
| Events in quadrant B | 3,665,271 | 630,143 |
| Events in quadrant C | 3,429,378 | 635,646 |
| Events in quadrant D | 4,037,202 | 601,514 |
| Mode M9 | |||
|---|---|---|---|
| Quadrant | BADHDUFLAG | Total packets | Discarded packets |
| A | 0 | 11 | 4 |
| B | 0 | 8 | 0 |
| C | 0 | 10 | 3 |
| D | 0 | 8 | 1 |
| Mode M0 | |||
|---|---|---|---|
| Quadrant | BADHDUFLAG | Total packets | Discarded packets |
| A | 0 | 32251 | 10062 |
| B | 0 | 27886 | 11455 |
| C | 0 | 26053 | 10014 |
| D | 0 | 30288 | 12782 |
| Mode SS | |||
|---|---|---|---|
| Quadrant | BADHDUFLAG | Total packets | Discarded packets |
| A | 0 | 254 | 90 |
| B | 0 | 255 | 93 |
| C | 0 | 256 | 102 |
| D | 0 | 255 | 103 |
| Quadrant | Total seconds | Saturated seconds | Saturation percentage |
|---|---|---|---|
| A | 7776 | 512 | 6.584362% |
| B | 7727 | 52 | 0.672965% |
| C | 7805 | 32 | 0.409994% |
| D | 7738 | 58 | 0.749548% |
Noise dominated data is calculated using 1-second bins in cleaned event files. If a bin has >2000 counts, and if more than 50% of those come from <1% of pixels, then it is considered to be noise-dominated and hence unusable.
| Quadrant | # 1 sec bins | Bins with >0 counts | Bins with >2000 counts | High rate bins dominated by noise | Noise dominated (total time) | Noise dominated (detector-on time) | Marked lightcurve |
|---|---|---|---|---|---|---|---|
| A | 13345 | 8138 | 291 | 291 | 2.18% | 3.58% | 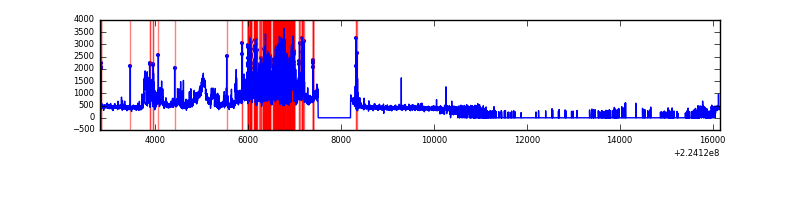 |
| B | 13345 | 8073 | 7 | 7 | 0.05% | 0.09% | 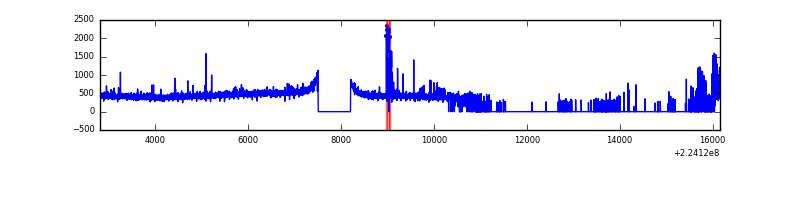 |
| C | 13345 | 8201 | 4 | 4 | 0.03% | 0.05% | 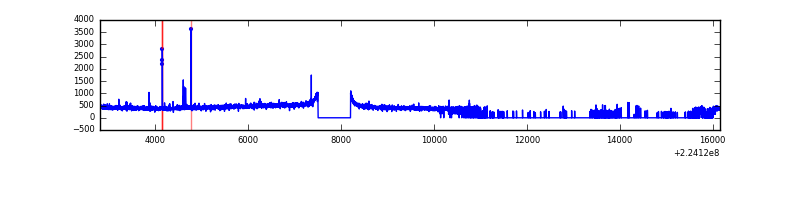 |
| D | 13345 | 8073 | 34 | 34 | 0.25% | 0.42% | 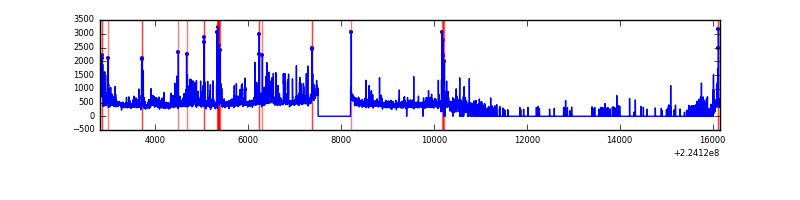 |
Top three noisy pixels from each quadrant. If the there are fewer than three noisy pixels in the level2.evt file, extra rows are filled as -1
| Pixel properties | Quadrant properties | ||||||
|---|---|---|---|---|---|---|---|
| Quadrant | DetID | PixID | Counts | Sigma | Mean | Median | Sigma |
| A | 15 | 234 | 1409539 | 8068.37 | 857 | 839 | 174.6 |
| A | 14 | 111 | 704421 | 4029.79 | 857 | 839 | 174.6 |
| A | 15 | 239 | 109785 | 623.99 | 857 | 839 | 174.6 |
| B | 0 | 187 | 214256 | 1258.47 | 881 | 861 | 169.6 |
| B | 12 | 111 | 17686 | 99.22 | 881 | 861 | 169.6 |
| B | 11 | 111 | 14044 | 77.75 | 881 | 861 | 169.6 |
| C | 1 | 16 | 37934 | 184.73 | 856 | 862 | 200.7 |
| C | 9 | 68 | 31264 | 151.5 | 856 | 862 | 200.7 |
| C | 8 | 229 | 17639 | 83.6 | 856 | 862 | 200.7 |
| D | 1 | 52 | 406445 | 1952.62 | 844 | 818 | 207.7 |
| D | 14 | 34 | 188889 | 905.34 | 844 | 818 | 207.7 |
| D | 1 | 20 | 179707 | 861.14 | 844 | 818 | 207.7 |
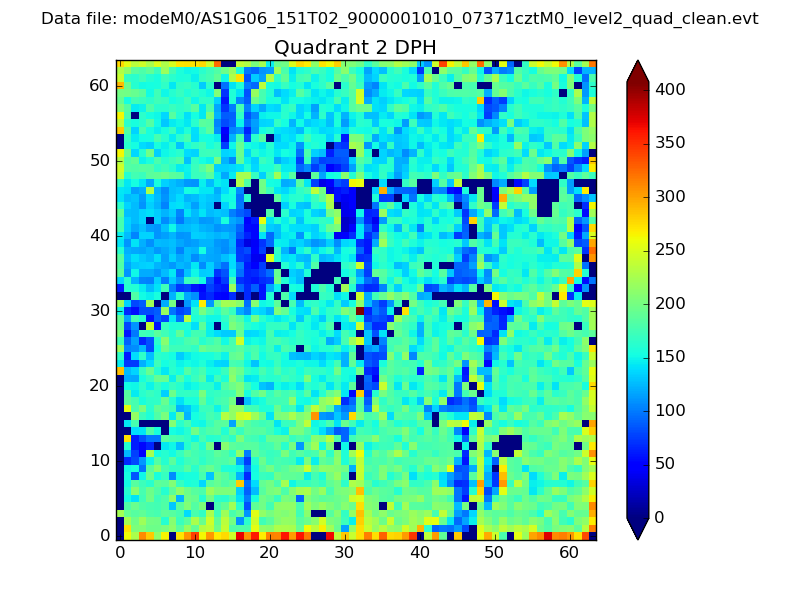
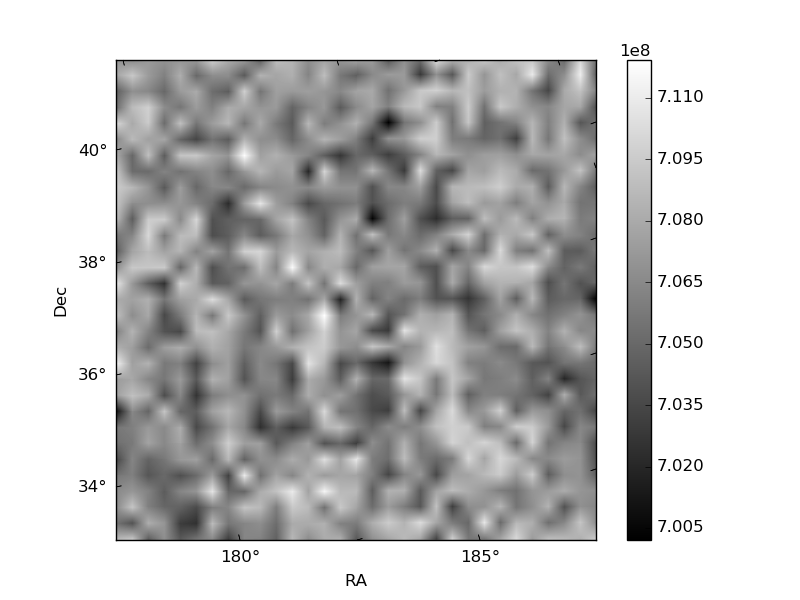
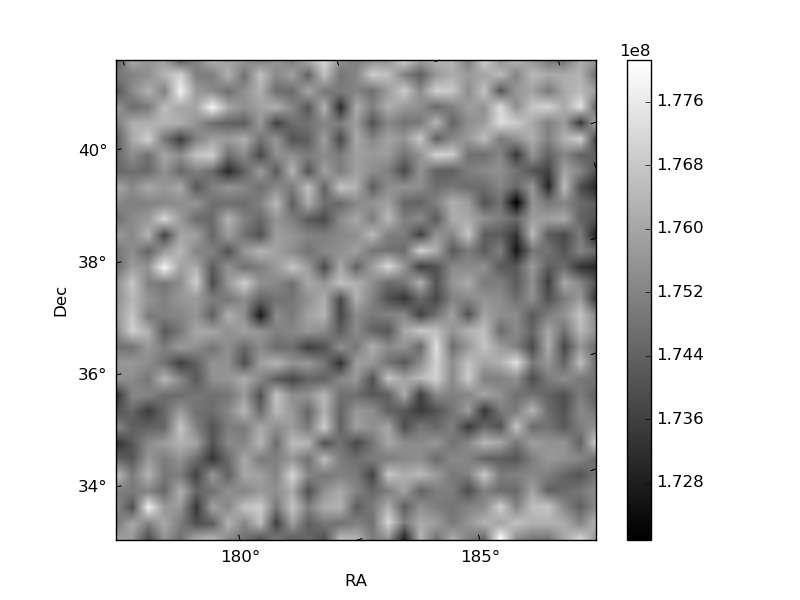
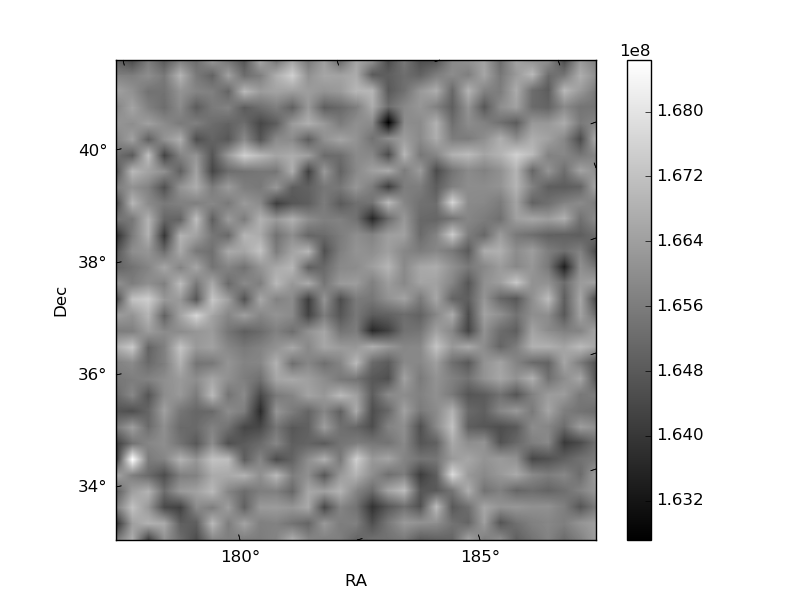
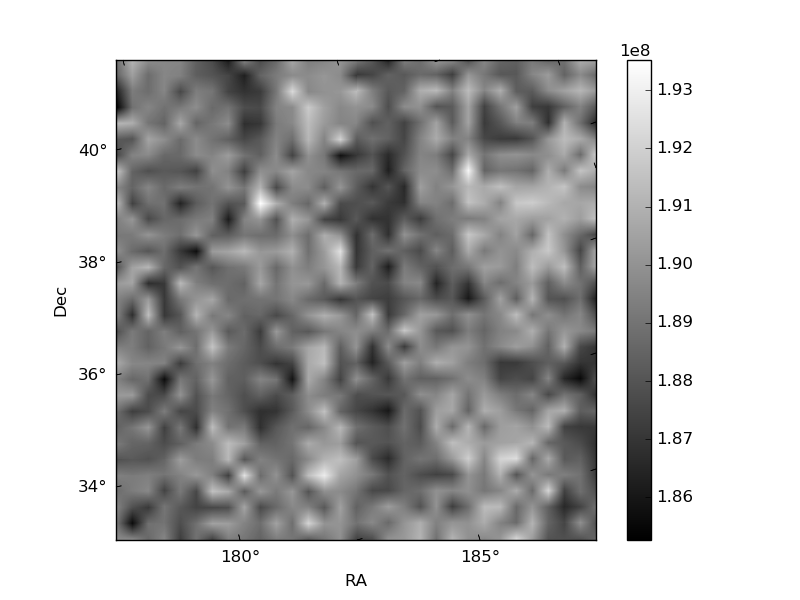
Histogram calculated using DETX and DETY for each event in the final _common_clean file
| Quadrant A | 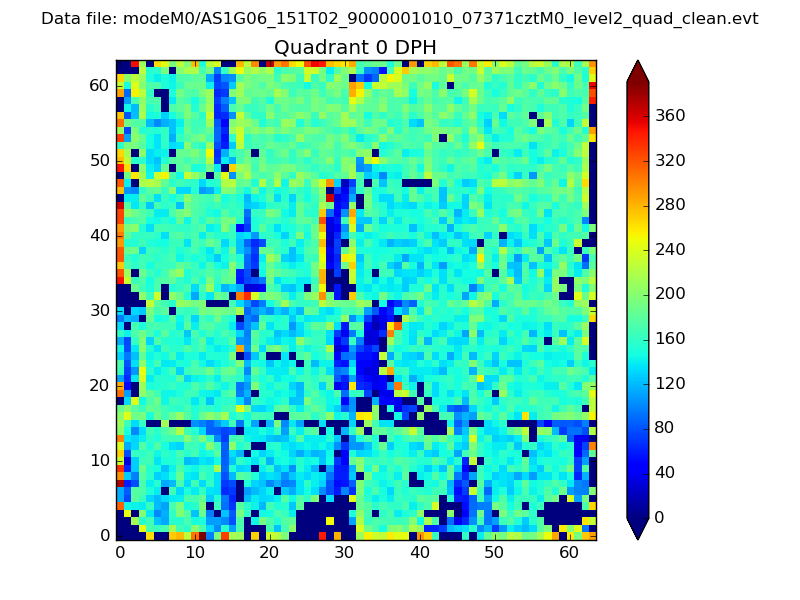 |
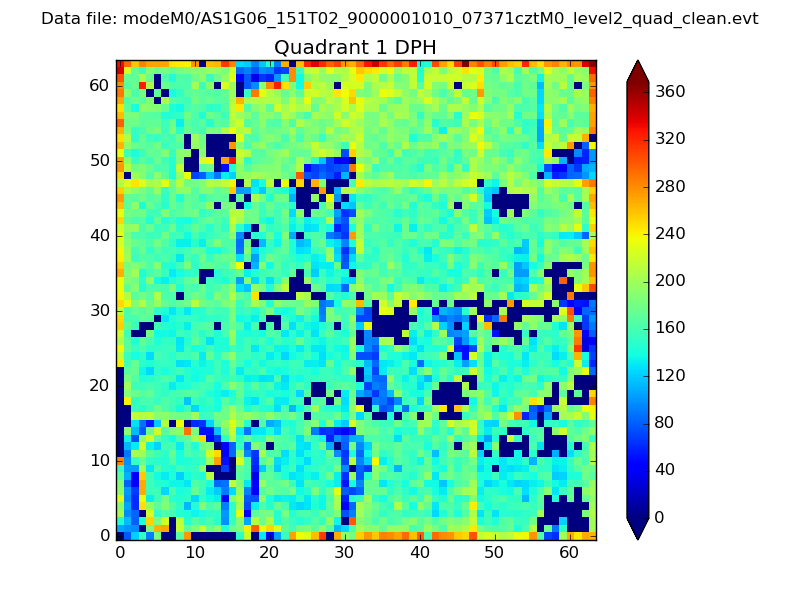 |
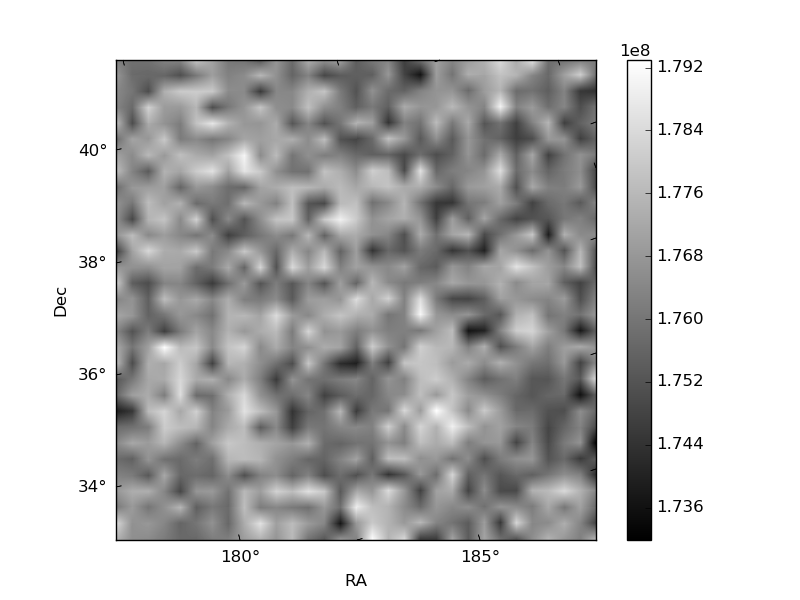
Quadrant B |
|---|---|---|---|
| Quadrant D | 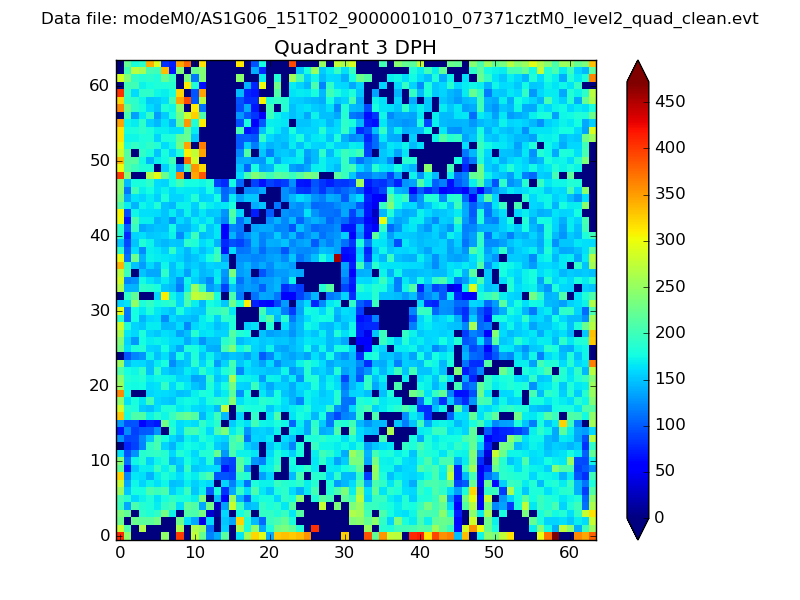 |
 |
Quadrant C |
| Plot type | Count rate plots | Images |
|---|---|---|
| Comparison with Poisson distribution Blue bars denote a histogram of data divided into 1 sec bins. Red curve is a Poisson curve with rate = median count rate of data. |
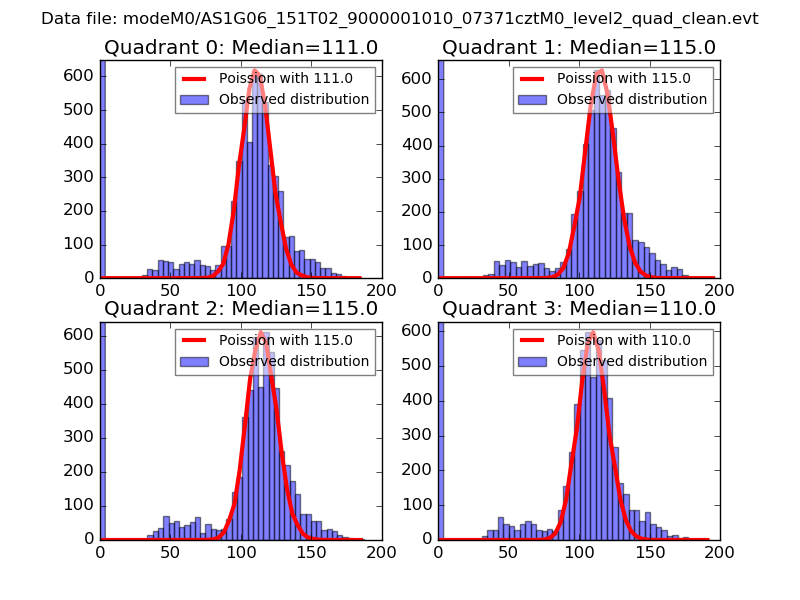 |
 |
| Quadrant-wise count rates Data is divided into 100 sec bins |
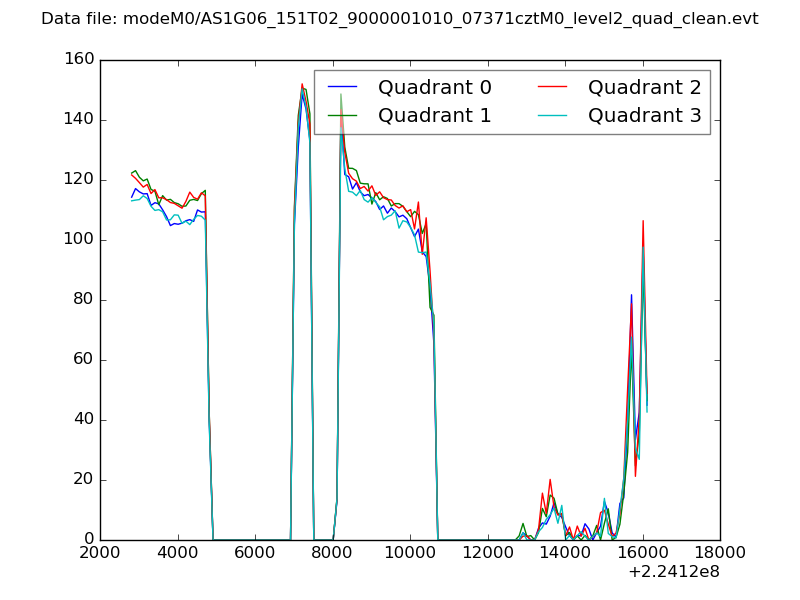 |
|
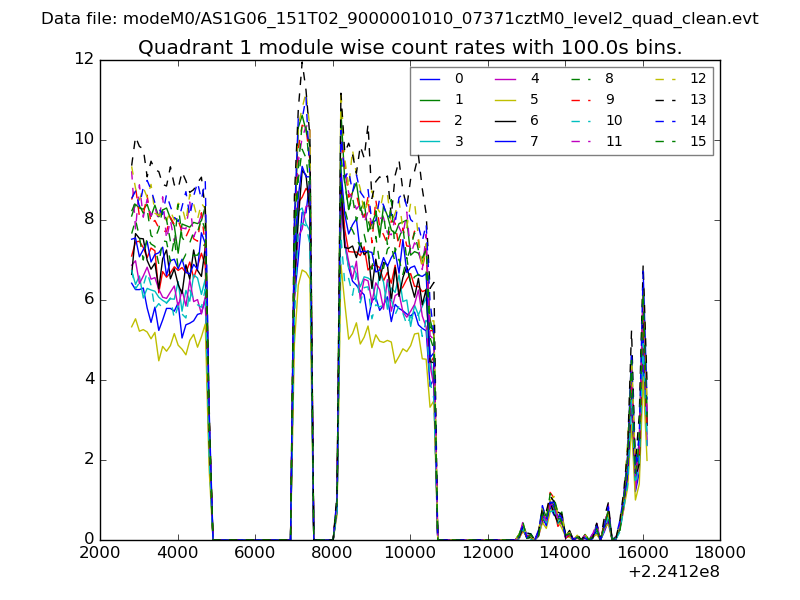
| Module-wise count rates for Quadrant A Data is divided into 100 sec bins |
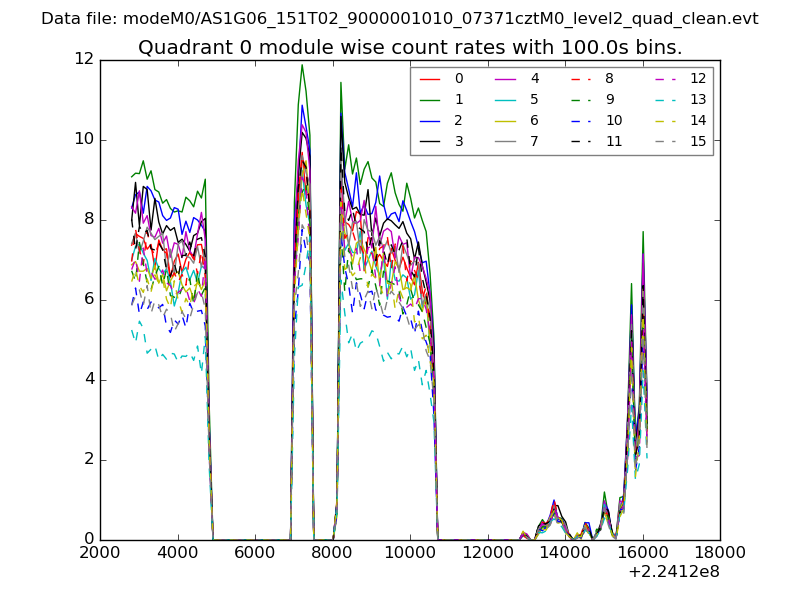 |
 |
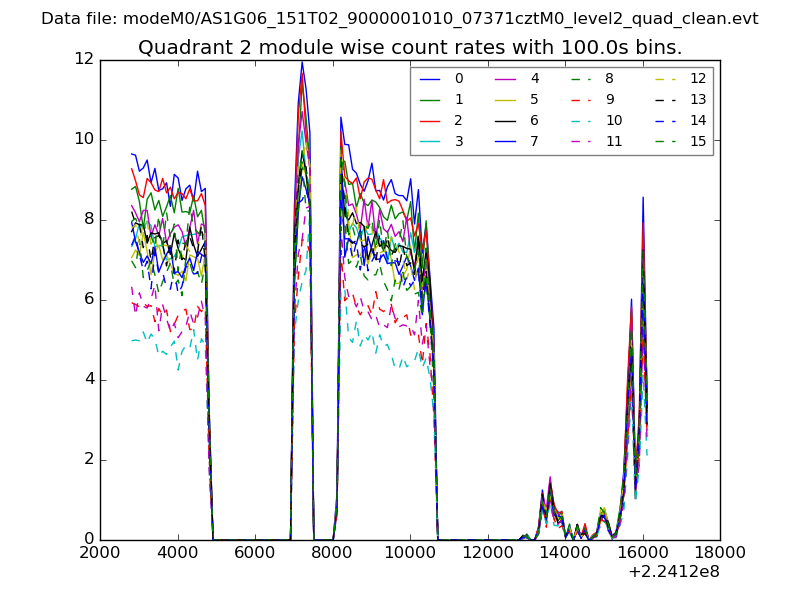
| Module-wise count rates for Quadrant B Data is divided into 100 sec bins |
 |
 |
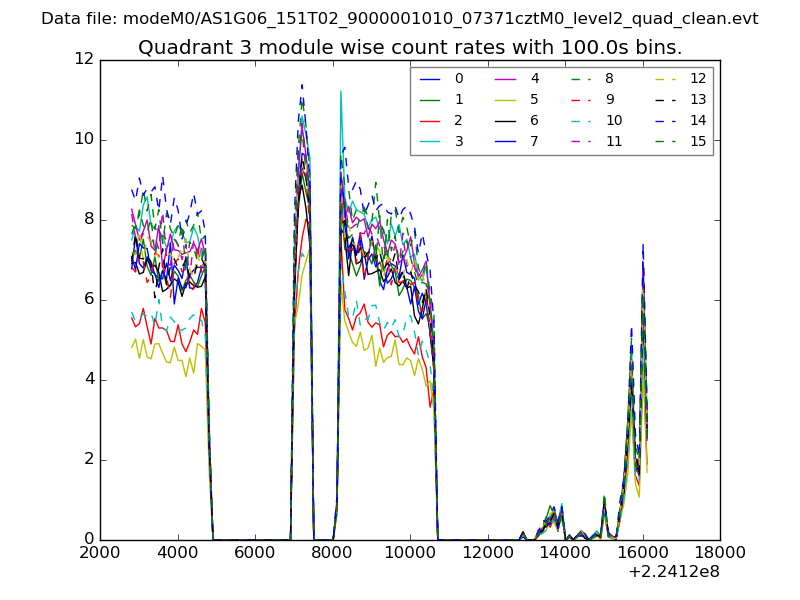
| Module-wise count rates for Quadrant C Data is divided into 100 sec bins |
 |
 |
| Module-wise count rates for Quadrant D Data is divided into 100 sec bins |
 |
 |
| Parameter | Plot |
|---|---|
| CZT HV Monitor | 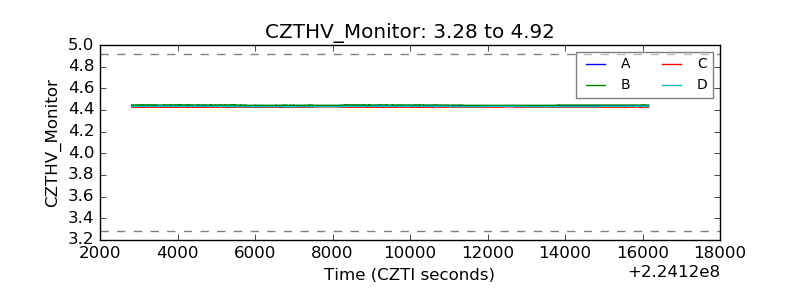 |
| D_VDD | 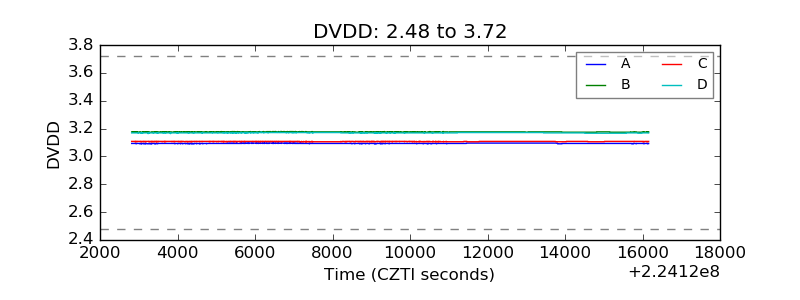 |
| Temperature 1 | 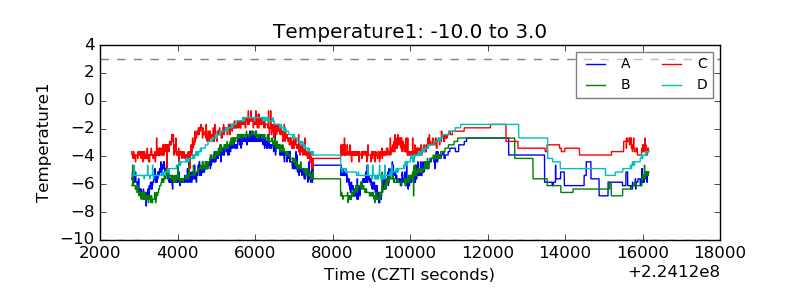 |
| Veto HV Monitor | 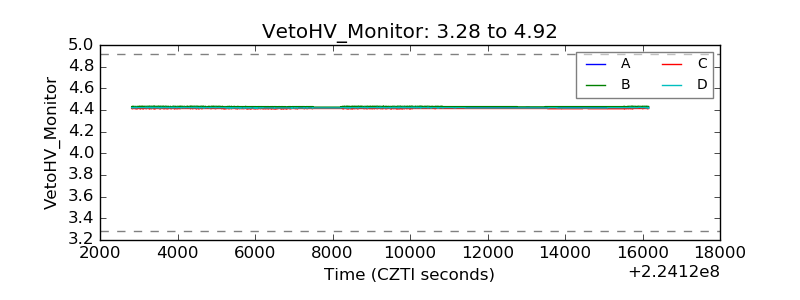 |
| Veto LLD | 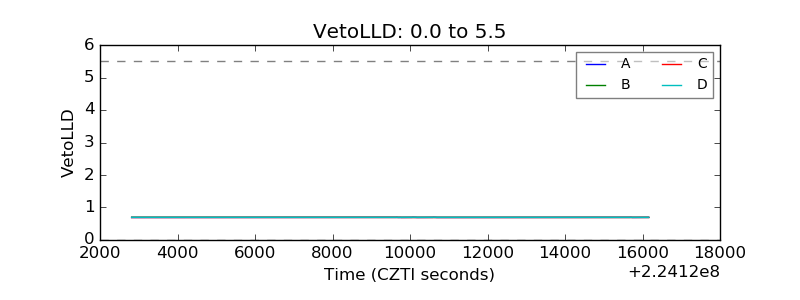 |
| Alpha Counter | 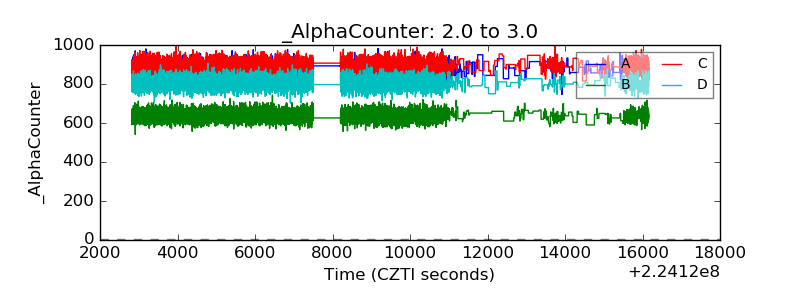 |
| _CPM_Rate | 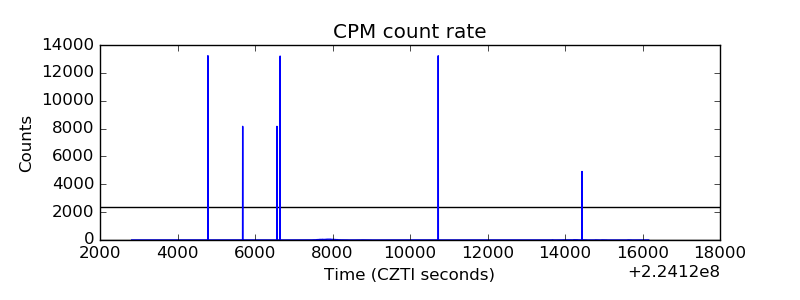 |
| CZT Counter | 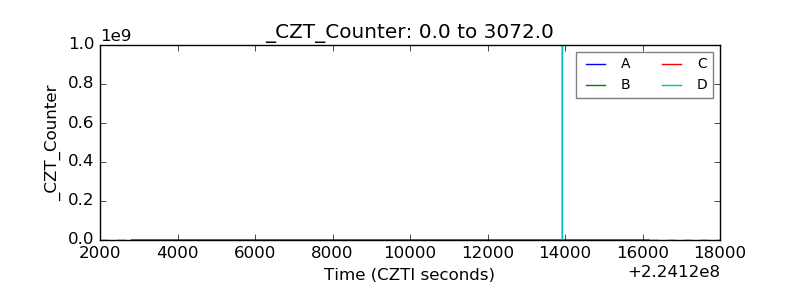 |
| +2.5 Volts monitor | 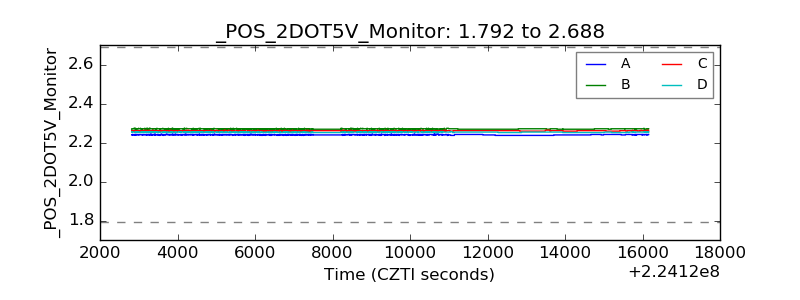 |
| +5 Volts monitor | 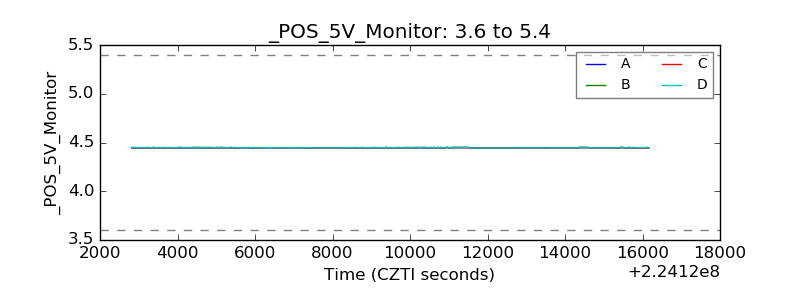 |
| _ROLL_ROT | 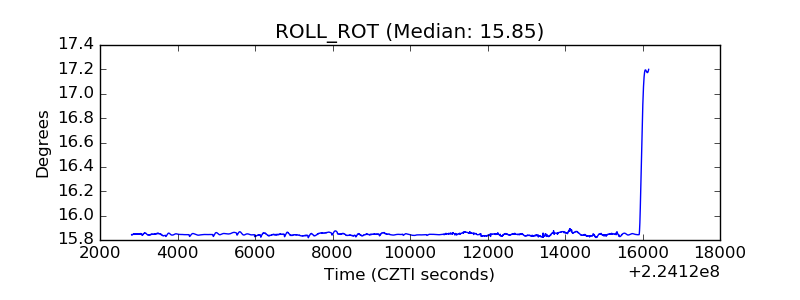 |
| _Roll_DEC | 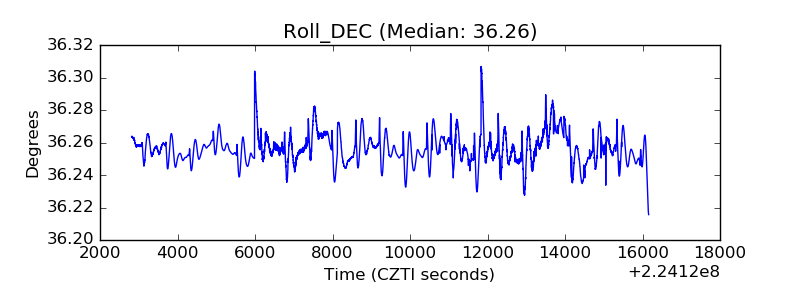 |
| _Roll_RA | 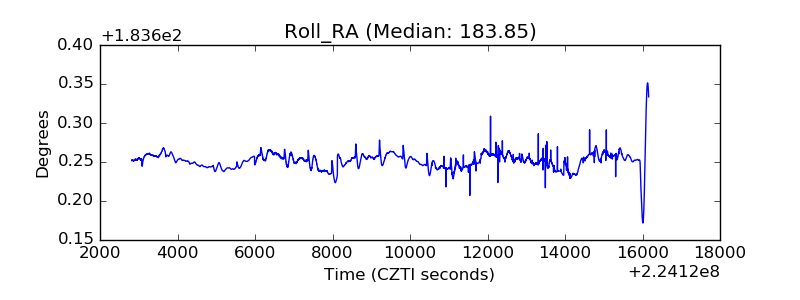 |
| Veto Counter | 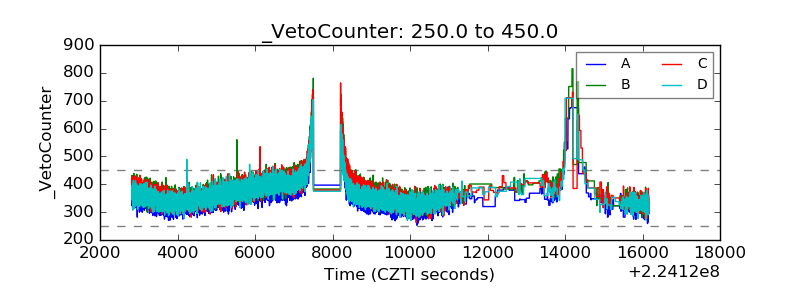 |