| Param | Original file | Final file |
|---|---|---|
| Filename | modeM0/AS1G06_151T02_9000001010_07372cztM0_level2.evt | modeM0/AS1G06_151T02_9000001010_07372cztM0_level2_quad_clean.evt |
| Size (bytes) | 1,328,325,120 | 231,177,600 |
| Size | 1.2 GB | 220.5 MB |
| Events in quadrant A | 10,778,416 | 1,413,925 |
| Events in quadrant B | 9,380,965 | 1,458,972 |
| Events in quadrant C | 8,525,980 | 1,456,246 |
| Events in quadrant D | 10,282,178 | 1,387,146 |
| Mode M9 | |||
|---|---|---|---|
| Quadrant | BADHDUFLAG | Total packets | Discarded packets |
| A | 0 | 9 | 0 |
| B | 0 | 9 | 0 |
| C | 0 | 9 | 0 |
| D | 0 | 9 | 0 |
| Mode M0 | |||
|---|---|---|---|
| Quadrant | BADHDUFLAG | Total packets | Discarded packets |
| A | 0 | 45116 | 70 |
| B | 0 | 40704 | 152 |
| C | 0 | 38697 | 63 |
| D | 0 | 43842 | 121 |
| Mode SS | |||
|---|---|---|---|
| Quadrant | BADHDUFLAG | Total packets | Discarded packets |
| A | 0 | 380 | 0 |
| B | 0 | 380 | 0 |
| C | 0 | 380 | 0 |
| D | 0 | 380 | 2 |
| Quadrant | Total seconds | Saturated seconds | Saturation percentage |
|---|---|---|---|
| A | 18649 | 888 | 4.761649% |
| B | 18629 | 445 | 2.388749% |
| C | 18652 | 182 | 0.975767% |
| D | 18646 | 466 | 2.499196% |
Noise dominated data is calculated using 1-second bins in cleaned event files. If a bin has >2000 counts, and if more than 50% of those come from <1% of pixels, then it is considered to be noise-dominated and hence unusable.
| Quadrant | # 1 sec bins | Bins with >0 counts | Bins with >2000 counts | High rate bins dominated by noise | Noise dominated (total time) | Noise dominated (detector-on time) | Marked lightcurve |
|---|---|---|---|---|---|---|---|
| A | 19597 | 18683 | 293 | 293 | 1.50% | 1.57% |  |
| B | 19597 | 18681 | 8 | 8 | 0.04% | 0.04% | 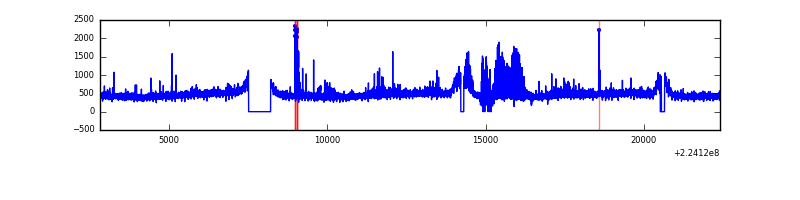 |
| C | 19597 | 18685 | 4 | 4 | 0.02% | 0.02% |  |
| D | 19597 | 18682 | 179 | 179 | 0.91% | 0.96% | 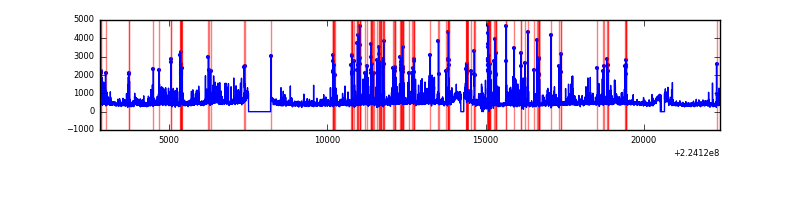 |
Top three noisy pixels from each quadrant. If the there are fewer than three noisy pixels in the level2.evt file, extra rows are filled as -1
| Pixel properties | Quadrant properties | ||||||
|---|---|---|---|---|---|---|---|
| Quadrant | DetID | PixID | Counts | Sigma | Mean | Median | Sigma |
| A | 15 | 234 | 1472624 | 3334.97 | 2163 | 2112 | 440.9 |
| A | 14 | 111 | 718560 | 1624.83 | 2163 | 2112 | 440.9 |
| A | 15 | 239 | 206290 | 463.06 | 2163 | 2112 | 440.9 |
| B | 0 | 187 | 671121 | 1572.85 | 2204 | 2147 | 425.3 |
| B | 0 | 214 | 126424 | 292.19 | 2204 | 2147 | 425.3 |
| B | 12 | 111 | 44751 | 100.17 | 2204 | 2147 | 425.3 |
| C | 9 | 68 | 97821 | 192.23 | 2134 | 2143 | 497.7 |
| C | 8 | 229 | 54141 | 104.47 | 2134 | 2143 | 497.7 |
| C | 1 | 16 | 48307 | 92.75 | 2134 | 2143 | 497.7 |
| D | 14 | 34 | 1215971 | 2321.55 | 2122 | 2057 | 522.9 |
| D | 1 | 52 | 433242 | 824.62 | 2122 | 2057 | 522.9 |
| D | 1 | 20 | 182152 | 344.42 | 2122 | 2057 | 522.9 |
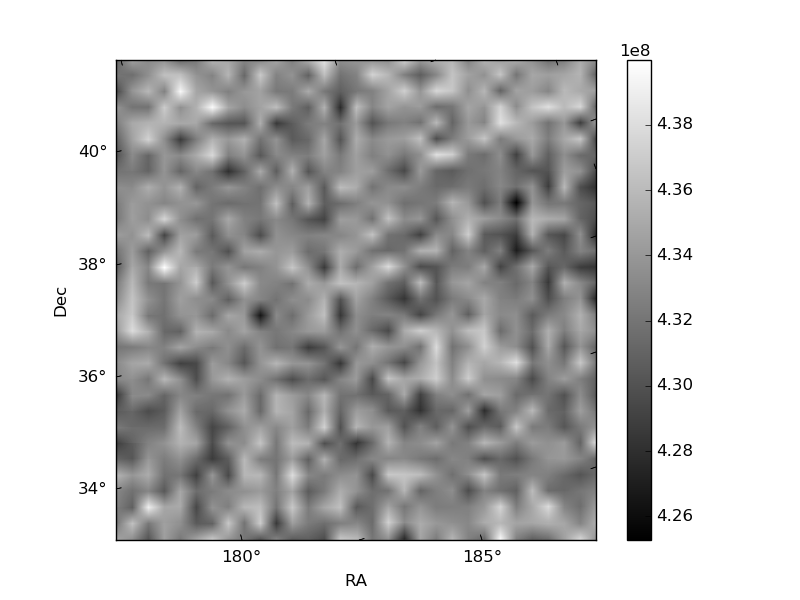
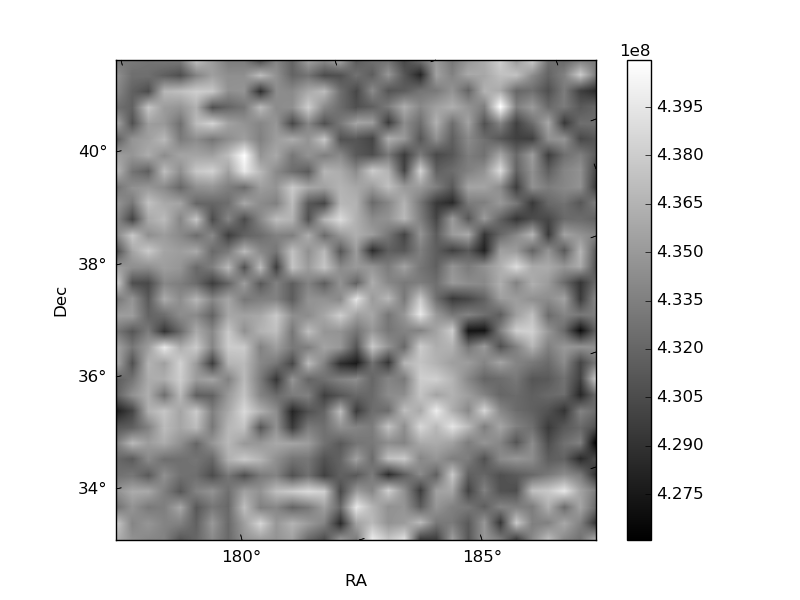
Histogram calculated using DETX and DETY for each event in the final _common_clean file
| Quadrant A | 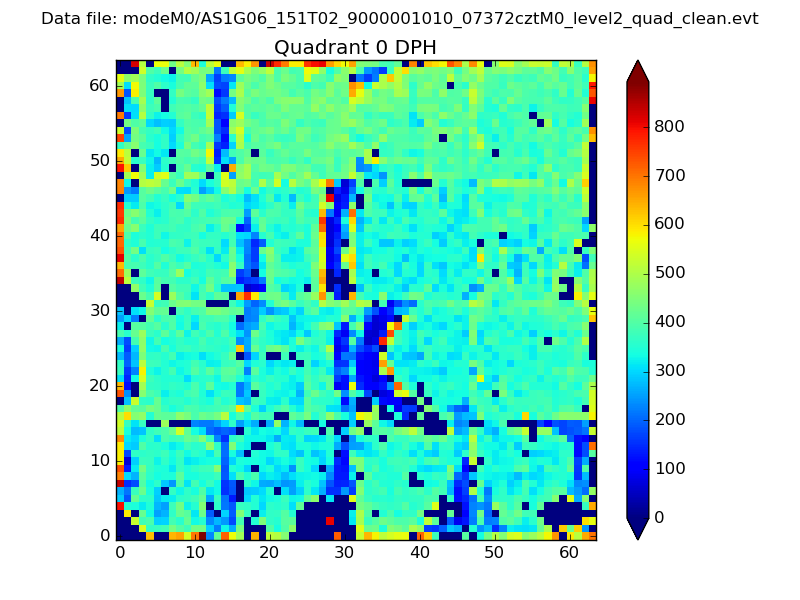 |
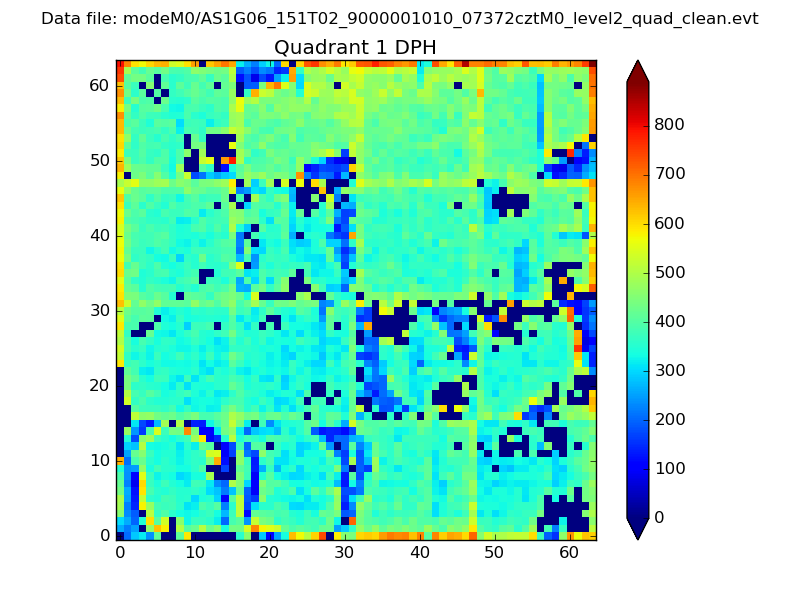 |
Quadrant B |
|---|---|---|---|
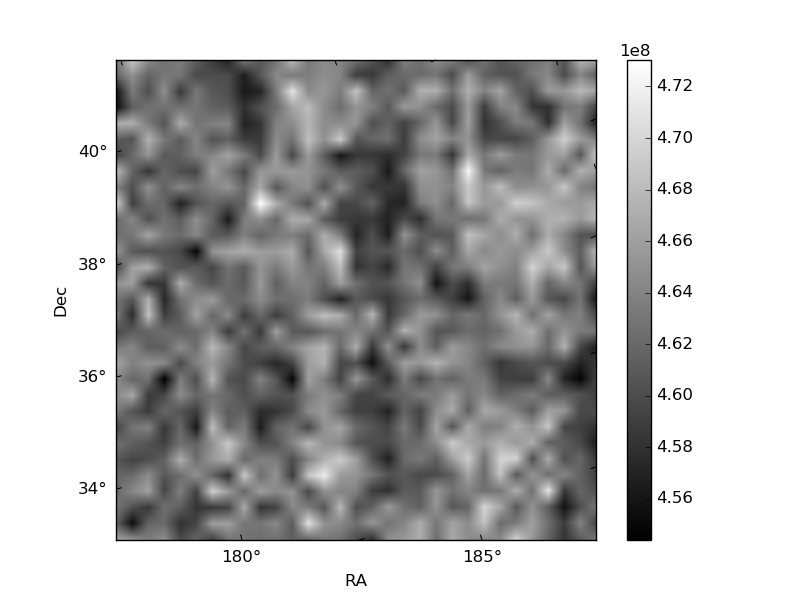
| Quadrant D |  |
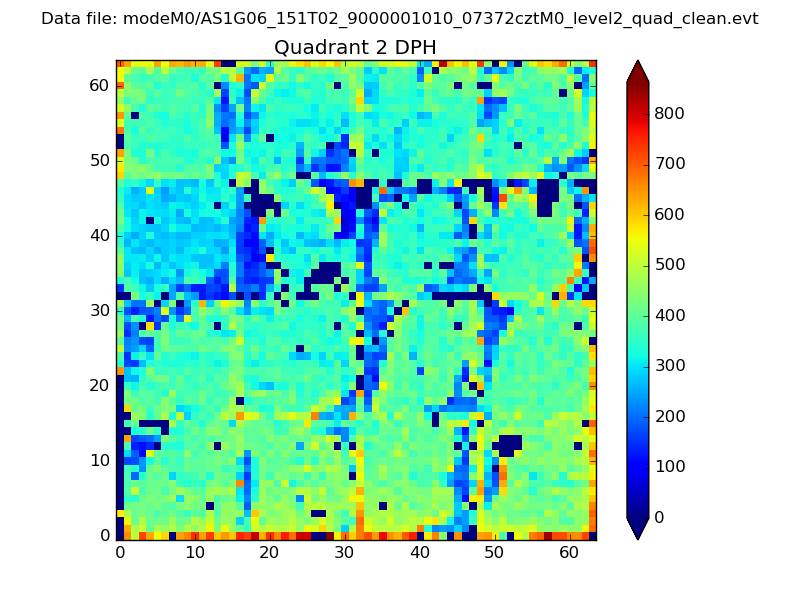 |
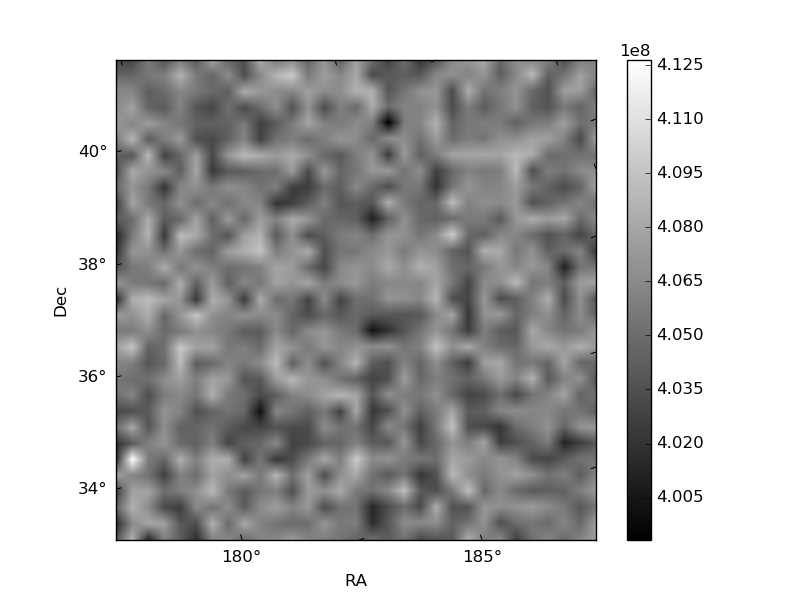
Quadrant C |
| Plot type | Count rate plots | Images |
|---|---|---|
| Comparison with Poisson distribution Blue bars denote a histogram of data divided into 1 sec bins. Red curve is a Poisson curve with rate = median count rate of data. |
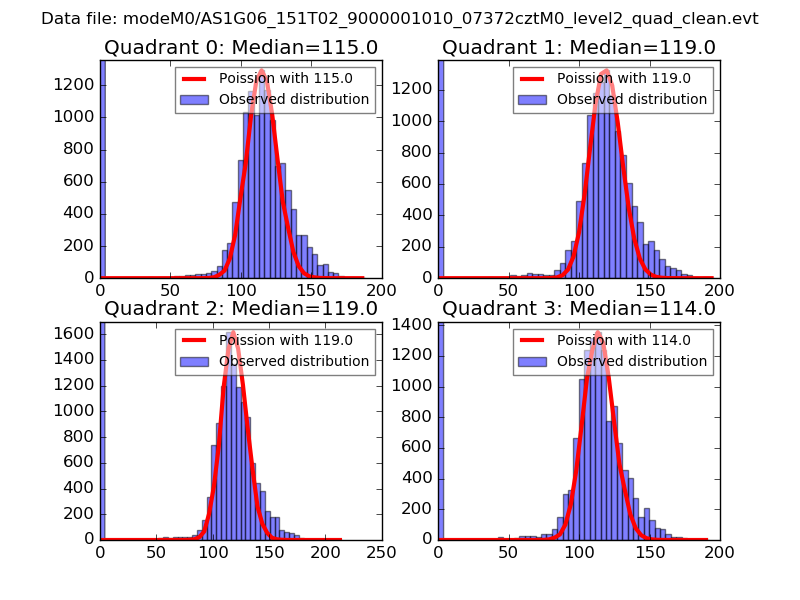 |
 |
| Quadrant-wise count rates Data is divided into 100 sec bins |
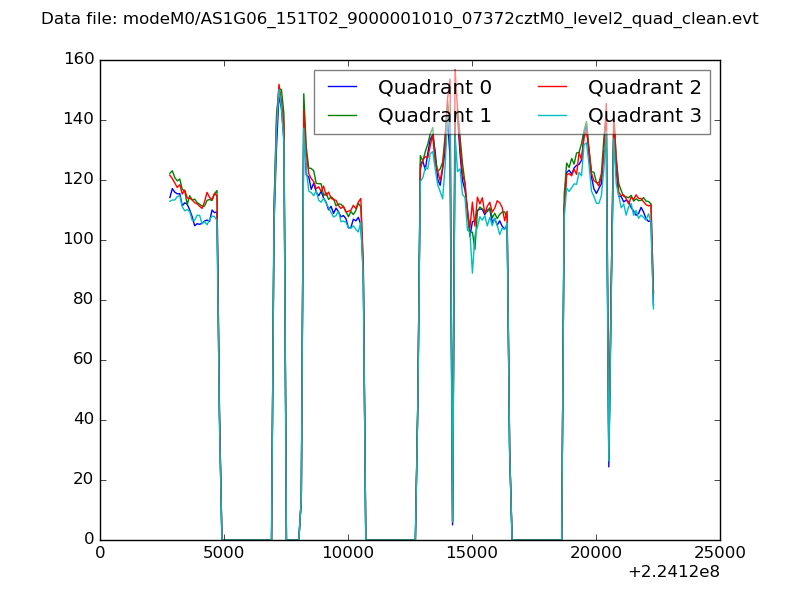 |
|
| Module-wise count rates for Quadrant A Data is divided into 100 sec bins |
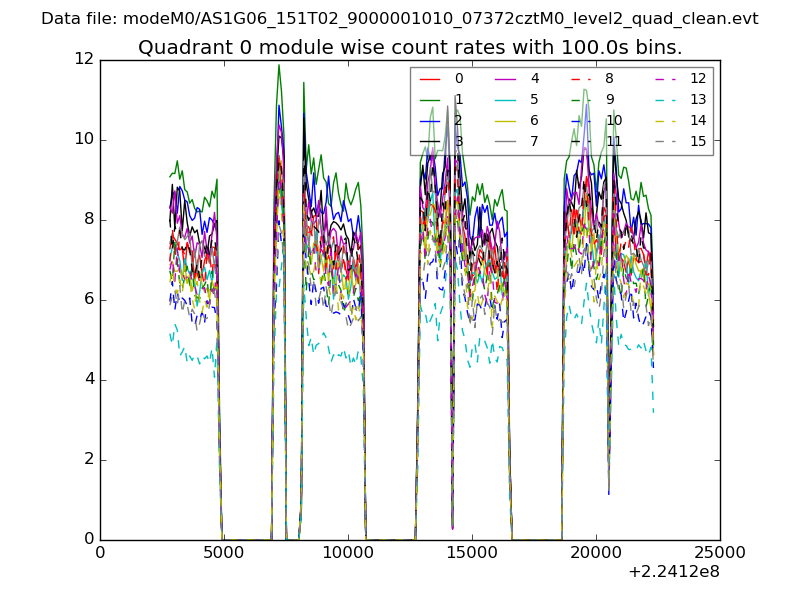 |
 |
| Module-wise count rates for Quadrant B Data is divided into 100 sec bins |
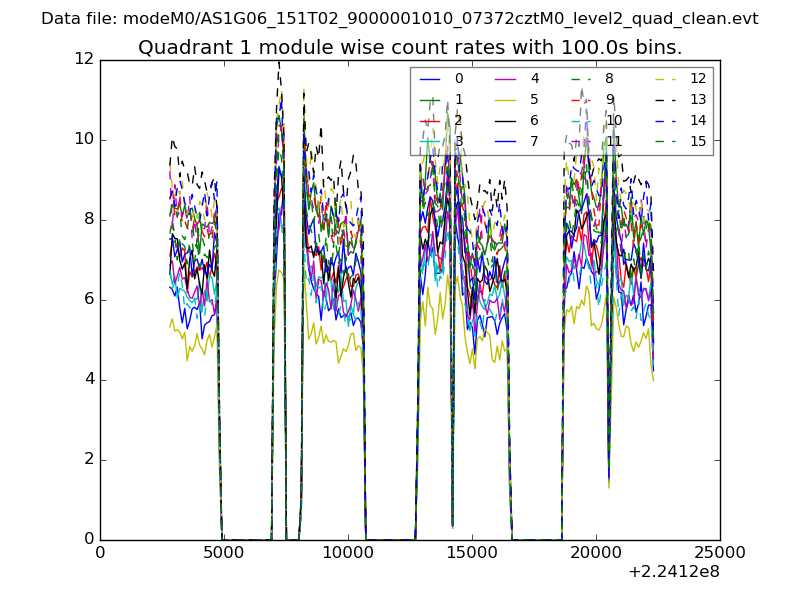 |
 |
| Module-wise count rates for Quadrant C Data is divided into 100 sec bins |
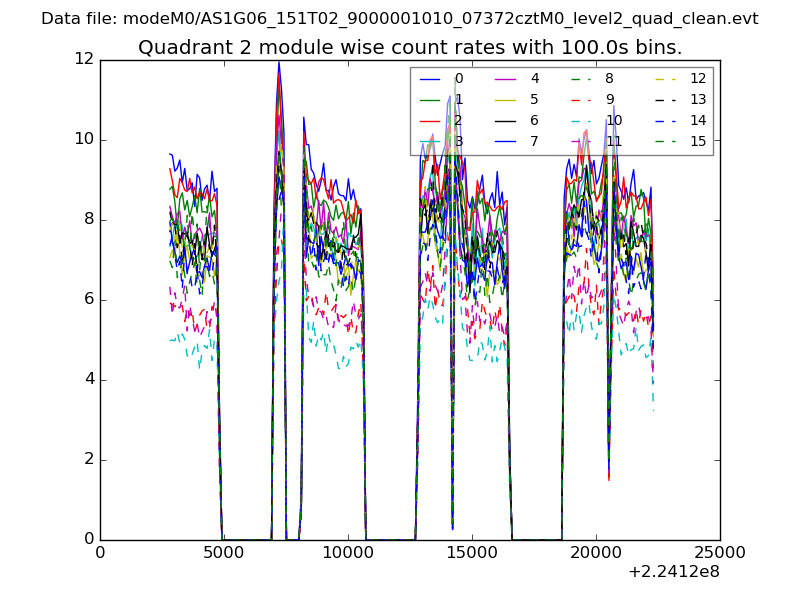 |
 |
| Module-wise count rates for Quadrant D Data is divided into 100 sec bins |
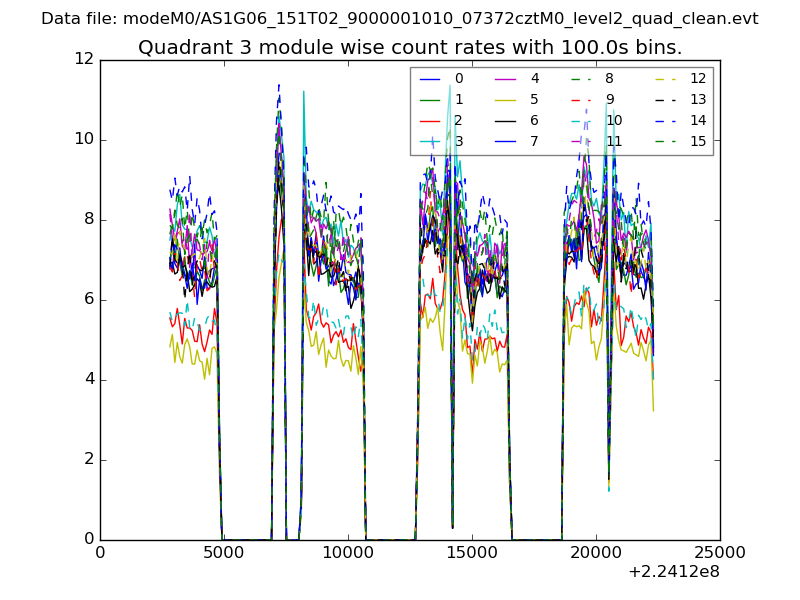 |
 |
| Parameter | Plot |
|---|---|
| CZT HV Monitor | 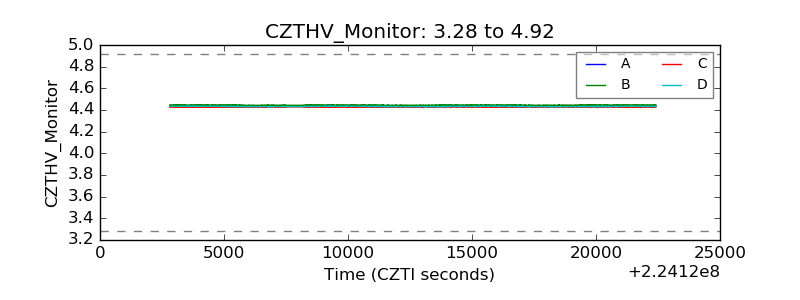 |
| D_VDD | 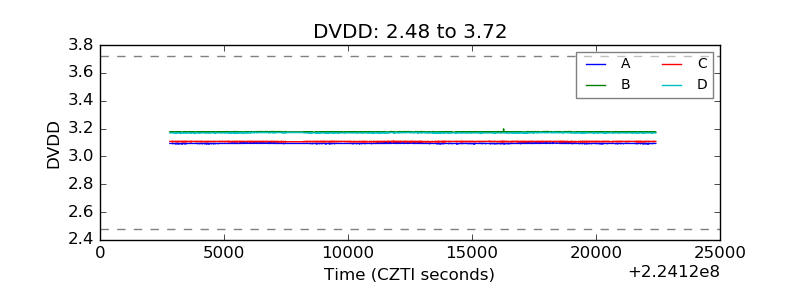 |
| Temperature 1 | 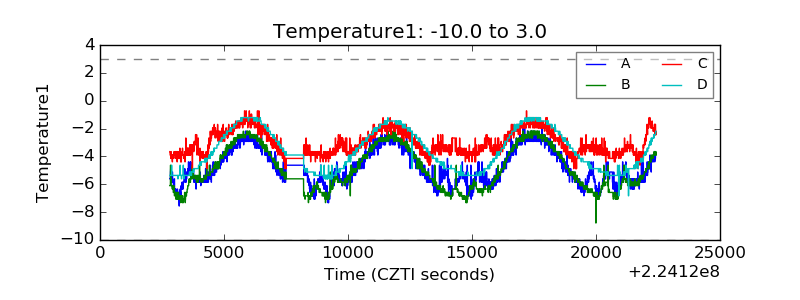 |
| Veto HV Monitor | 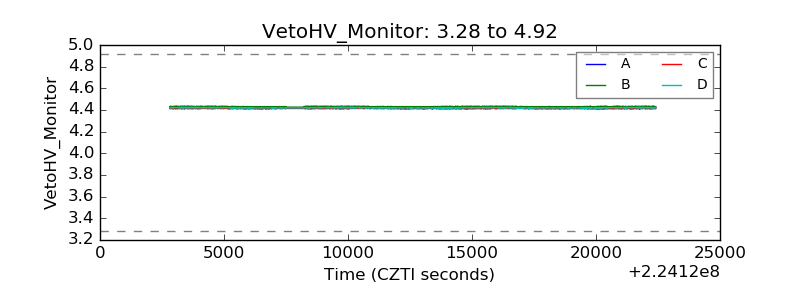 |
| Veto LLD | 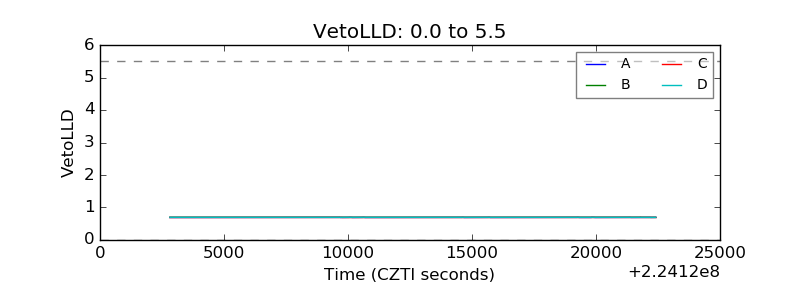 |
| Alpha Counter | 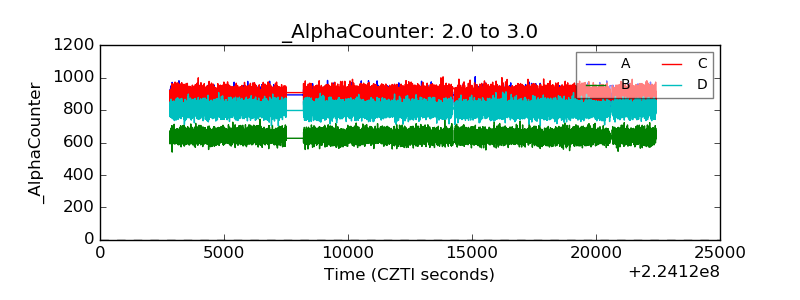 |
| _CPM_Rate | 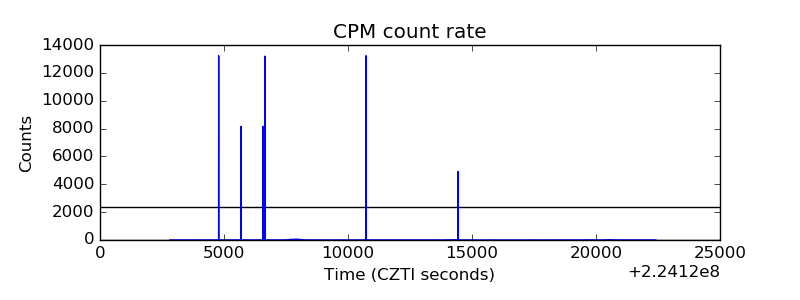 |
| CZT Counter | 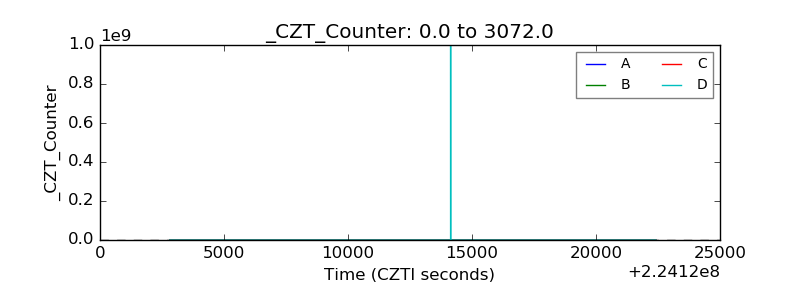 |
| +2.5 Volts monitor |  |
| +5 Volts monitor |  |
| _ROLL_ROT | 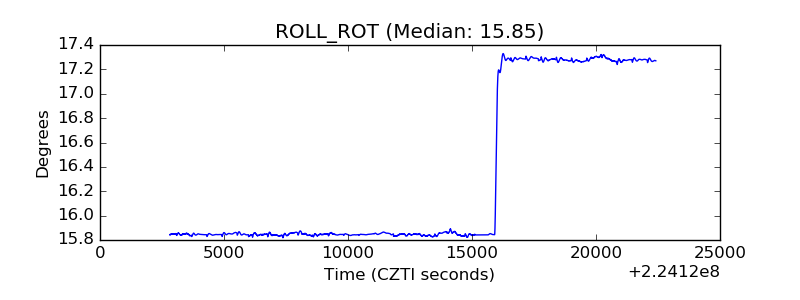 |
| _Roll_DEC | 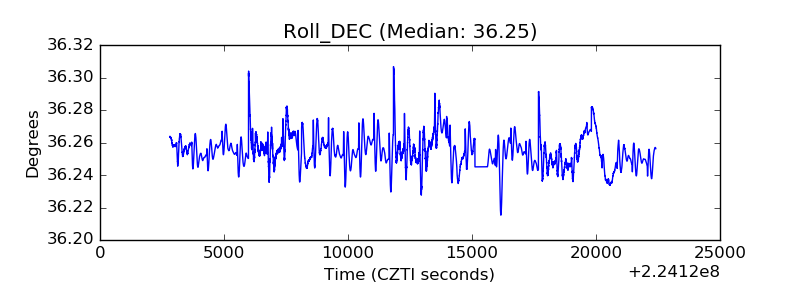 |
| _Roll_RA | 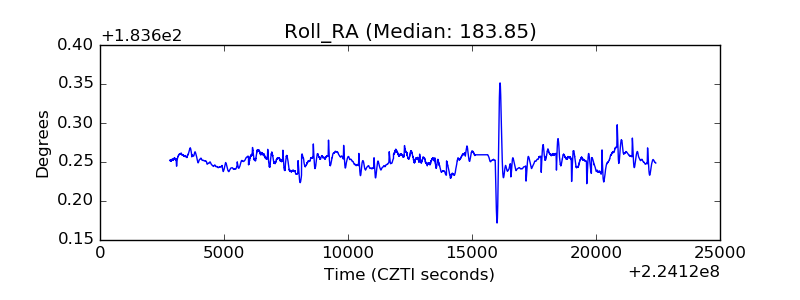 |
| Veto Counter | 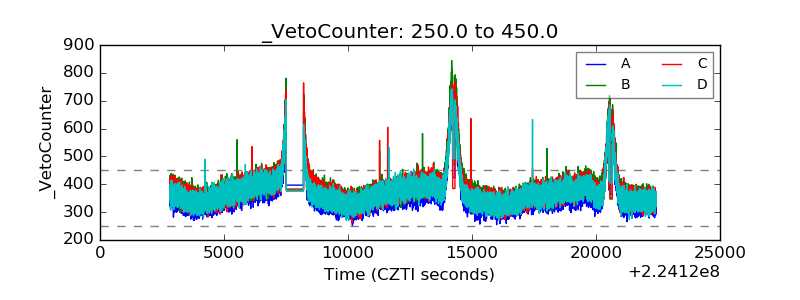 |