| Param | Original file | Final file |
|---|---|---|
| Filename | modeM0/AS1G06_151T02_9000001010_07376cztM0_level2.evt | modeM0/AS1G06_151T02_9000001010_07376cztM0_level2_quad_clean.evt |
| Size (bytes) | 212,829,120 | 44,127,360 |
| Size | 203.0 MB | 42.1 MB |
| Events in quadrant A | 2,091,752 | 276,582 |
| Events in quadrant B | 1,343,569 | 291,710 |
| Events in quadrant C | 1,416,657 | 289,696 |
| Events in quadrant D | 1,399,745 | 276,146 |
| Mode M9 | |||
|---|---|---|---|
| Quadrant | BADHDUFLAG | Total packets | Discarded packets |
| A | 0 | 4 | 0 |
| B | 0 | 4 | 0 |
| C | 0 | 4 | 0 |
| D | 0 | 4 | 0 |
| Mode M0 | |||
|---|---|---|---|
| Quadrant | BADHDUFLAG | Total packets | Discarded packets |
| A | 0 | 8613 | 435 |
| B | 0 | 6311 | 449 |
| C | 0 | 6470 | 420 |
| D | 0 | 6663 | 494 |
| Mode SS | |||
|---|---|---|---|
| Quadrant | BADHDUFLAG | Total packets | Discarded packets |
| A | 0 | 62 | 4 |
| B | 0 | 61 | 3 |
| C | 0 | 62 | 4 |
| D | 0 | 63 | 5 |
| Quadrant | Total seconds | Saturated seconds | Saturation percentage |
|---|---|---|---|
| A | 2827 | 164 | 5.801203% |
| B | 2823 | 87 | 3.081828% |
| C | 2827 | 65 | 2.299257% |
| D | 2818 | 92 | 3.264727% |
Noise dominated data is calculated using 1-second bins in cleaned event files. If a bin has >2000 counts, and if more than 50% of those come from <1% of pixels, then it is considered to be noise-dominated and hence unusable.
| Quadrant | # 1 sec bins | Bins with >0 counts | Bins with >2000 counts | High rate bins dominated by noise | Noise dominated (total time) | Noise dominated (detector-on time) | Marked lightcurve |
|---|---|---|---|---|---|---|---|
| A | 4924 | 2865 | 43 | 43 | 0.87% | 1.50% | 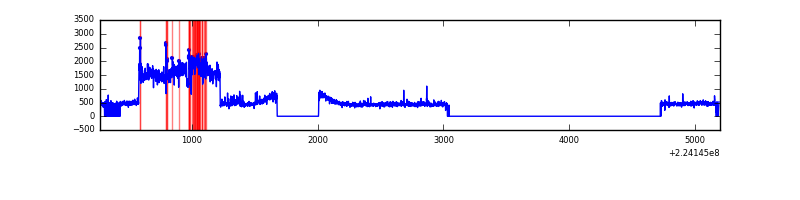 |
| B | 4926 | 2868 | 1 | 1 | 0.02% | 0.03% | 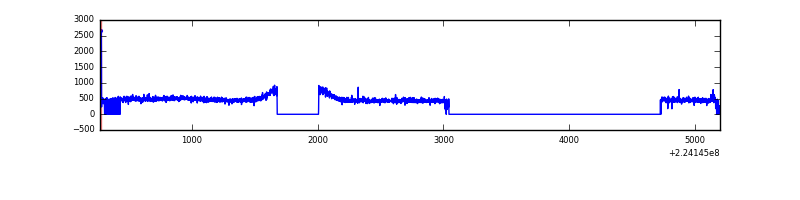 |
| C | 4927 | 2867 | 0 | 0 | 0.00% | 0.00% |  |
| D | 4927 | 2856 | 12 | 12 | 0.24% | 0.42% | 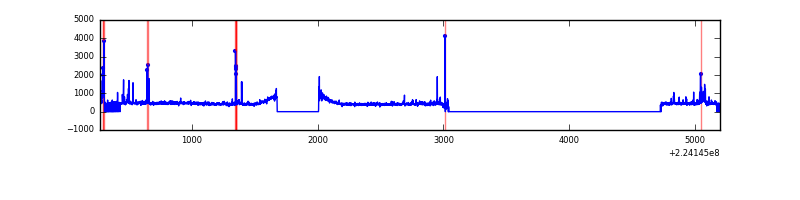 |
Top three noisy pixels from each quadrant. If the there are fewer than three noisy pixels in the level2.evt file, extra rows are filled as -1
| Pixel properties | Quadrant properties | ||||||
|---|---|---|---|---|---|---|---|
| Quadrant | DetID | PixID | Counts | Sigma | Mean | Median | Sigma |
| A | 15 | 234 | 726614 | 10301.78 | 337 | 328 | 70.5 |
| A | 15 | 239 | 56382 | 795.08 | 337 | 328 | 70.5 |
| A | 14 | 111 | 6134 | 82.35 | 337 | 328 | 70.5 |
| B | 12 | 111 | 7125 | 98.64 | 343 | 334 | 68.8 |
| B | 11 | 111 | 5716 | 78.17 | 343 | 334 | 68.8 |
| B | 4 | 81 | 5235 | 71.19 | 343 | 334 | 68.8 |
| C | 9 | 68 | 88720 | 1123.57 | 332 | 332 | 78.7 |
| C | 8 | 229 | 29050 | 365.06 | 332 | 332 | 78.7 |
| C | 13 | 61 | 2569 | 28.44 | 332 | 332 | 78.7 |
| D | 13 | 137 | 77292 | 943.37 | 327 | 316 | 81.6 |
| D | 14 | 34 | 19464 | 234.67 | 327 | 316 | 81.6 |
| D | 2 | 216 | 17416 | 209.57 | 327 | 316 | 81.6 |
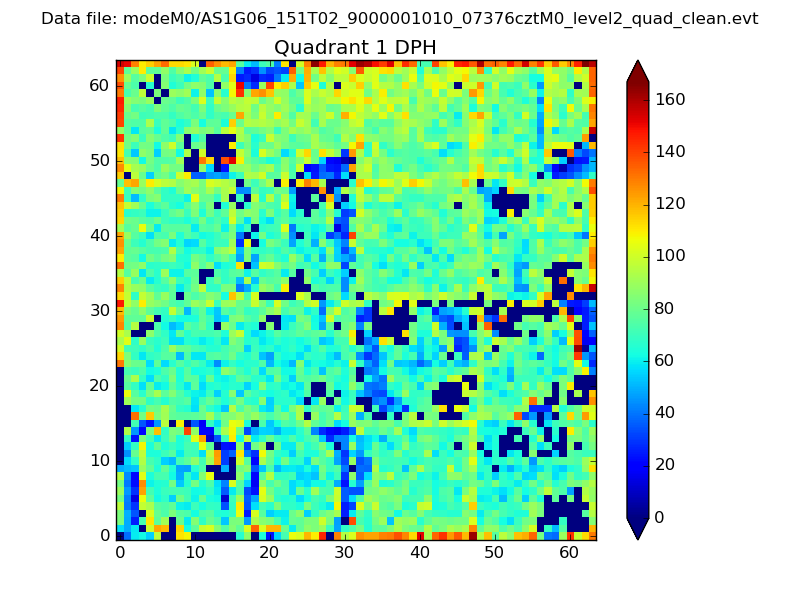
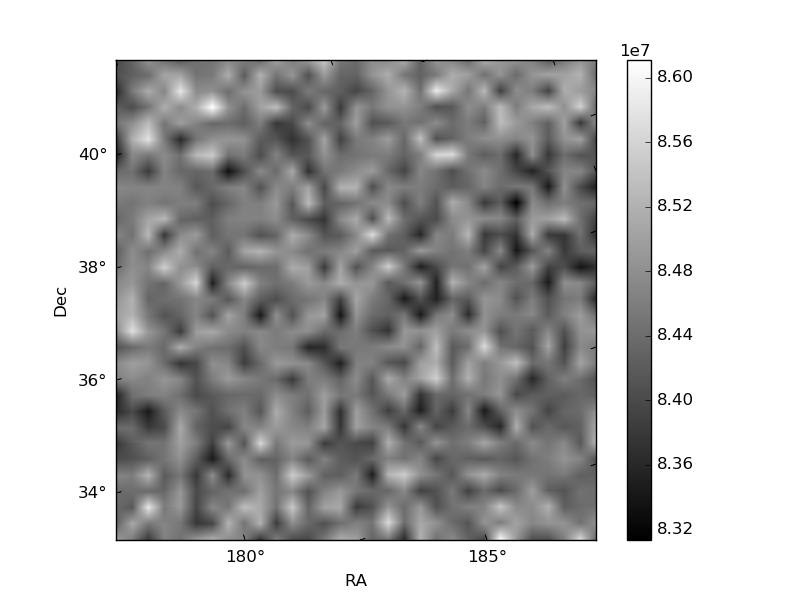
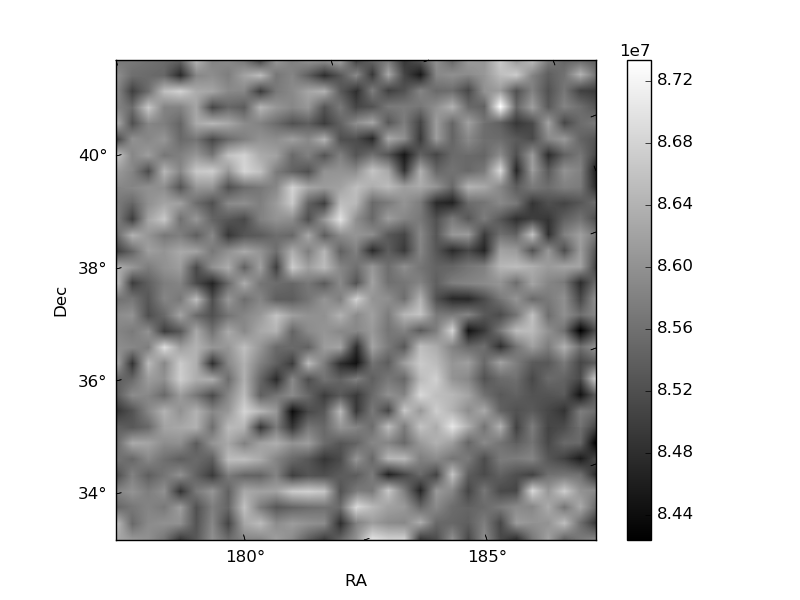
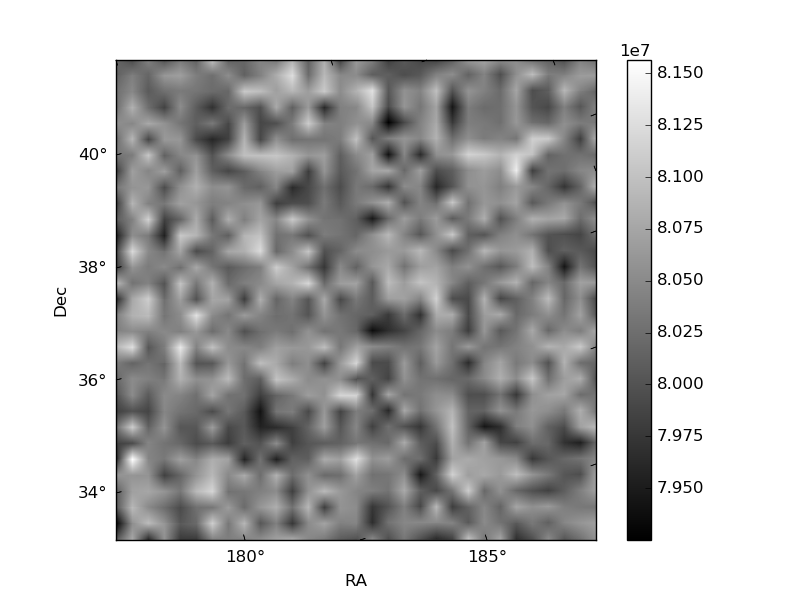
Histogram calculated using DETX and DETY for each event in the final _common_clean file
| Quadrant A |  |
 |
Quadrant B |
|---|---|---|---|
| Quadrant D |  |
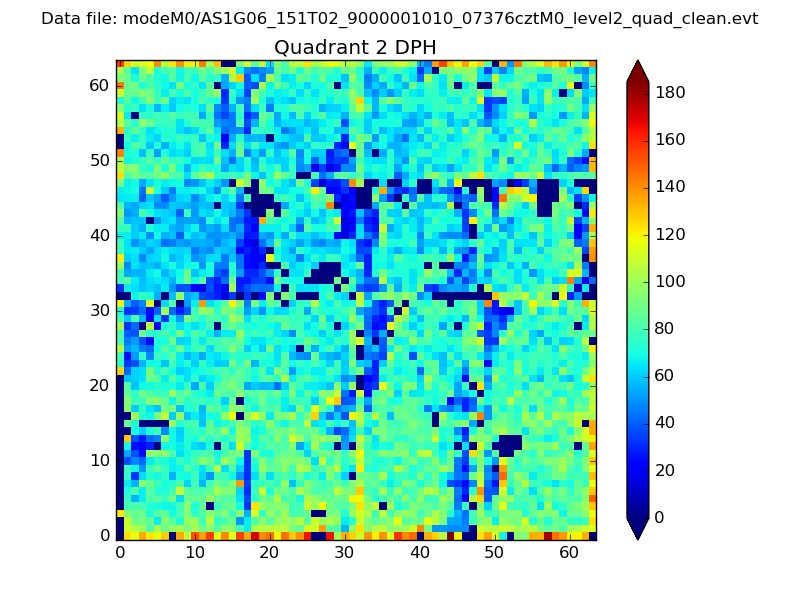 |
Quadrant C |
| Plot type | Count rate plots | Images |
|---|---|---|
| Comparison with Poisson distribution Blue bars denote a histogram of data divided into 1 sec bins. Red curve is a Poisson curve with rate = median count rate of data. |
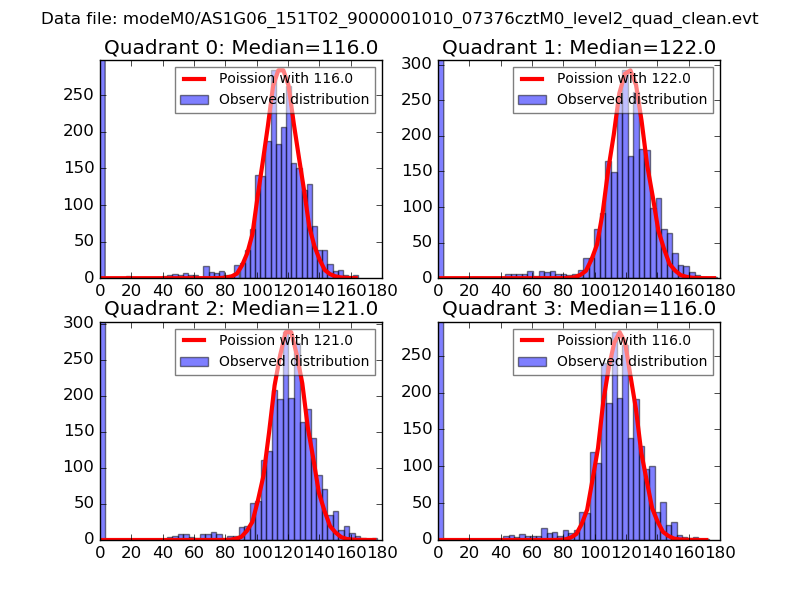 |
 |
| Quadrant-wise count rates Data is divided into 100 sec bins |
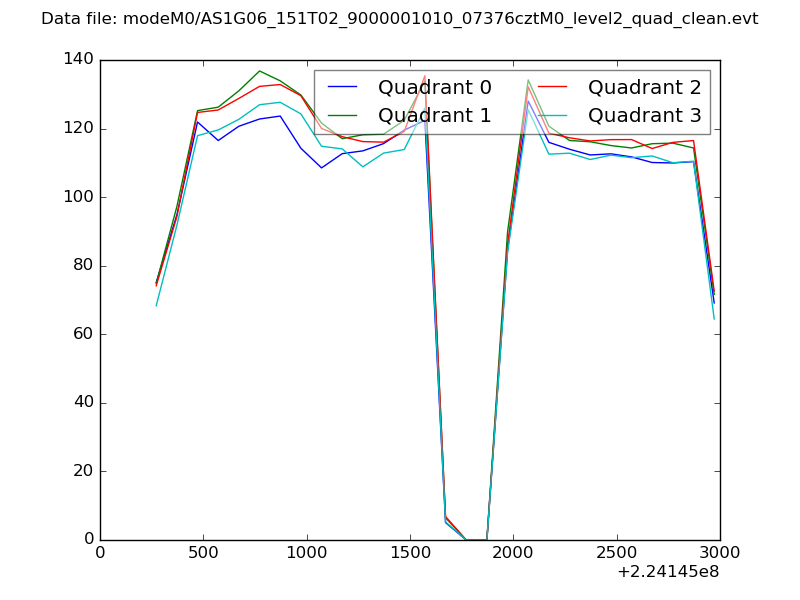 |
|
| Module-wise count rates for Quadrant A Data is divided into 100 sec bins |
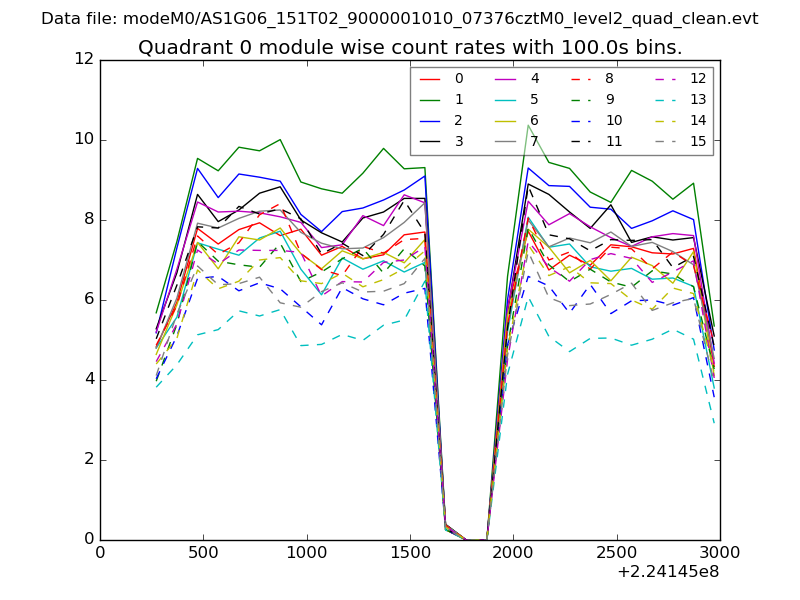 |
 |
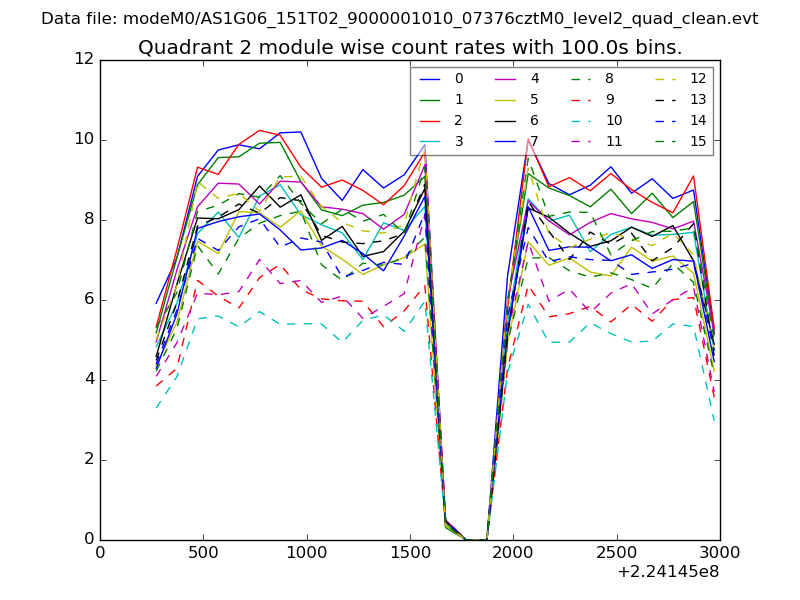
| Module-wise count rates for Quadrant B Data is divided into 100 sec bins |
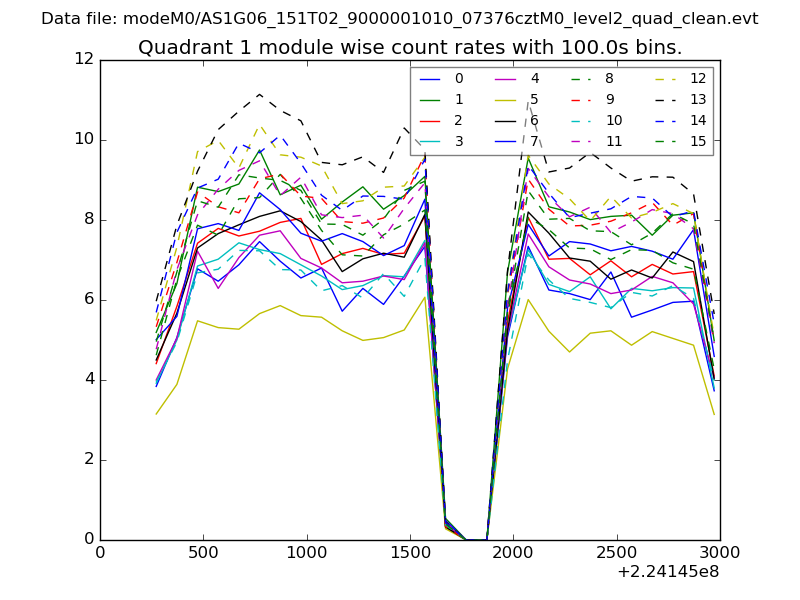 |
 |
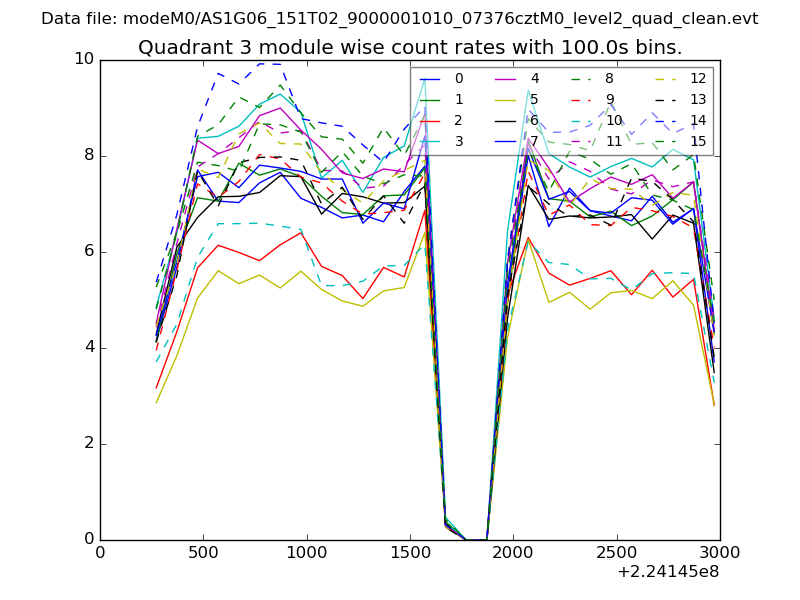
| Module-wise count rates for Quadrant C Data is divided into 100 sec bins |
 |
 |
| Module-wise count rates for Quadrant D Data is divided into 100 sec bins |
 |
 |
| Parameter | Plot |
|---|---|
| CZT HV Monitor | 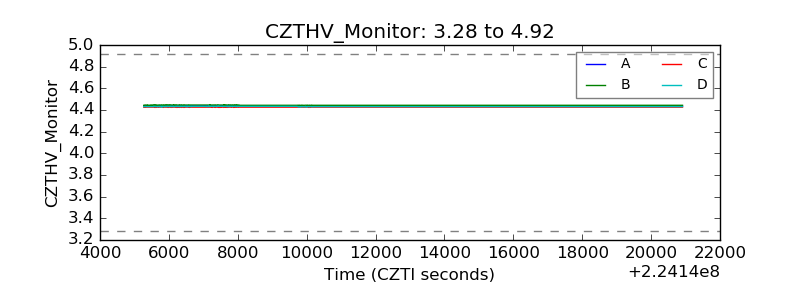 |
| D_VDD | 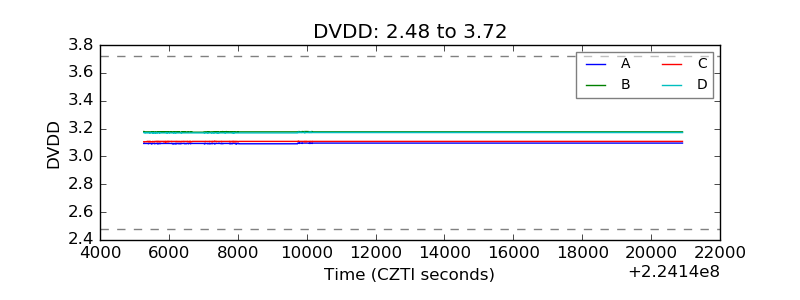 |
| Temperature 1 | 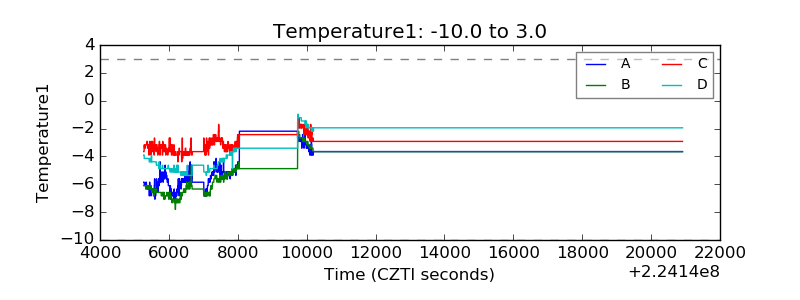 |
| Veto HV Monitor | 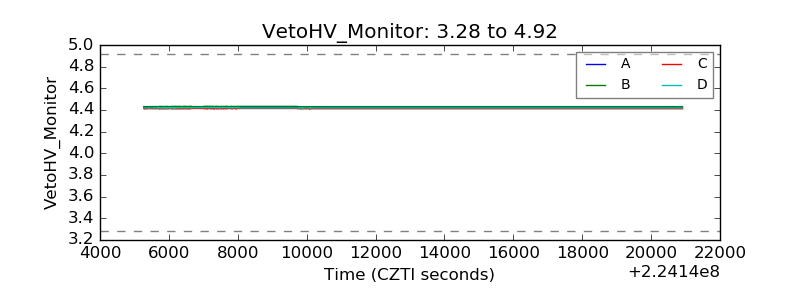 |
| Veto LLD | 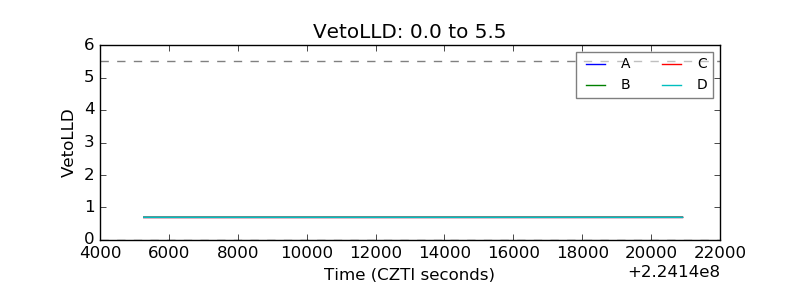 |
| Alpha Counter | 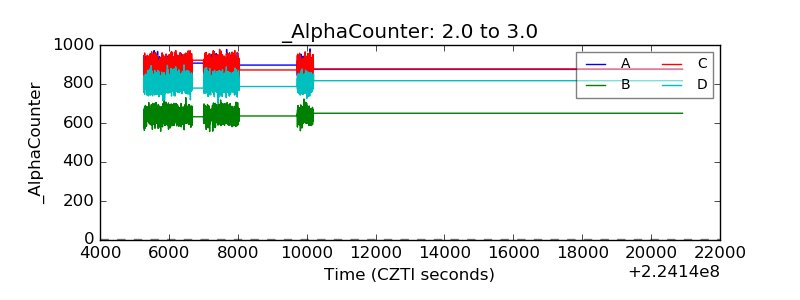 |
| _CPM_Rate | 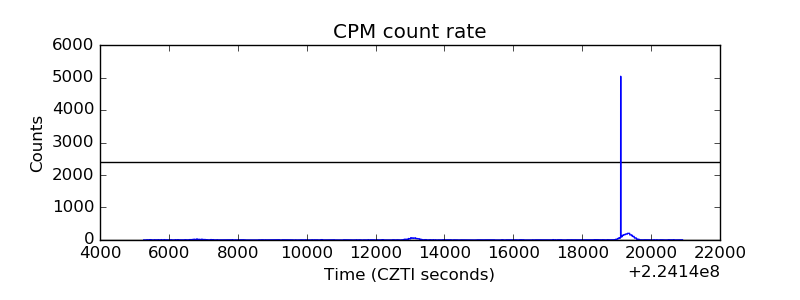 |
| CZT Counter | 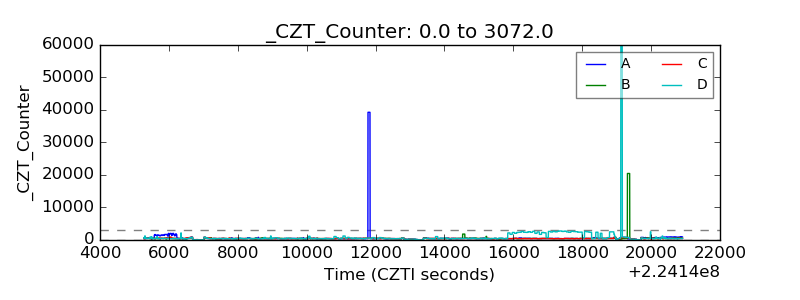 |
| +2.5 Volts monitor |  |
| +5 Volts monitor |  |
| _ROLL_ROT | 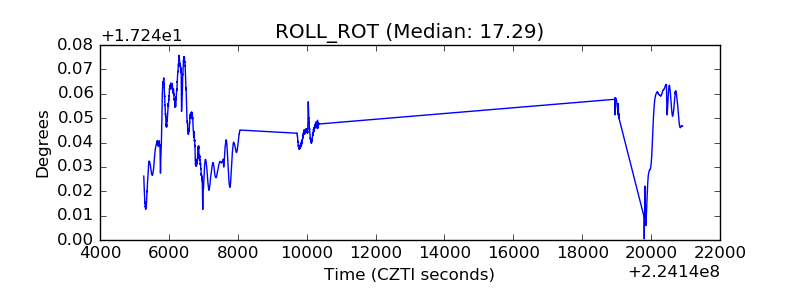 |
| _Roll_DEC | 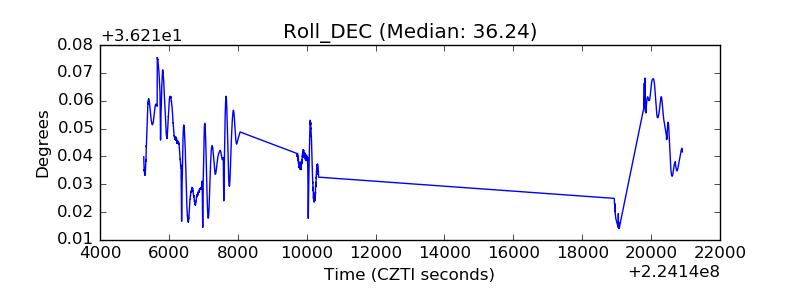 |
| _Roll_RA | 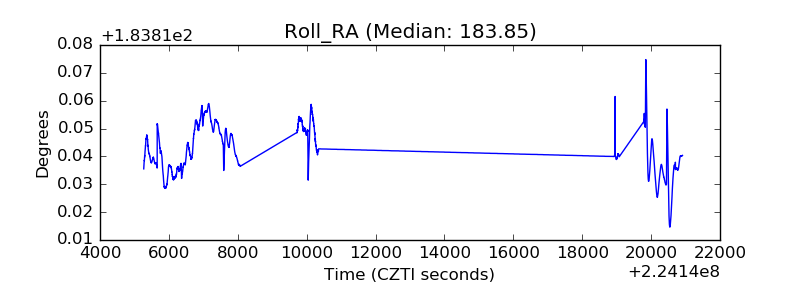 |
| Veto Counter | 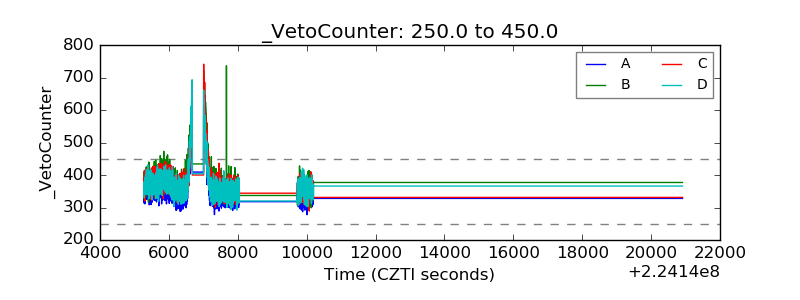 |