| Param | Original file | Final file |
|---|---|---|
| Filename | modeM0/AS1G06_117T01_9000001012_07380cztM0_level2.evt | modeM0/AS1G06_117T01_9000001012_07380cztM0_level2_quad_clean.evt |
| Size (bytes) | 443,468,160 | 90,483,840 |
| Size | 422.9 MB | 86.3 MB |
| Events in quadrant A | 3,150,419 | 569,797 |
| Events in quadrant B | 3,208,188 | 586,126 |
| Events in quadrant C | 3,158,719 | 582,571 |
| Events in quadrant D | 3,478,229 | 555,286 |
| Mode M9 | |||
|---|---|---|---|
| Quadrant | BADHDUFLAG | Total packets | Discarded packets |
| A | 0 | 25 | 0 |
| B | 0 | 25 | 0 |
| C | 0 | 25 | 0 |
| D | 0 | 25 | 0 |
| Mode M0 | |||
|---|---|---|---|
| Quadrant | BADHDUFLAG | Total packets | Discarded packets |
| A | 0 | 13650 | 3 |
| B | 0 | 13775 | 2 |
| C | 0 | 13695 | 2 |
| D | 0 | 14739 | 2 |
| Mode SS | |||
|---|---|---|---|
| Quadrant | BADHDUFLAG | Total packets | Discarded packets |
| A | 0 | 132 | 0 |
| B | 0 | 132 | 0 |
| C | 0 | 132 | 0 |
| D | 0 | 132 | 0 |
| Quadrant | Total seconds | Saturated seconds | Saturation percentage |
|---|---|---|---|
| A | 6397 | 68 | 1.062998% |
| B | 6397 | 78 | 1.219322% |
| C | 6397 | 66 | 1.031734% |
| D | 6397 | 175 | 2.735657% |
Noise dominated data is calculated using 1-second bins in cleaned event files. If a bin has >2000 counts, and if more than 50% of those come from <1% of pixels, then it is considered to be noise-dominated and hence unusable.
| Quadrant | # 1 sec bins | Bins with >0 counts | Bins with >2000 counts | High rate bins dominated by noise | Noise dominated (total time) | Noise dominated (detector-on time) | Marked lightcurve |
|---|---|---|---|---|---|---|---|
| A | 8852 | 6399 | 0 | 0 | 0.00% | 0.00% | 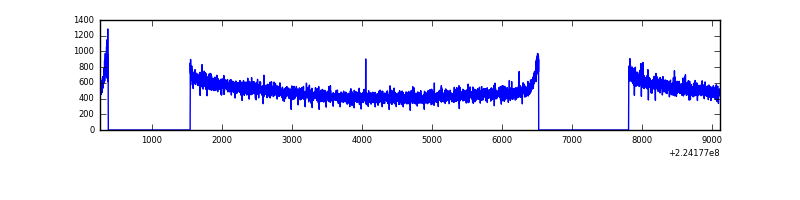 |
| B | 8852 | 6399 | 0 | 0 | 0.00% | 0.00% | 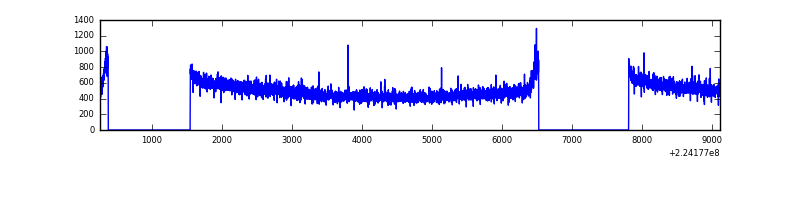 |
| C | 8852 | 6398 | 0 | 0 | 0.00% | 0.00% | 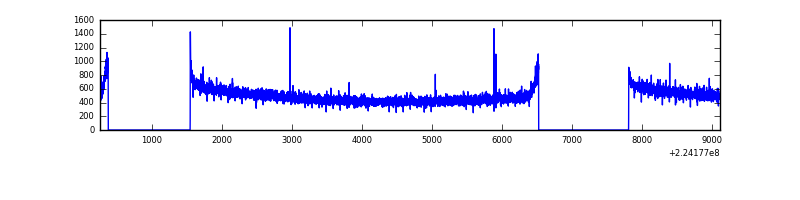 |
| D | 8852 | 6399 | 50 | 50 | 0.56% | 0.78% | 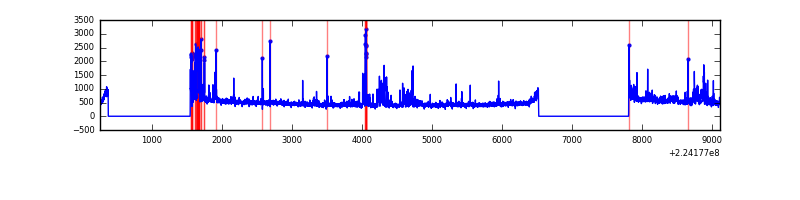 |
Top three noisy pixels from each quadrant. If the there are fewer than three noisy pixels in the level2.evt file, extra rows are filled as -1
| Pixel properties | Quadrant properties | ||||||
|---|---|---|---|---|---|---|---|
| Quadrant | DetID | PixID | Counts | Sigma | Mean | Median | Sigma |
| A | 13 | 14 | 20824 | 122.46 | 809 | 791 | 163.6 |
| A | 15 | 239 | 12828 | 73.58 | 809 | 791 | 163.6 |
| A | 0 | 226 | 7747 | 42.52 | 809 | 791 | 163.6 |
| B | 0 | 214 | 17176 | 105.33 | 823 | 805 | 155.4 |
| B | 12 | 111 | 15413 | 93.98 | 823 | 805 | 155.4 |
| B | 11 | 111 | 12512 | 75.32 | 823 | 805 | 155.4 |
| C | 1 | 16 | 14472 | 73.64 | 805 | 811 | 185.5 |
| C | 13 | 61 | 6339 | 29.8 | 805 | 811 | 185.5 |
| C | 12 | 4 | 2668 | 10.01 | 805 | 811 | 185.5 |
| D | 13 | 137 | 212073 | 1088.69 | 792 | 771 | 194.1 |
| D | 2 | 216 | 169581 | 869.76 | 792 | 771 | 194.1 |
| D | 14 | 34 | 43956 | 222.5 | 792 | 771 | 194.1 |
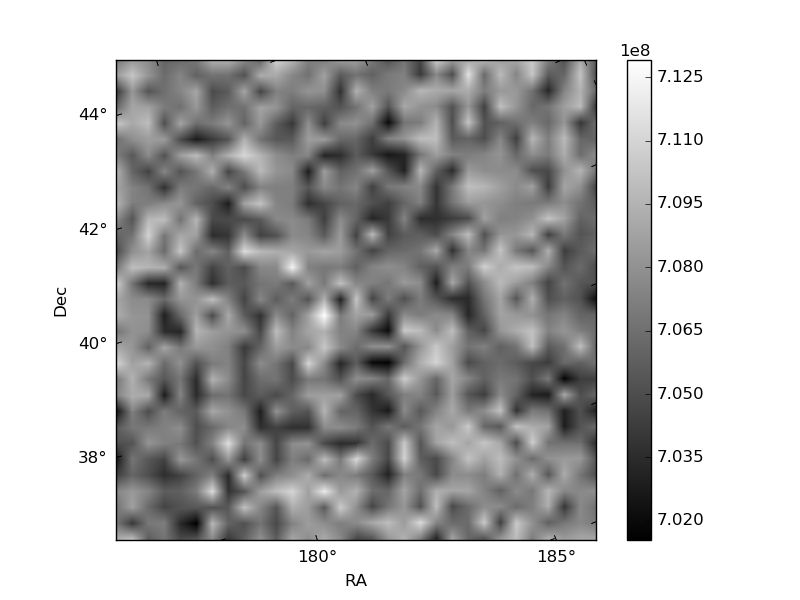
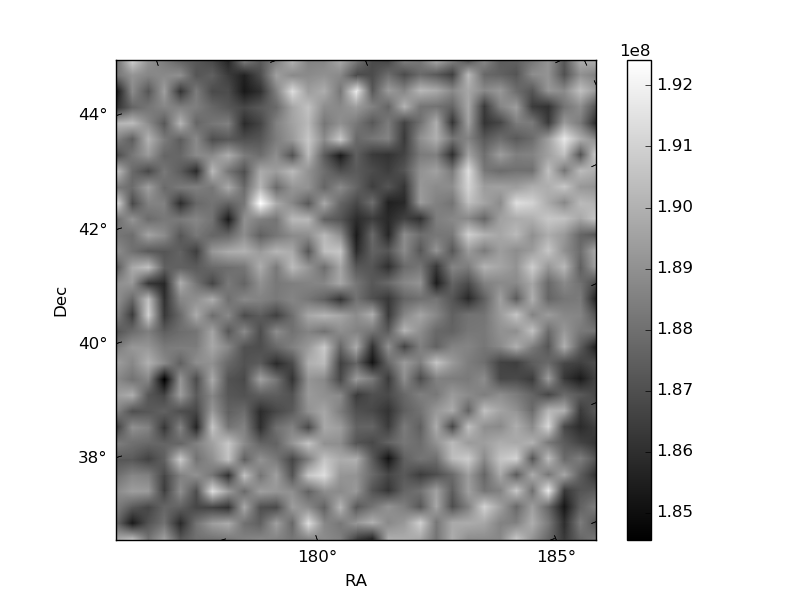
Histogram calculated using DETX and DETY for each event in the final _common_clean file
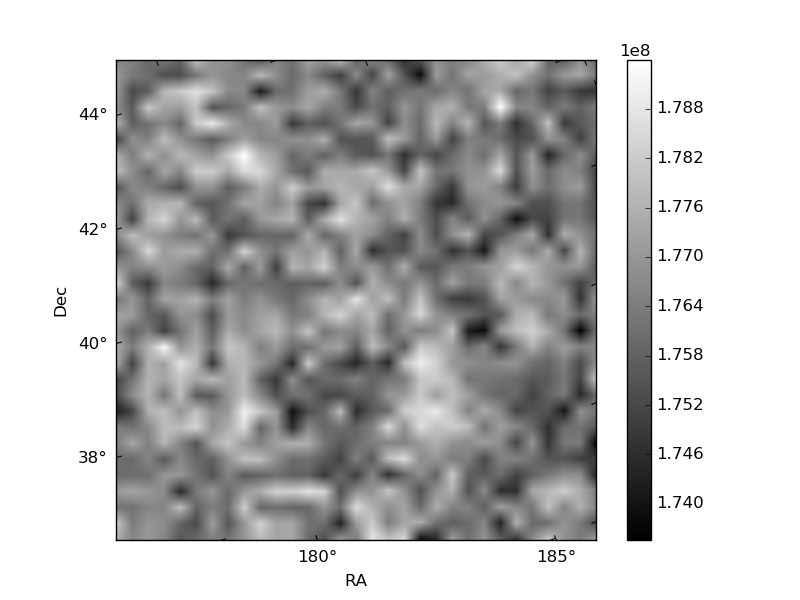
| Quadrant A | 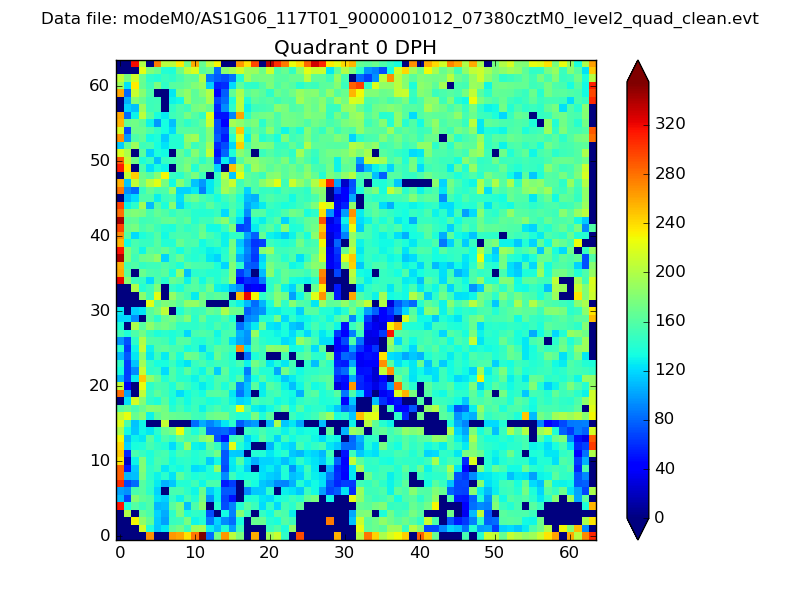 |
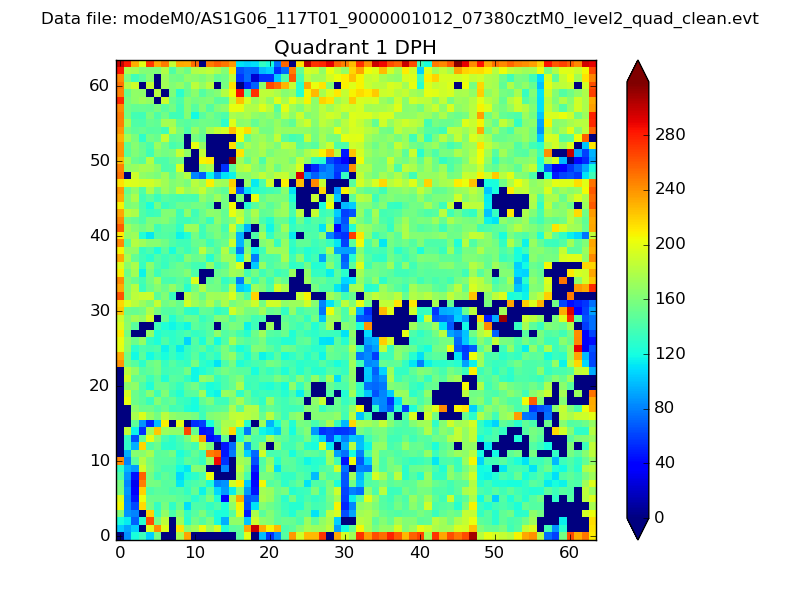 |
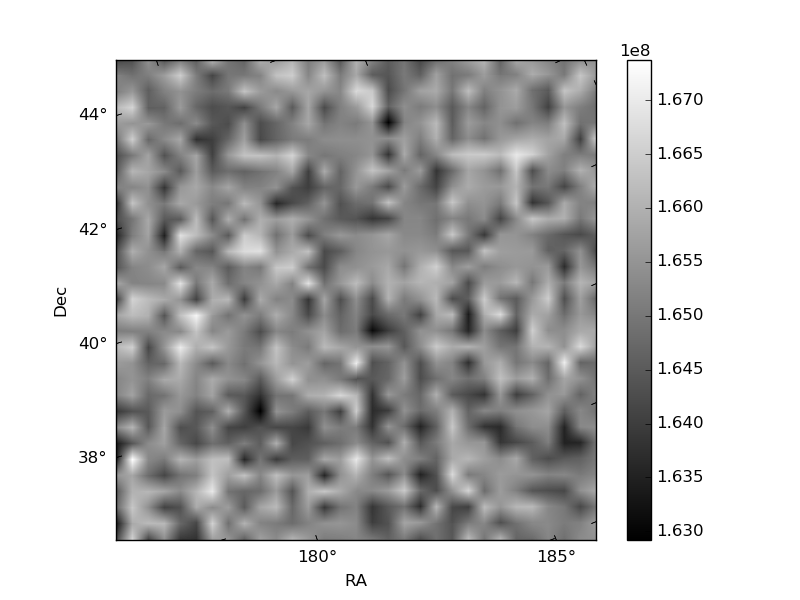
Quadrant B |
|---|---|---|---|
| Quadrant D | 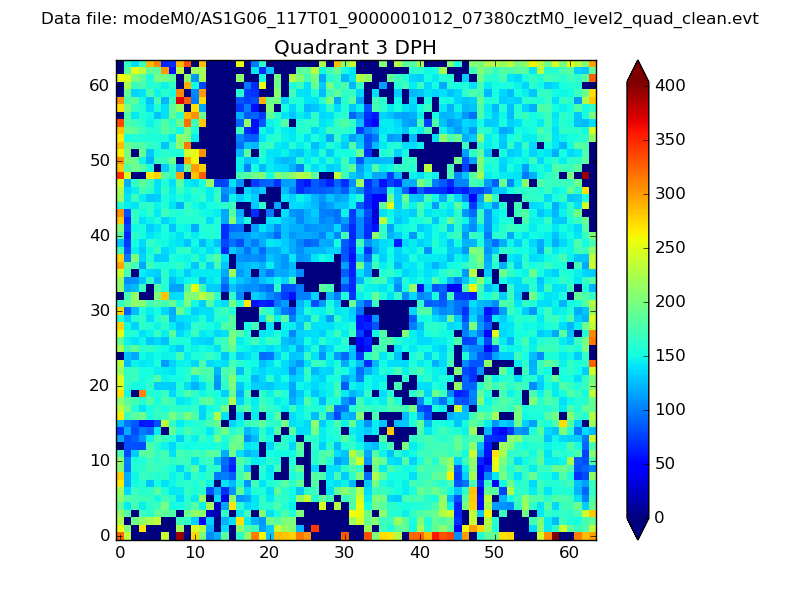 |
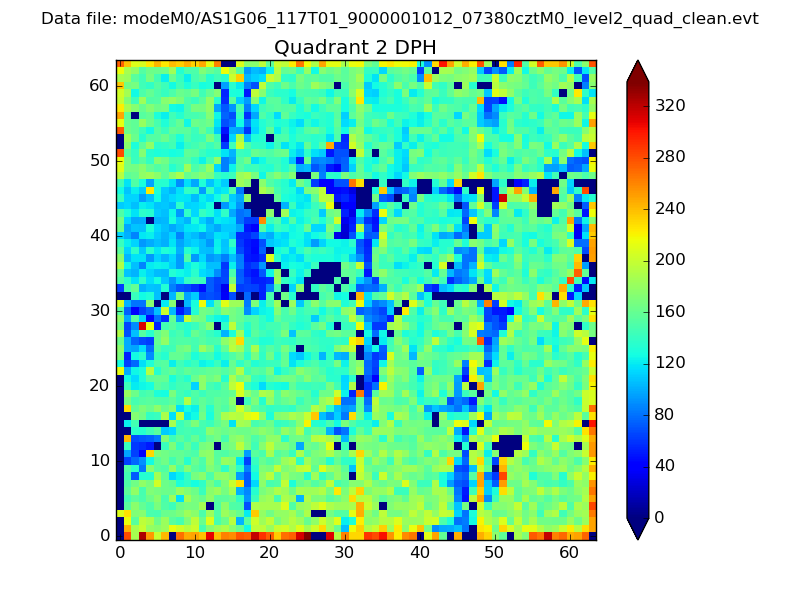 |
Quadrant C |
| Plot type | Count rate plots | Images |
|---|---|---|
| Comparison with Poisson distribution Blue bars denote a histogram of data divided into 1 sec bins. Red curve is a Poisson curve with rate = median count rate of data. |
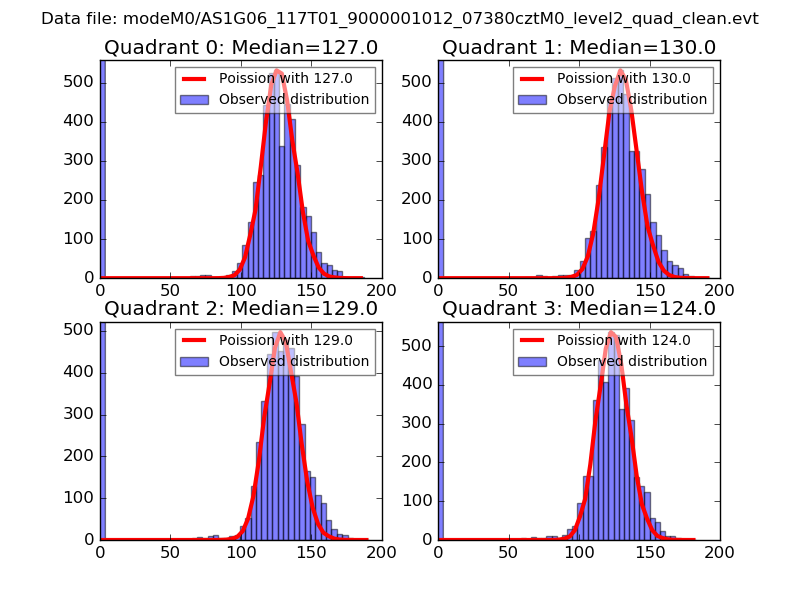 |
 |
| Quadrant-wise count rates Data is divided into 100 sec bins |
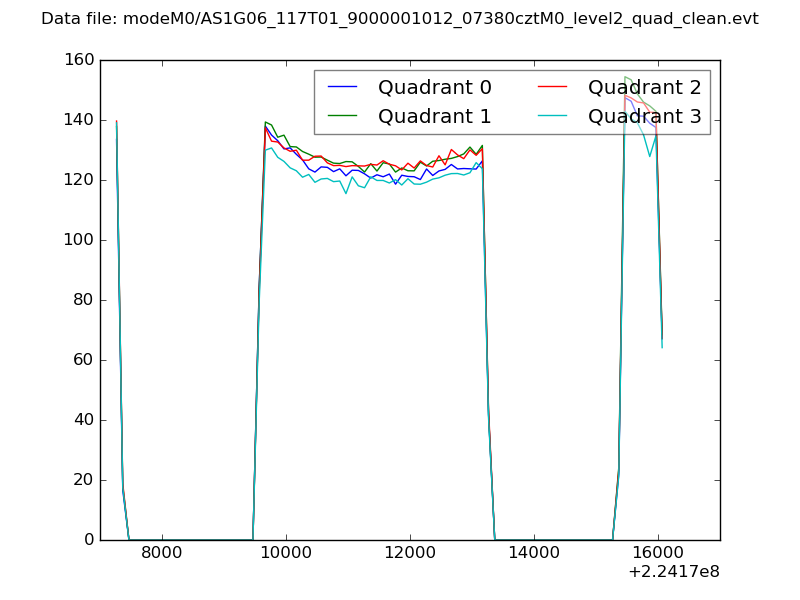 |
|
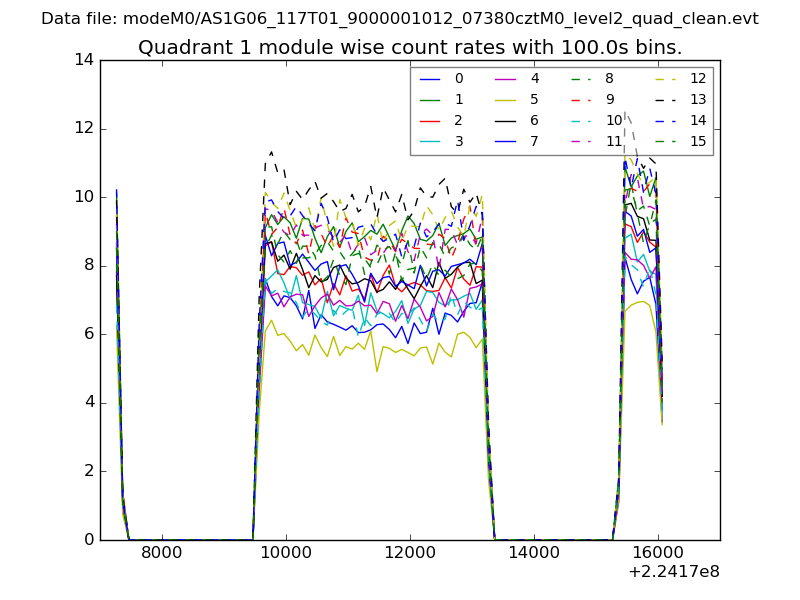
| Module-wise count rates for Quadrant A Data is divided into 100 sec bins |
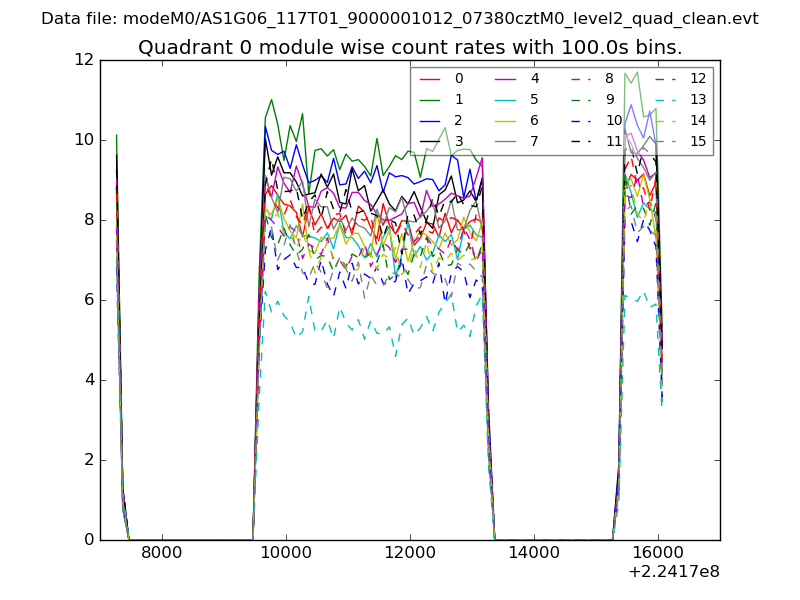 |
 |
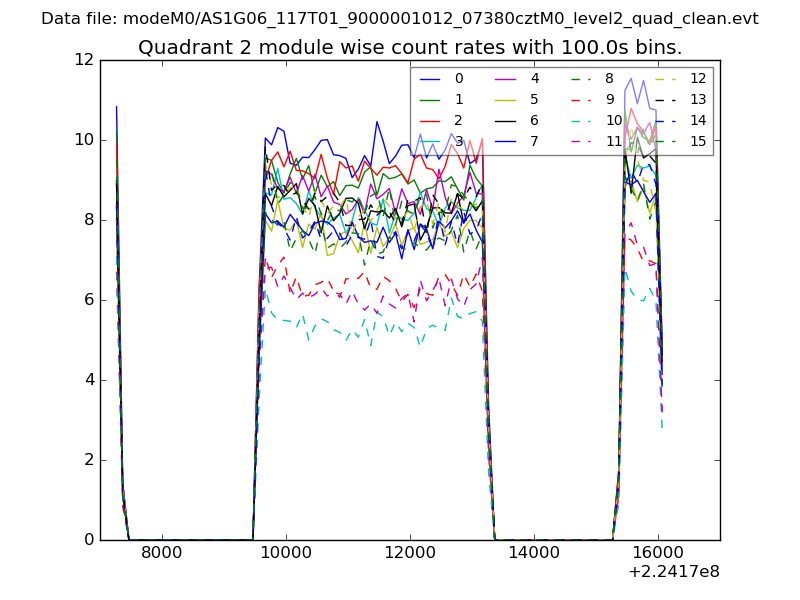
| Module-wise count rates for Quadrant B Data is divided into 100 sec bins |
 |
 |
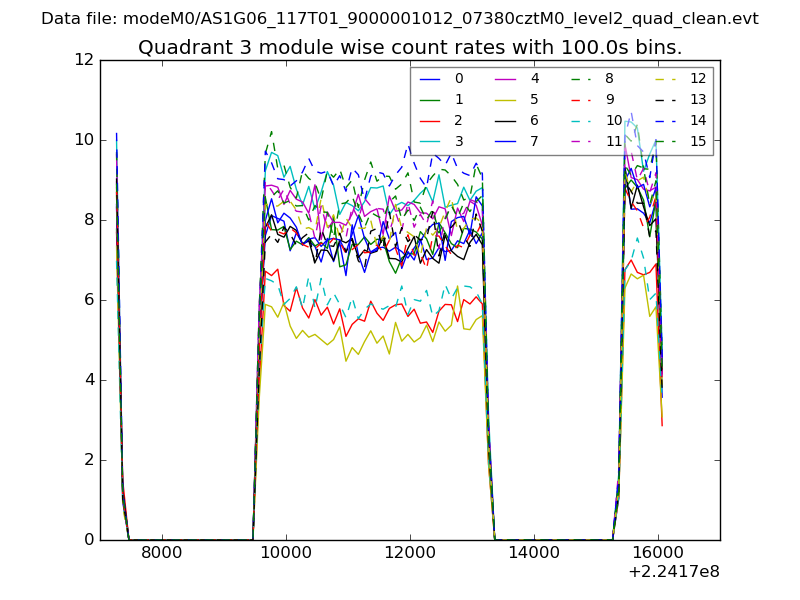
| Module-wise count rates for Quadrant C Data is divided into 100 sec bins |
 |
 |
| Module-wise count rates for Quadrant D Data is divided into 100 sec bins |
 |
 |
| Parameter | Plot |
|---|---|
| CZT HV Monitor |  |
| D_VDD | 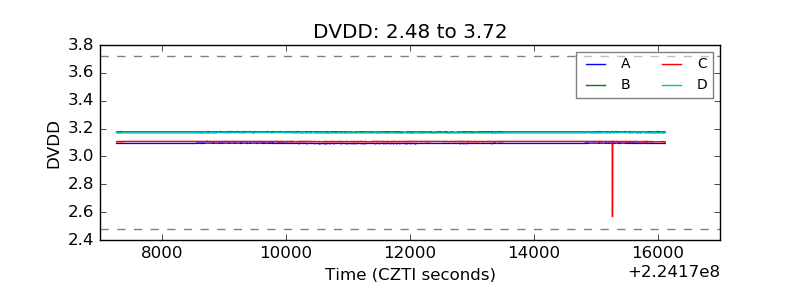 |
| Temperature 1 | 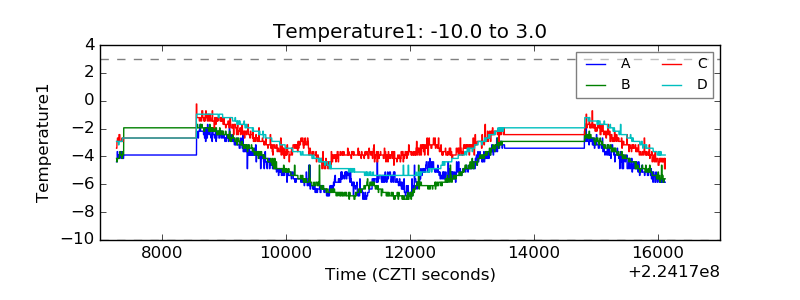 |
| Veto HV Monitor | 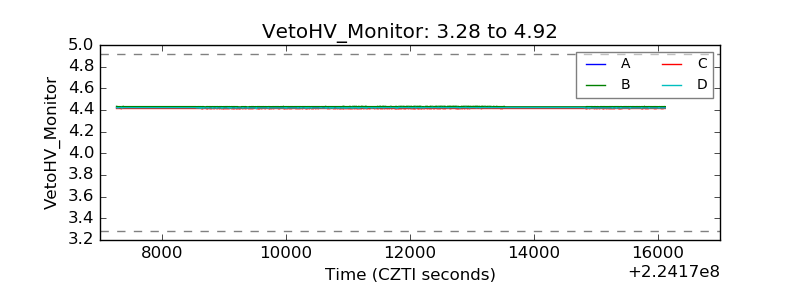 |
| Veto LLD | 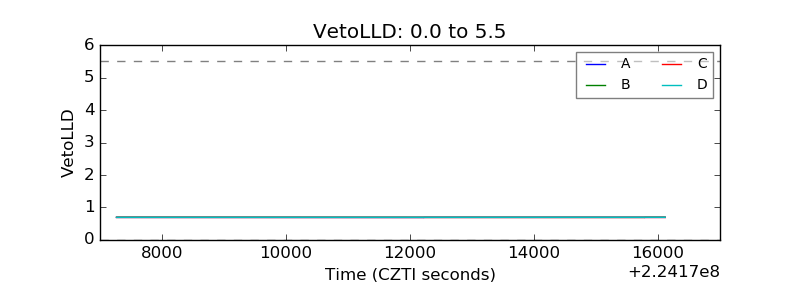 |
| Alpha Counter | 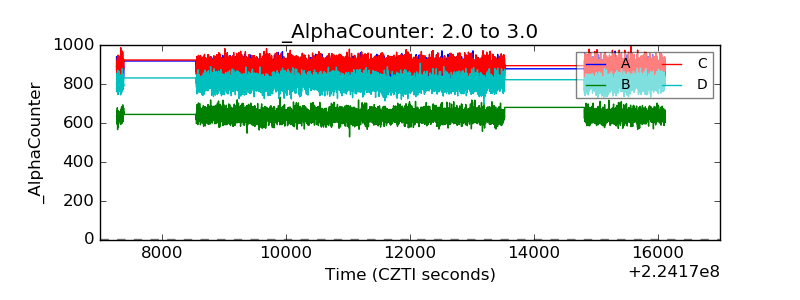 |
| _CPM_Rate | 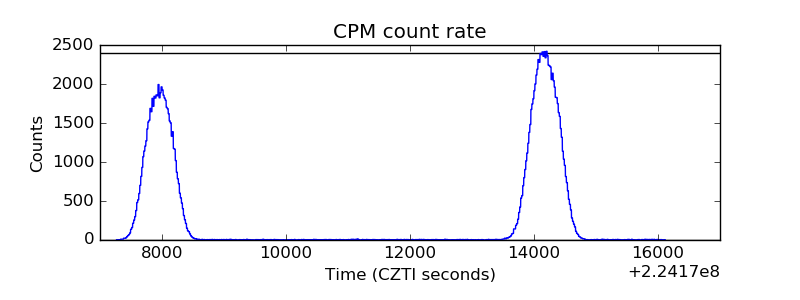 |
| CZT Counter | 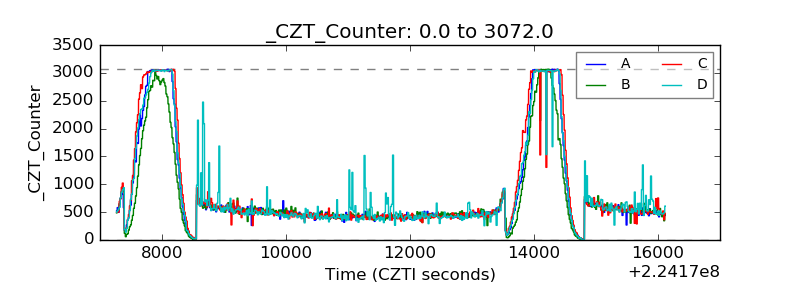 |
| +2.5 Volts monitor |  |
| +5 Volts monitor |  |
| _ROLL_ROT | 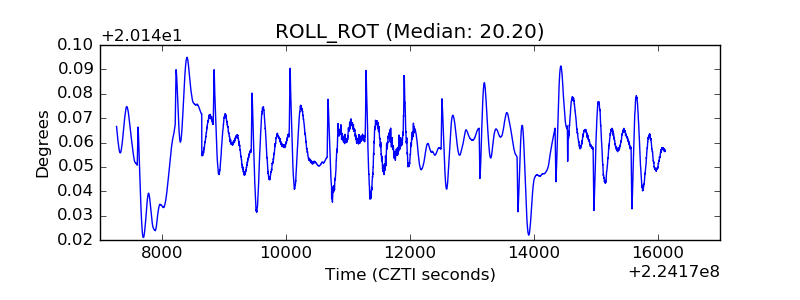 |
| _Roll_DEC | 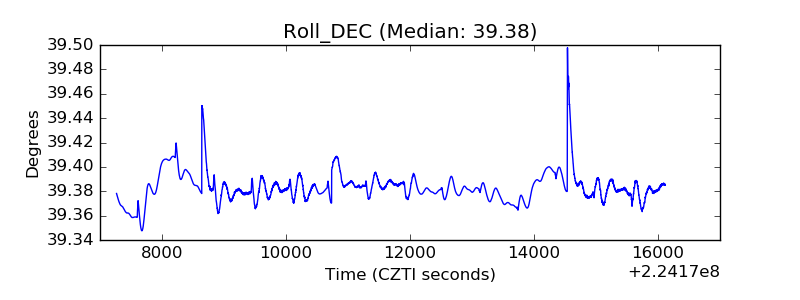 |
| _Roll_RA | 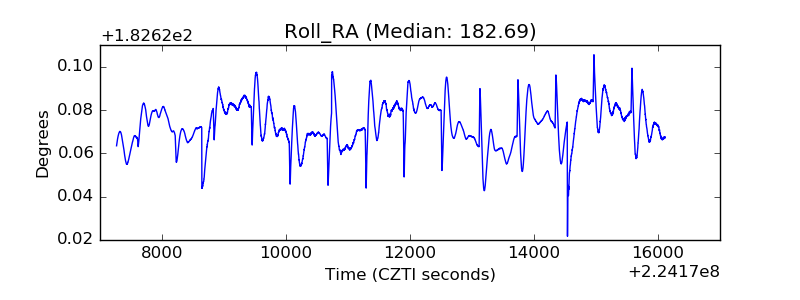 |
| Veto Counter | 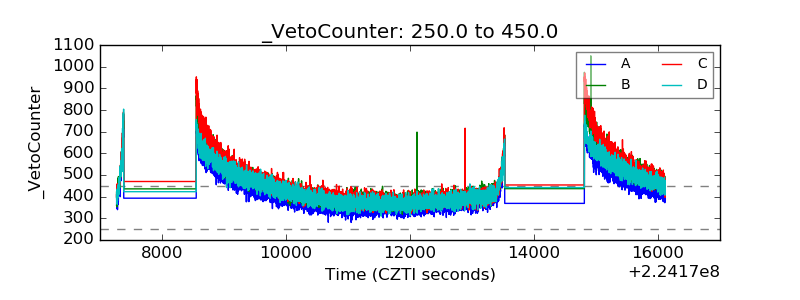 |