| Param | Original file | Final file |
|---|---|---|
| Filename | modeM0/AS1G06_117T01_9000001012_07381cztM0_level2.evt | modeM0/AS1G06_117T01_9000001012_07381cztM0_level2_quad_clean.evt |
| Size (bytes) | 497,808,000 | 103,322,880 |
| Size | 474.7 MB | 98.5 MB |
| Events in quadrant A | 3,755,508 | 649,881 |
| Events in quadrant B | 3,431,697 | 685,478 |
| Events in quadrant C | 3,329,278 | 684,219 |
| Events in quadrant D | 4,102,828 | 640,327 |
| Mode M9 | |||
|---|---|---|---|
| Quadrant | BADHDUFLAG | Total packets | Discarded packets |
| A | 0 | 26 | 0 |
| B | 0 | 26 | 0 |
| C | 0 | 26 | 0 |
| D | 0 | 26 | 0 |
| Mode M0 | |||
|---|---|---|---|
| Quadrant | BADHDUFLAG | Total packets | Discarded packets |
| A | 0 | 15671 | 3 |
| B | 0 | 14561 | 2 |
| C | 0 | 14312 | 2 |
| D | 0 | 16965 | 2 |
| Mode SS | |||
|---|---|---|---|
| Quadrant | BADHDUFLAG | Total packets | Discarded packets |
| A | 0 | 138 | 0 |
| B | 0 | 138 | 0 |
| C | 0 | 138 | 0 |
| D | 0 | 138 | 0 |
| Quadrant | Total seconds | Saturated seconds | Saturation percentage |
|---|---|---|---|
| A | 6733 | 248 | 3.683351% |
| B | 6733 | 93 | 1.381256% |
| C | 6733 | 74 | 1.099064% |
| D | 6733 | 216 | 3.208080% |
Noise dominated data is calculated using 1-second bins in cleaned event files. If a bin has >2000 counts, and if more than 50% of those come from <1% of pixels, then it is considered to be noise-dominated and hence unusable.
| Quadrant | # 1 sec bins | Bins with >0 counts | Bins with >2000 counts | High rate bins dominated by noise | Noise dominated (total time) | Noise dominated (detector-on time) | Marked lightcurve |
|---|---|---|---|---|---|---|---|
| A | 9338 | 6735 | 131 | 131 | 1.40% | 1.95% | 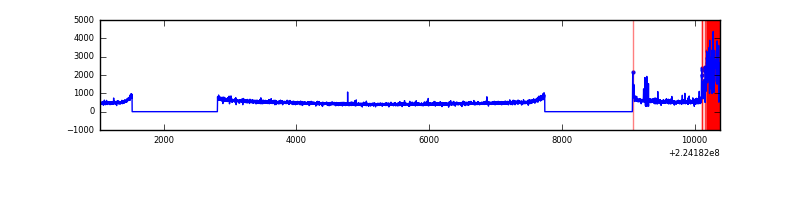 |
| B | 9338 | 6734 | 1 | 1 | 0.01% | 0.01% | 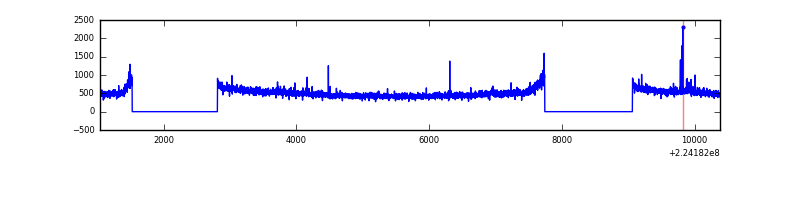 |
| C | 9338 | 6735 | 0 | 0 | 0.00% | 0.00% | 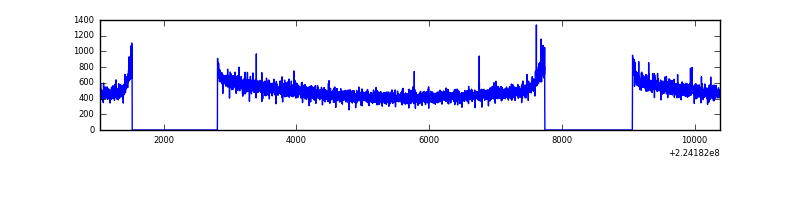 |
| D | 9338 | 6735 | 97 | 97 | 1.04% | 1.44% | 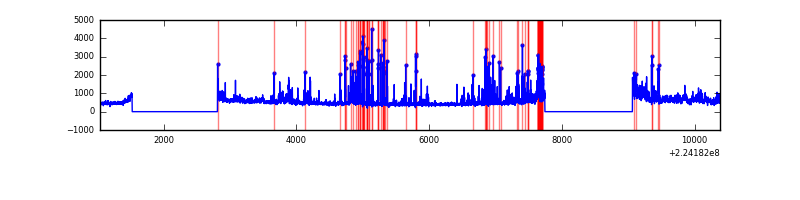 |
Top three noisy pixels from each quadrant. If the there are fewer than three noisy pixels in the level2.evt file, extra rows are filled as -1
| Pixel properties | Quadrant properties | ||||||
|---|---|---|---|---|---|---|---|
| Quadrant | DetID | PixID | Counts | Sigma | Mean | Median | Sigma |
| A | 15 | 239 | 464463 | 2729.66 | 841 | 824 | 169.9 |
| A | 14 | 111 | 46527 | 269.08 | 841 | 824 | 169.9 |
| A | 13 | 14 | 9555 | 51.4 | 841 | 824 | 169.9 |
| B | 0 | 214 | 42714 | 255.2 | 867 | 849 | 164.0 |
| B | 12 | 111 | 16388 | 94.72 | 867 | 849 | 164.0 |
| B | 11 | 111 | 13117 | 74.78 | 867 | 849 | 164.0 |
| C | 1 | 16 | 11162 | 52.71 | 850 | 854 | 195.6 |
| C | 13 | 61 | 6499 | 28.87 | 850 | 854 | 195.6 |
| C | 12 | 4 | 3150 | 11.74 | 850 | 854 | 195.6 |
| D | 13 | 137 | 413186 | 2013.45 | 832 | 808 | 204.8 |
| D | 13 | 105 | 325206 | 1583.88 | 832 | 808 | 204.8 |
| D | 2 | 14 | 69433 | 335.06 | 832 | 808 | 204.8 |
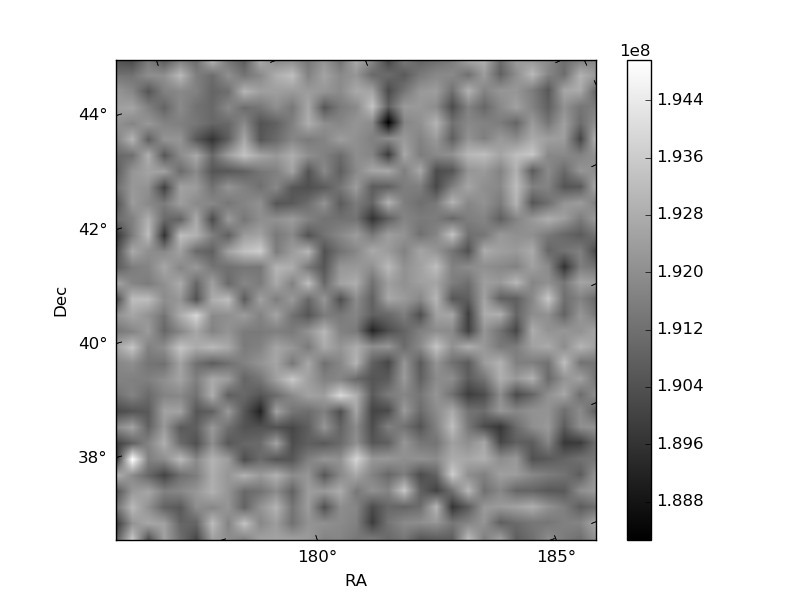
Histogram calculated using DETX and DETY for each event in the final _common_clean file
| Quadrant A | 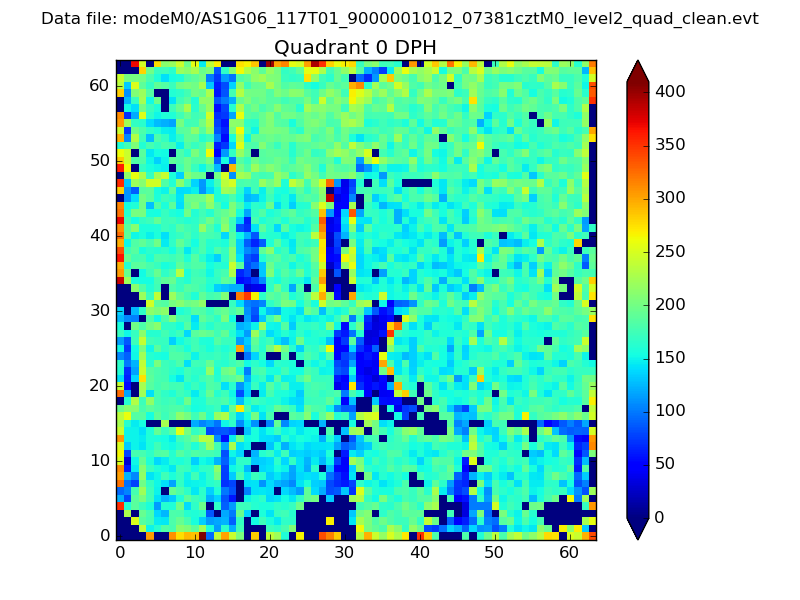 |
 |
Quadrant B |
|---|---|---|---|
| Quadrant D |  |
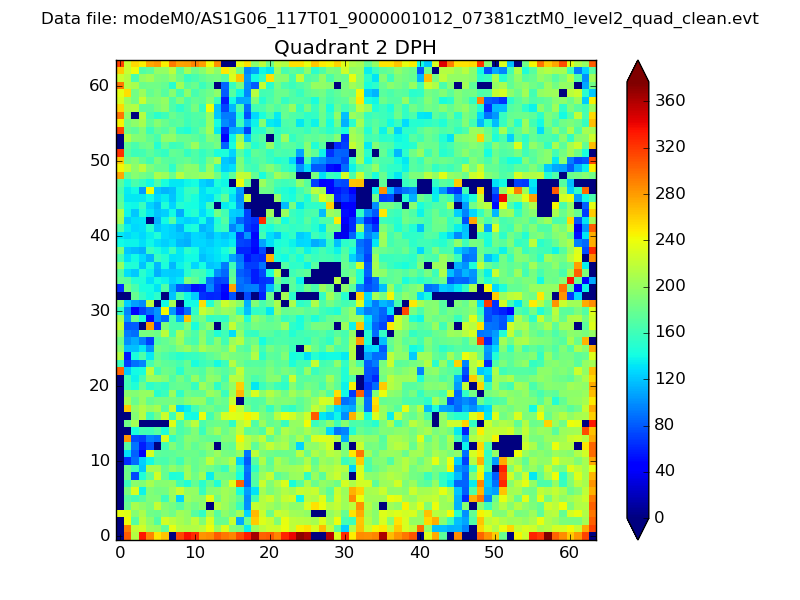 |
Quadrant C |
| Plot type | Count rate plots | Images |
|---|---|---|
| Comparison with Poisson distribution Blue bars denote a histogram of data divided into 1 sec bins. Red curve is a Poisson curve with rate = median count rate of data. |
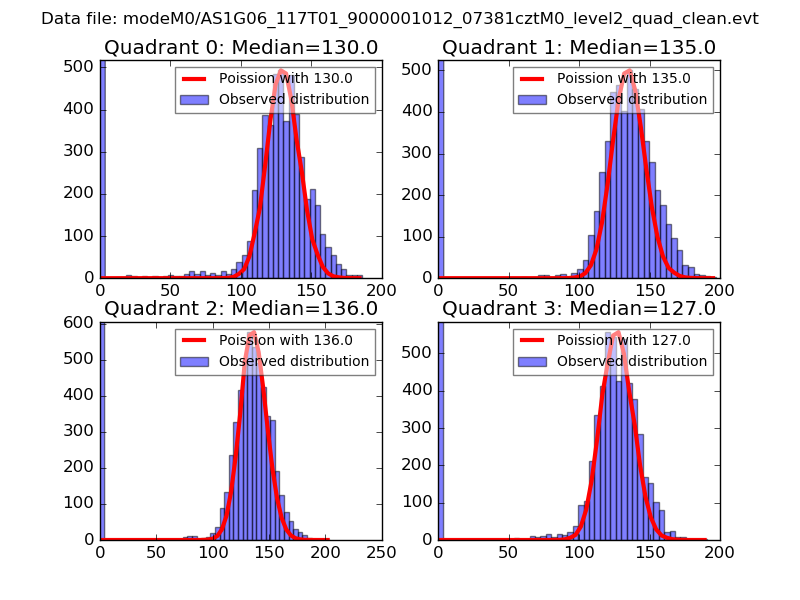 |
 |
| Quadrant-wise count rates Data is divided into 100 sec bins |
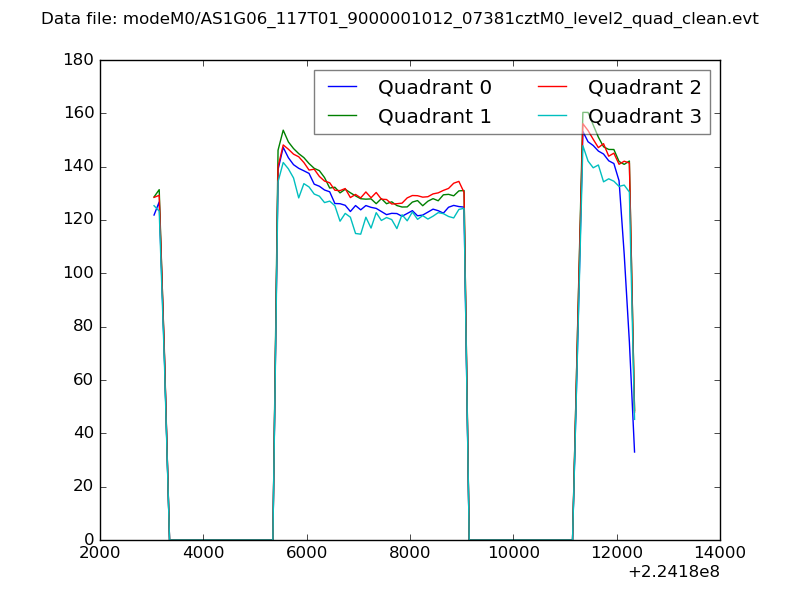 |
|
| Module-wise count rates for Quadrant A Data is divided into 100 sec bins |
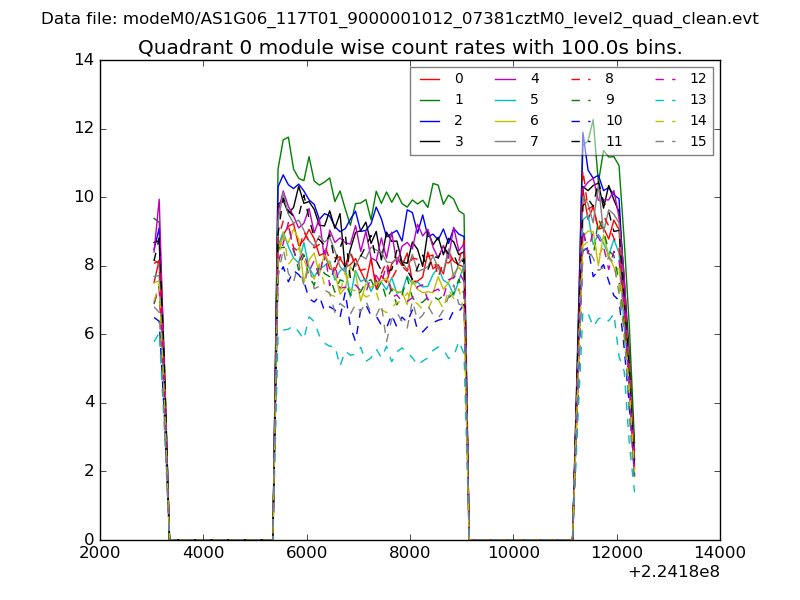 |
 |
| Module-wise count rates for Quadrant B Data is divided into 100 sec bins |
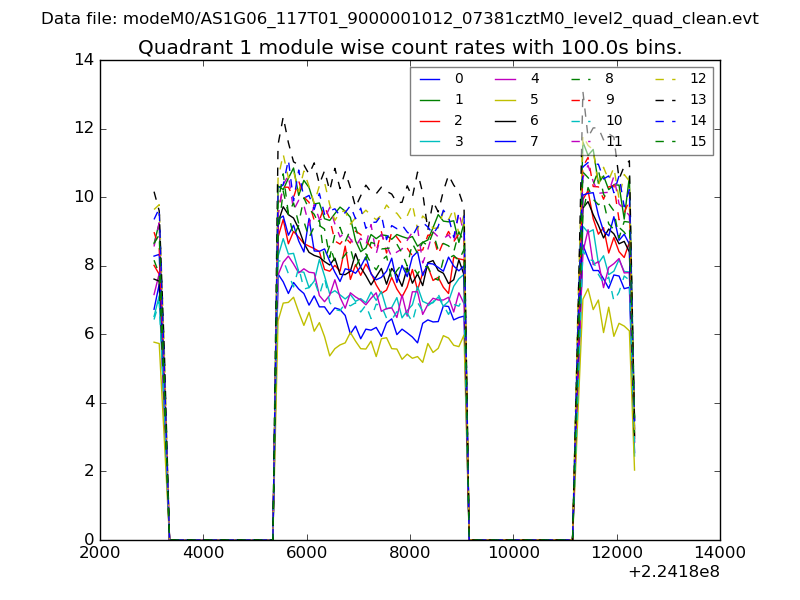 |
 |
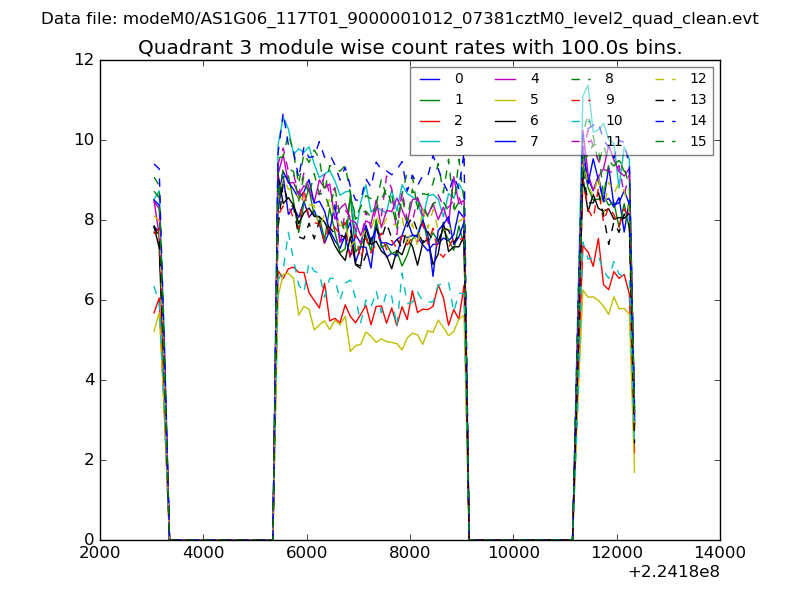
| Module-wise count rates for Quadrant C Data is divided into 100 sec bins |
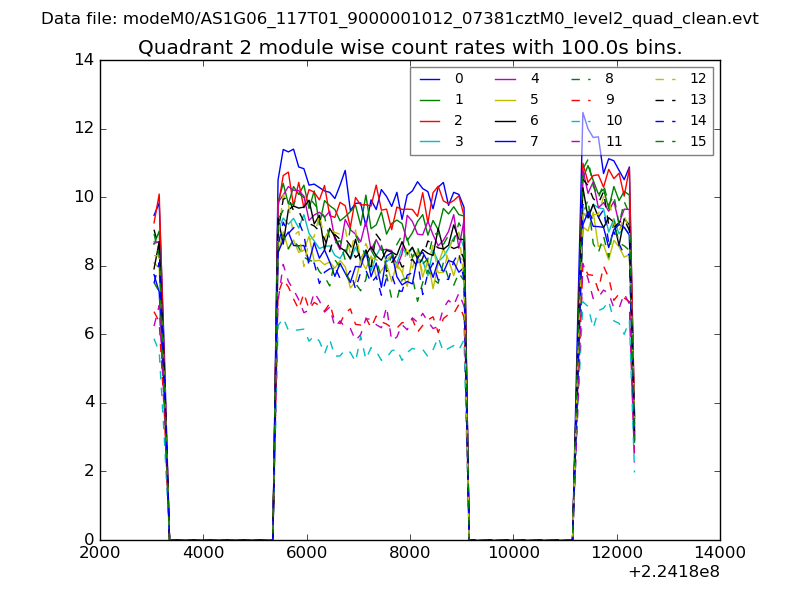 |
 |
| Module-wise count rates for Quadrant D Data is divided into 100 sec bins |
 |
 |
| Parameter | Plot |
|---|---|
| CZT HV Monitor | 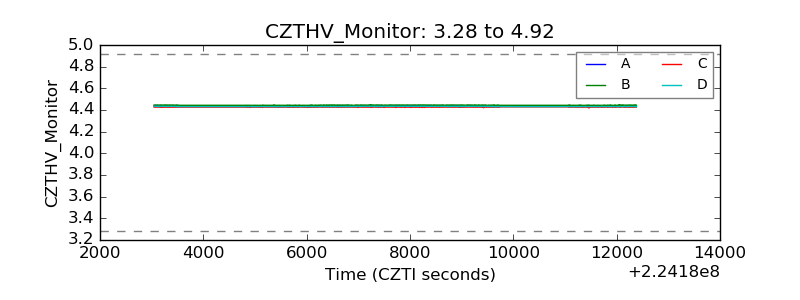 |
| D_VDD | 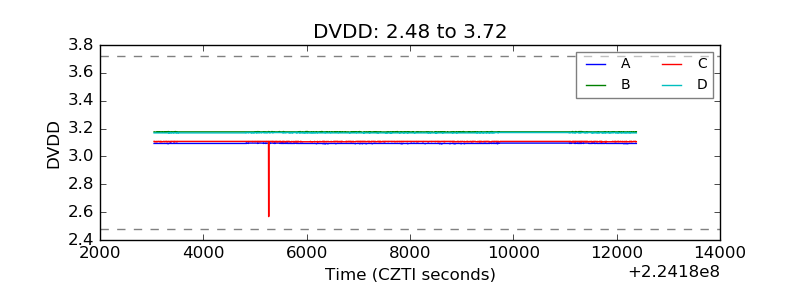 |
| Temperature 1 | 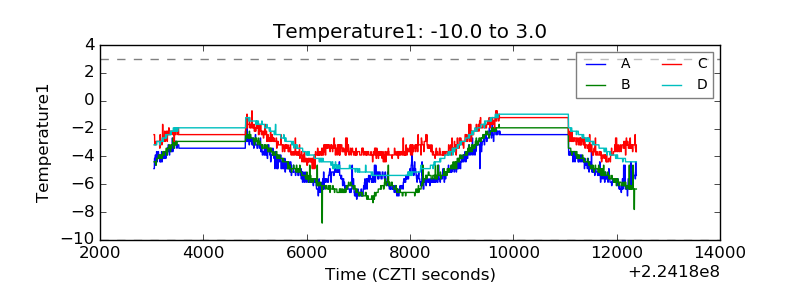 |
| Veto HV Monitor | 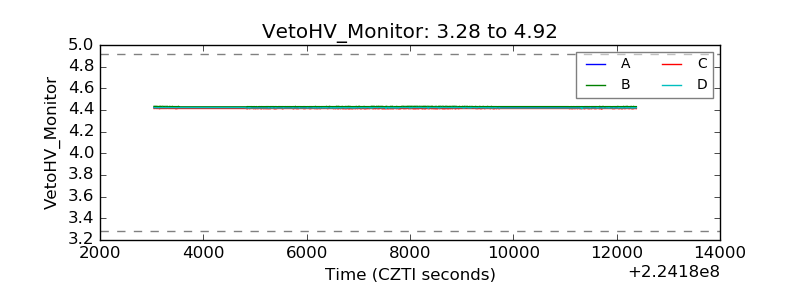 |
| Veto LLD | 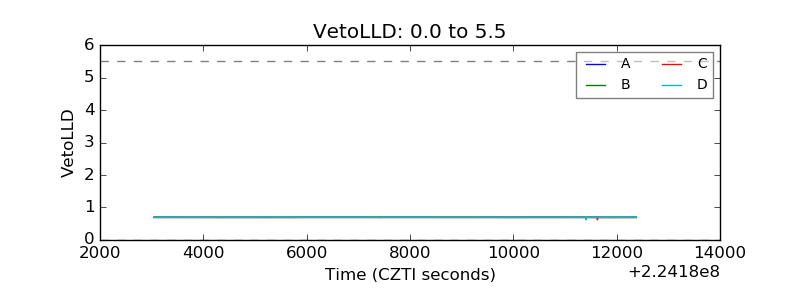 |
| Alpha Counter | 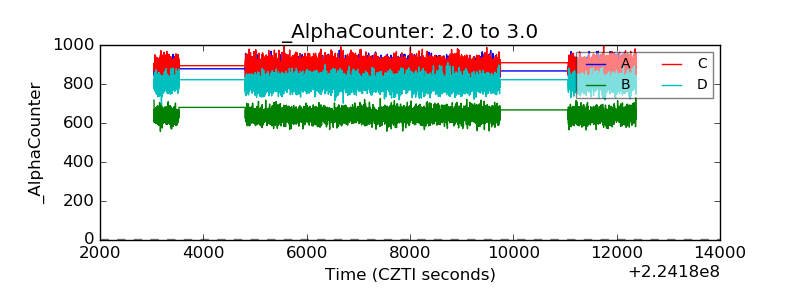 |
| _CPM_Rate | 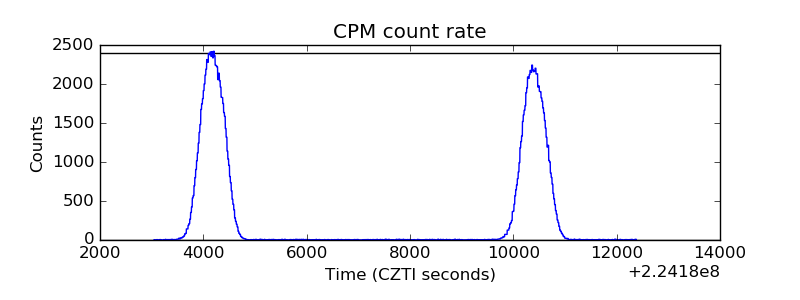 |
| CZT Counter |  |
| +2.5 Volts monitor |  |
| +5 Volts monitor | 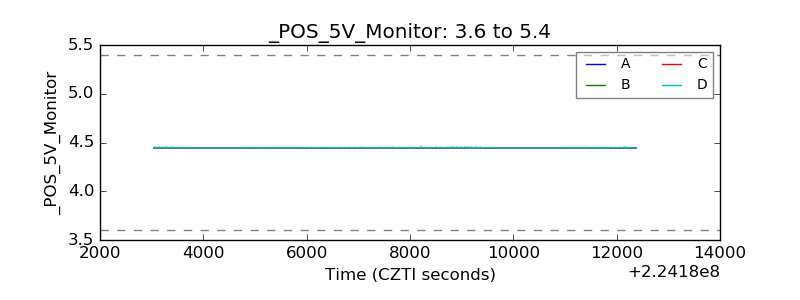 |
| _ROLL_ROT | 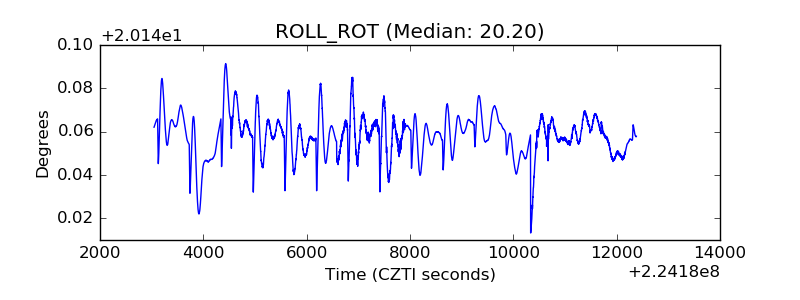 |
| _Roll_DEC | 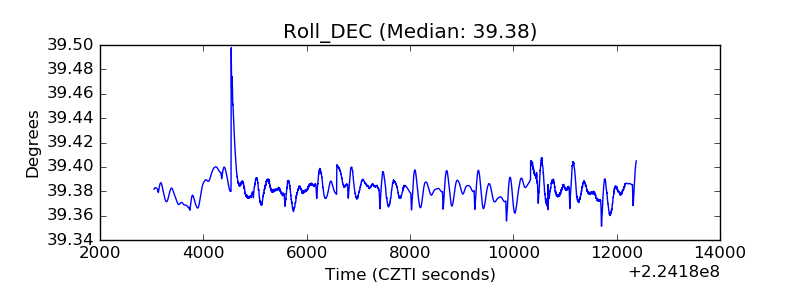 |
| _Roll_RA |  |
| Veto Counter | 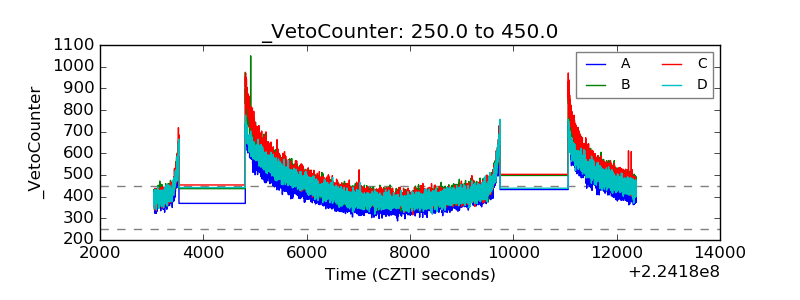 |