| Param | Original file | Final file |
|---|---|---|
| Filename | modeM0/AS1G06_117T01_9000001012_07383cztM0_level2.evt | modeM0/AS1G06_117T01_9000001012_07383cztM0_level2_quad_clean.evt |
| Size (bytes) | 515,007,360 | 99,385,920 |
| Size | 491.1 MB | 94.8 MB |
| Events in quadrant A | 4,613,756 | 611,390 |
| Events in quadrant B | 3,527,625 | 650,659 |
| Events in quadrant C | 3,326,277 | 647,852 |
| Events in quadrant D | 3,651,516 | 609,435 |
| Mode M9 | |||
|---|---|---|---|
| Quadrant | BADHDUFLAG | Total packets | Discarded packets |
| A | 0 | 26 | 0 |
| B | 0 | 26 | 0 |
| C | 0 | 26 | 0 |
| D | 0 | 26 | 0 |
| Mode M0 | |||
|---|---|---|---|
| Quadrant | BADHDUFLAG | Total packets | Discarded packets |
| A | 0 | 18514 | 3 |
| B | 0 | 15300 | 2 |
| C | 0 | 14745 | 2 |
| D | 0 | 15875 | 2 |
| Mode SS | |||
|---|---|---|---|
| Quadrant | BADHDUFLAG | Total packets | Discarded packets |
| A | 0 | 142 | 0 |
| B | 0 | 142 | 0 |
| C | 0 | 142 | 0 |
| D | 0 | 142 | 0 |
| Quadrant | Total seconds | Saturated seconds | Saturation percentage |
|---|---|---|---|
| A | 7051 | 329 | 4.666005% |
| B | 7051 | 87 | 1.233868% |
| C | 7051 | 62 | 0.879308% |
| D | 7051 | 98 | 1.389874% |
Noise dominated data is calculated using 1-second bins in cleaned event files. If a bin has >2000 counts, and if more than 50% of those come from <1% of pixels, then it is considered to be noise-dominated and hence unusable.
| Quadrant | # 1 sec bins | Bins with >0 counts | Bins with >2000 counts | High rate bins dominated by noise | Noise dominated (total time) | Noise dominated (detector-on time) | Marked lightcurve |
|---|---|---|---|---|---|---|---|
| A | 9571 | 7053 | 201 | 201 | 2.10% | 2.85% | 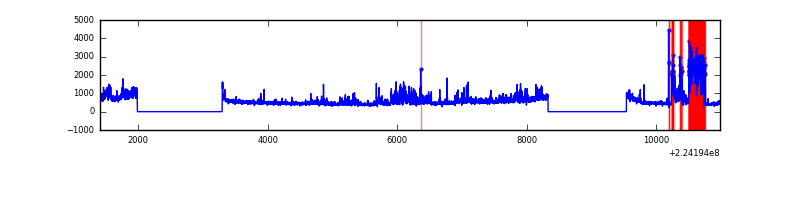 |
| B | 9571 | 7053 | 4 | 4 | 0.04% | 0.06% | 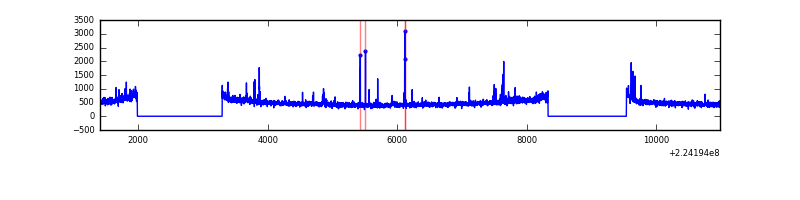 |
| C | 9571 | 7053 | 1 | 1 | 0.01% | 0.01% | 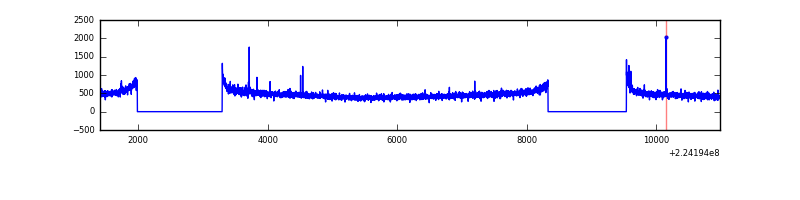 |
| D | 9571 | 7053 | 28 | 28 | 0.29% | 0.40% | 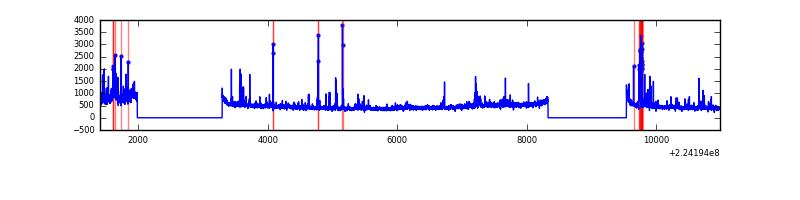 |
Top three noisy pixels from each quadrant. If the there are fewer than three noisy pixels in the level2.evt file, extra rows are filled as -1
| Pixel properties | Quadrant properties | ||||||
|---|---|---|---|---|---|---|---|
| Quadrant | DetID | PixID | Counts | Sigma | Mean | Median | Sigma |
| A | 15 | 239 | 1199119 | 7027.91 | 839 | 820 | 170.5 |
| A | 15 | 234 | 150443 | 877.53 | 839 | 820 | 170.5 |
| A | 0 | 23 | 22785 | 128.82 | 839 | 820 | 170.5 |
| B | 0 | 214 | 94189 | 567.96 | 867 | 847 | 164.3 |
| B | 4 | 81 | 47857 | 286.04 | 867 | 847 | 164.3 |
| B | 12 | 111 | 16787 | 96.99 | 867 | 847 | 164.3 |
| C | 1 | 16 | 18125 | 88.71 | 844 | 850 | 194.7 |
| C | 12 | 4 | 7247 | 32.85 | 844 | 850 | 194.7 |
| C | 10 | 22 | 6771 | 30.4 | 844 | 850 | 194.7 |
| D | 14 | 34 | 188856 | 917.9 | 833 | 804 | 204.9 |
| D | 13 | 137 | 162879 | 791.11 | 833 | 804 | 204.9 |
| D | 1 | 52 | 49387 | 237.14 | 833 | 804 | 204.9 |
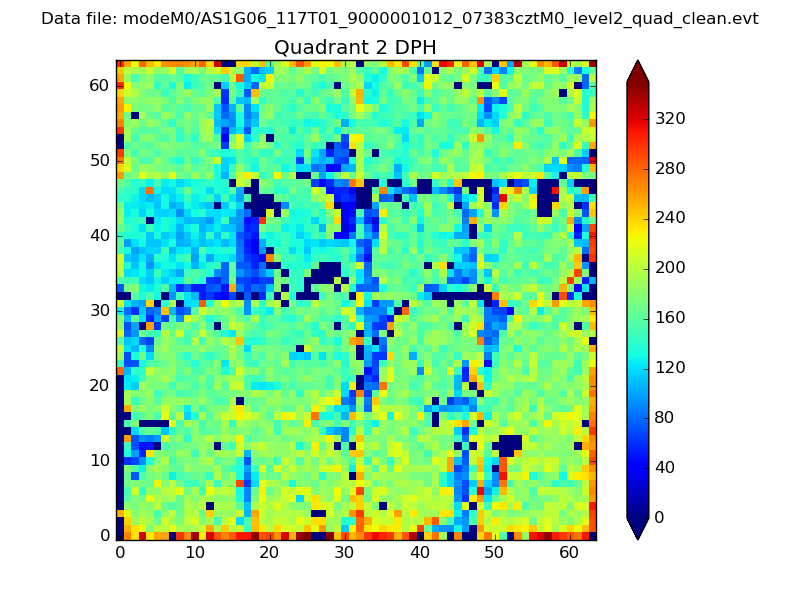
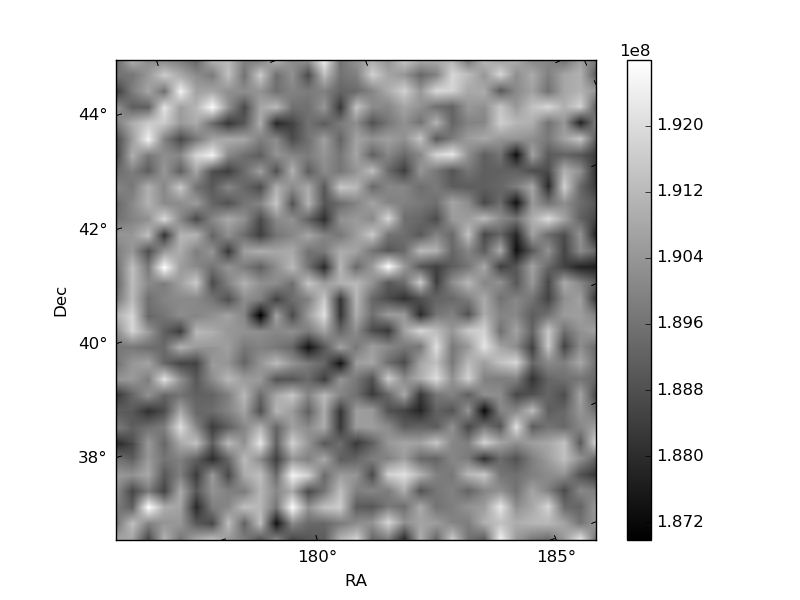
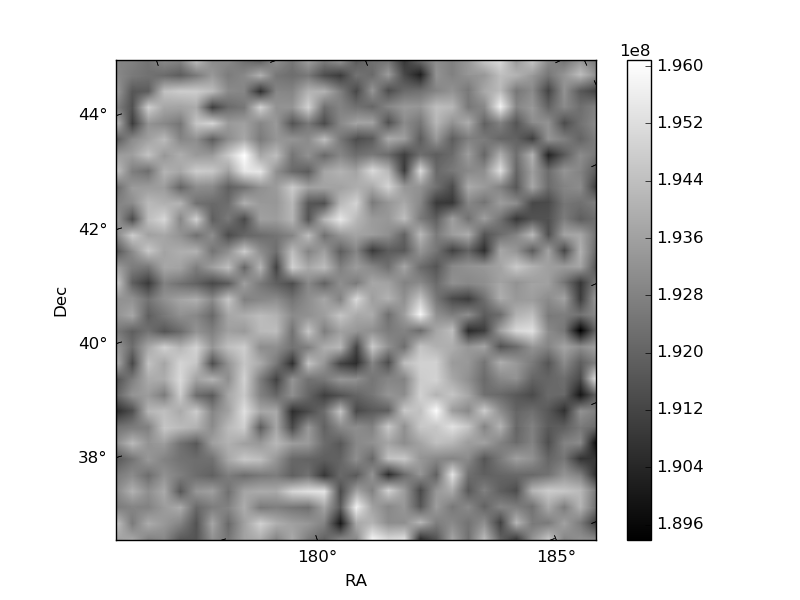
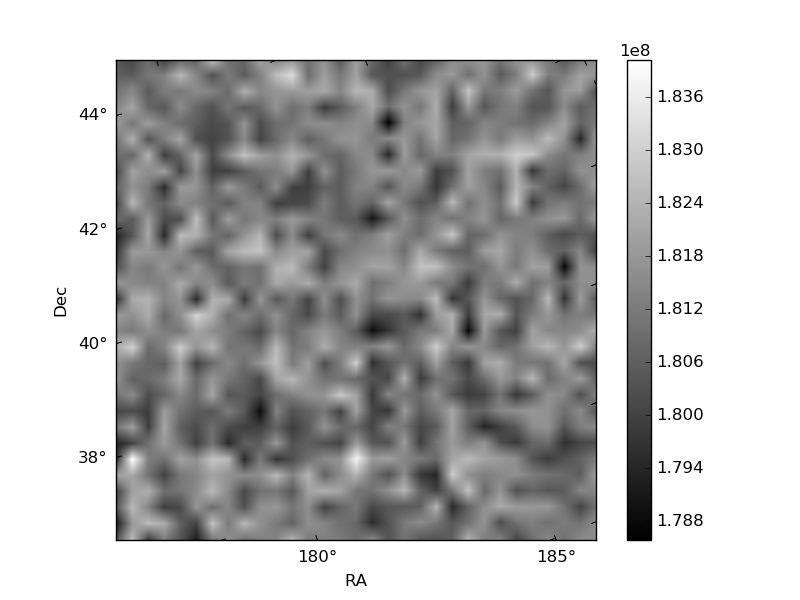
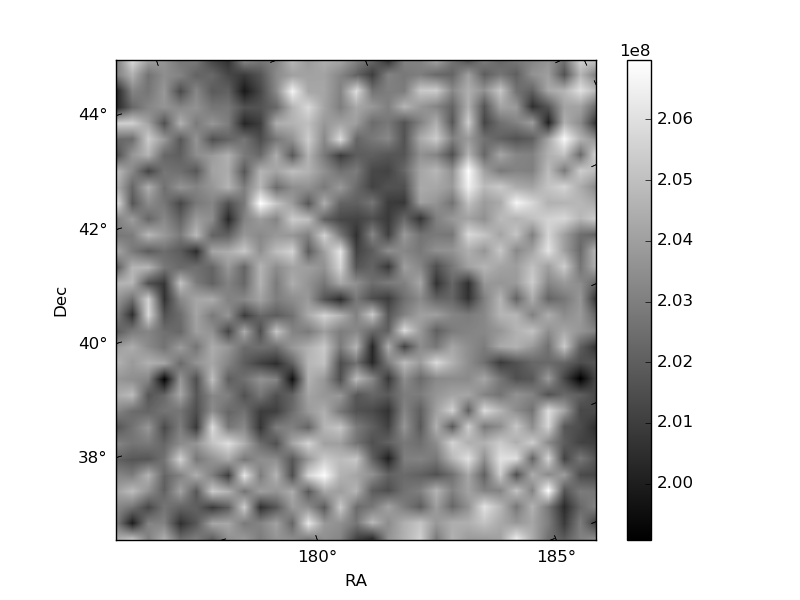
Histogram calculated using DETX and DETY for each event in the final _common_clean file
| Quadrant A | 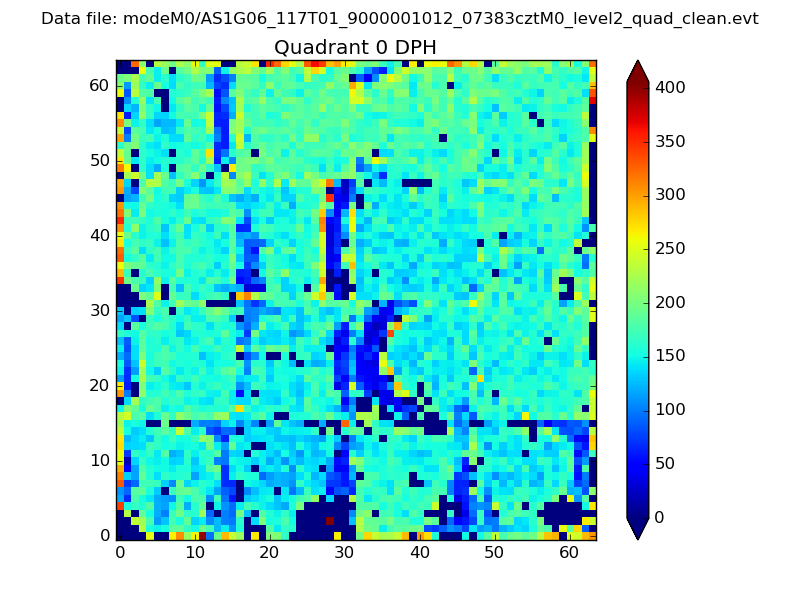 |
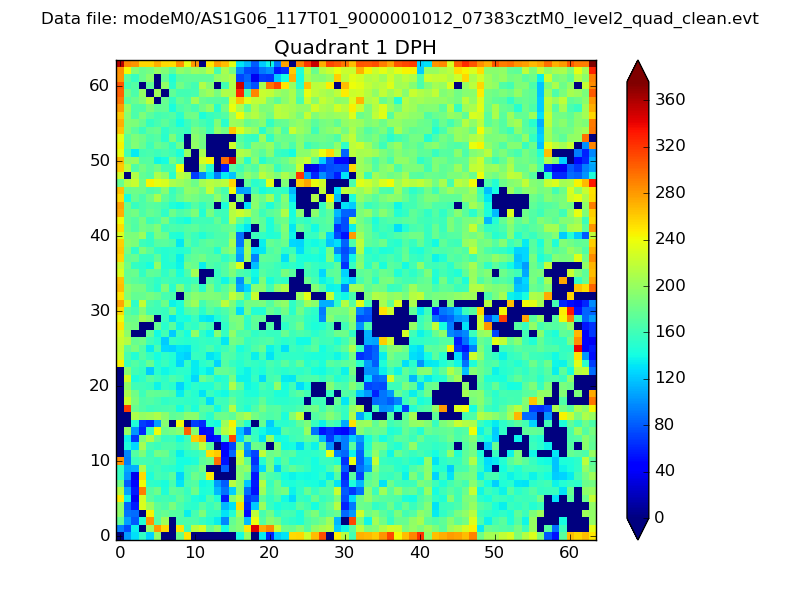 |
Quadrant B |
|---|---|---|---|
| Quadrant D | 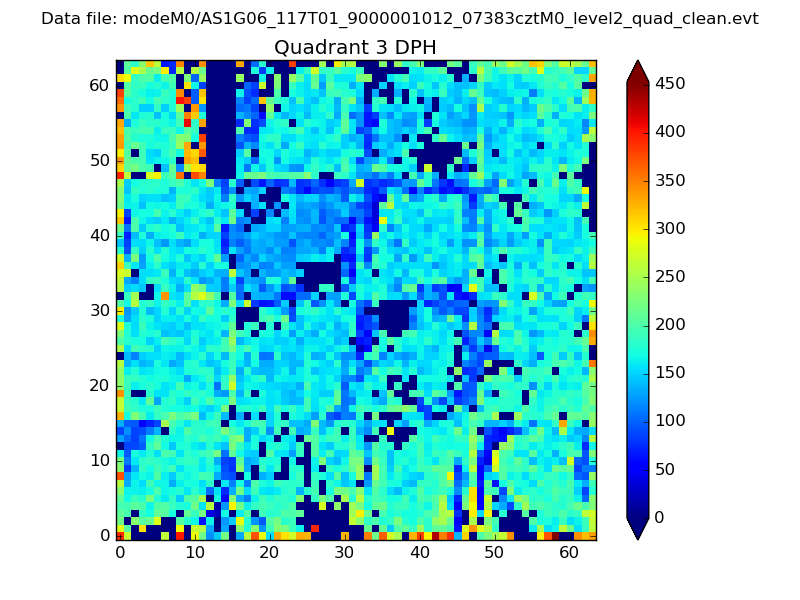 |
 |
Quadrant C |
| Plot type | Count rate plots | Images |
|---|---|---|
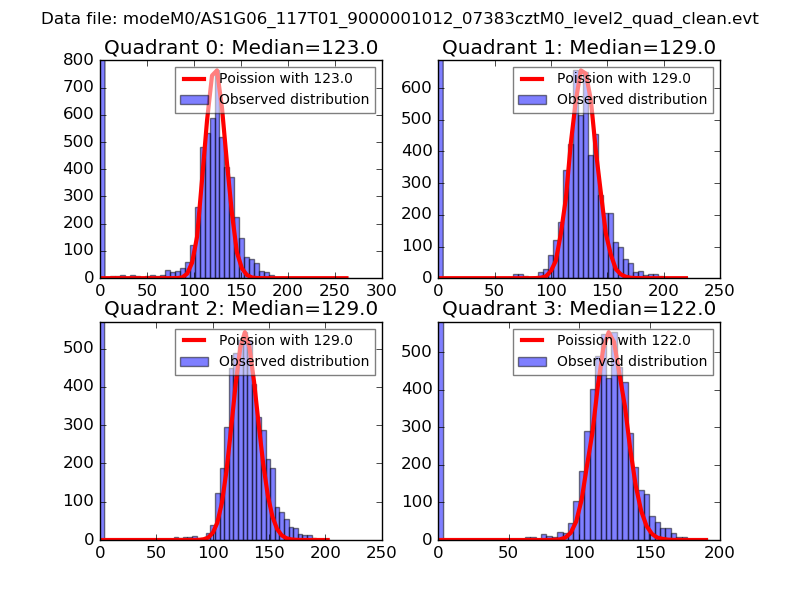
| Comparison with Poisson distribution Blue bars denote a histogram of data divided into 1 sec bins. Red curve is a Poisson curve with rate = median count rate of data. |
 |
 |
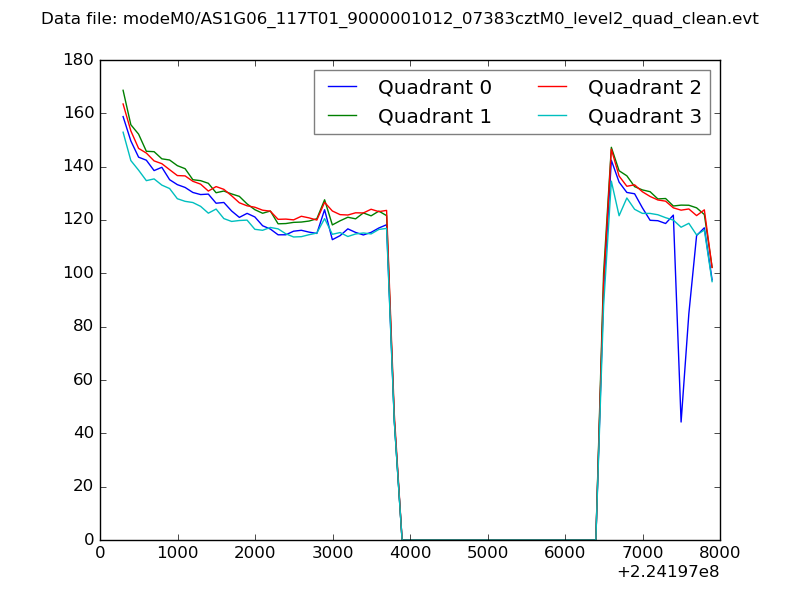
| Quadrant-wise count rates Data is divided into 100 sec bins |
 |
|
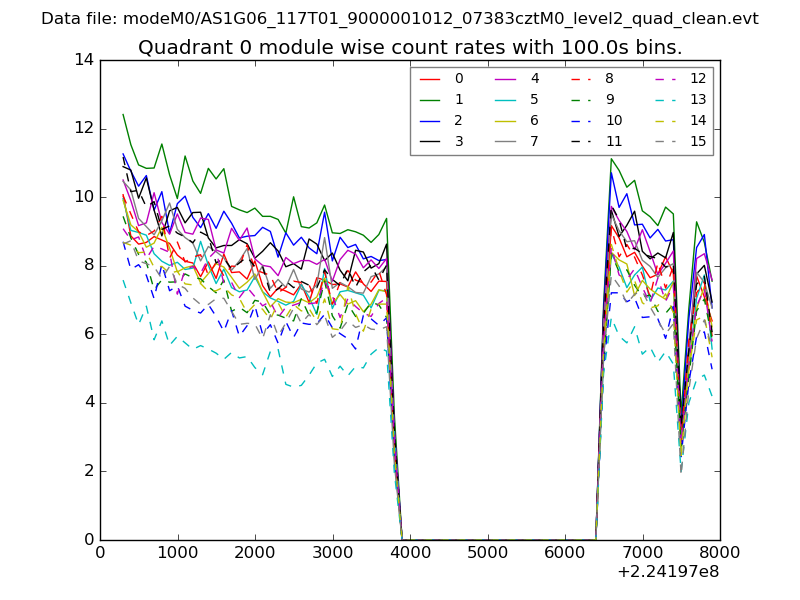
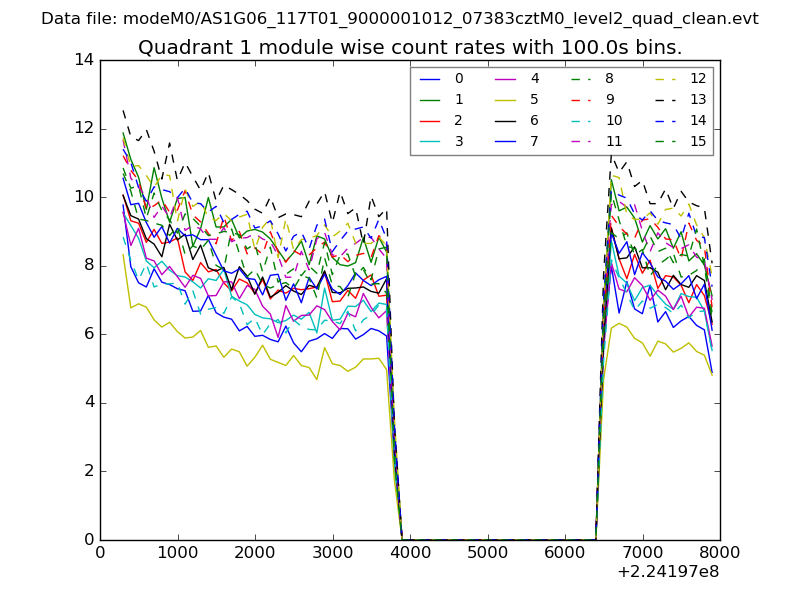
| Module-wise count rates for Quadrant A Data is divided into 100 sec bins |
 |
 |
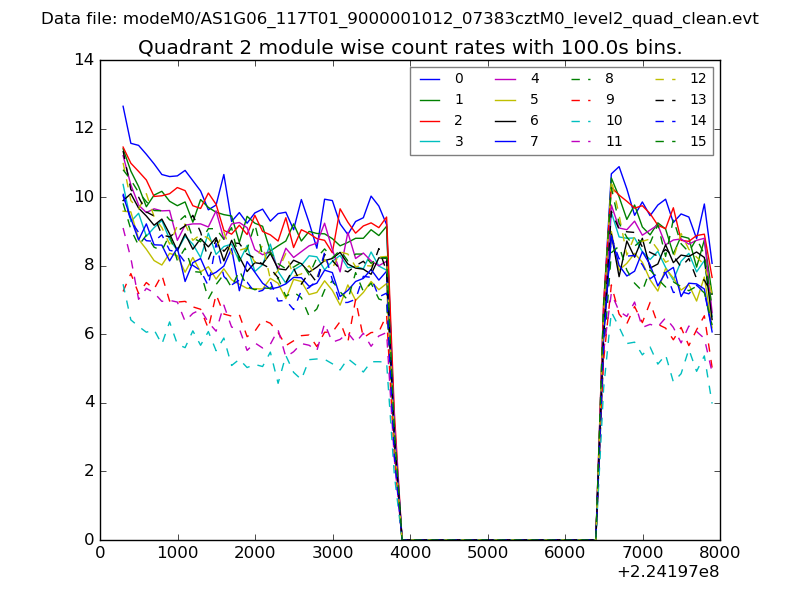
| Module-wise count rates for Quadrant B Data is divided into 100 sec bins |
 |
 |
| Module-wise count rates for Quadrant C Data is divided into 100 sec bins |
 |
 |
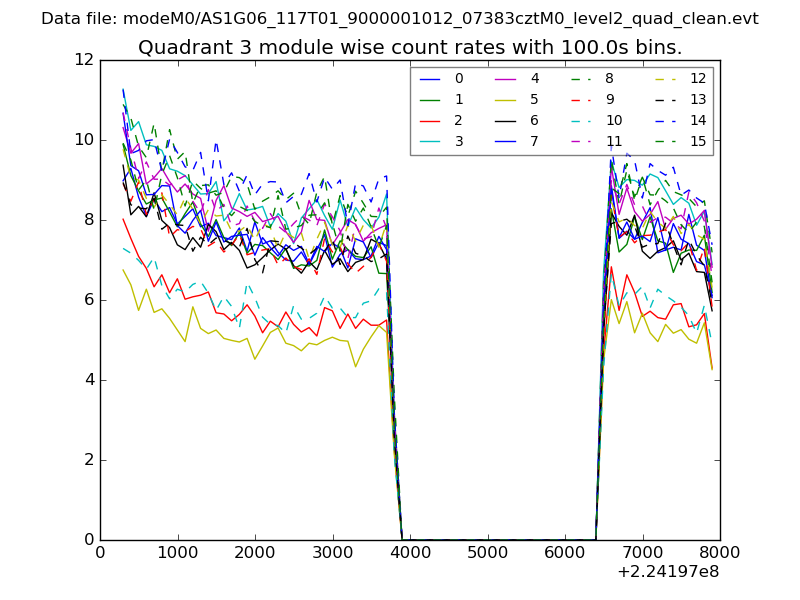
| Module-wise count rates for Quadrant D Data is divided into 100 sec bins |
 |
 |
| Parameter | Plot |
|---|---|
| CZT HV Monitor | 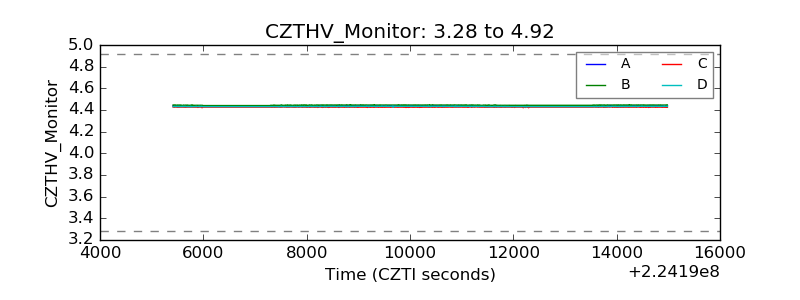 |
| D_VDD | 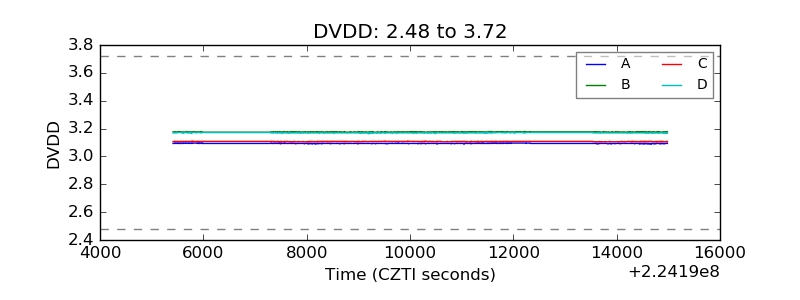 |
| Temperature 1 | 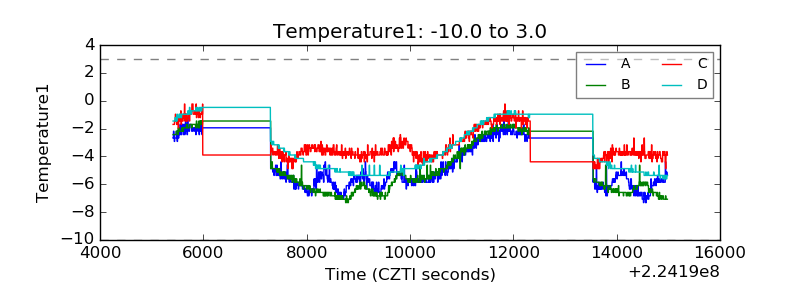 |
| Veto HV Monitor | 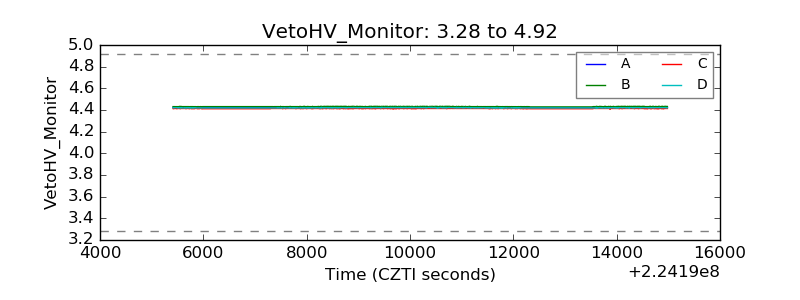 |
| Veto LLD | 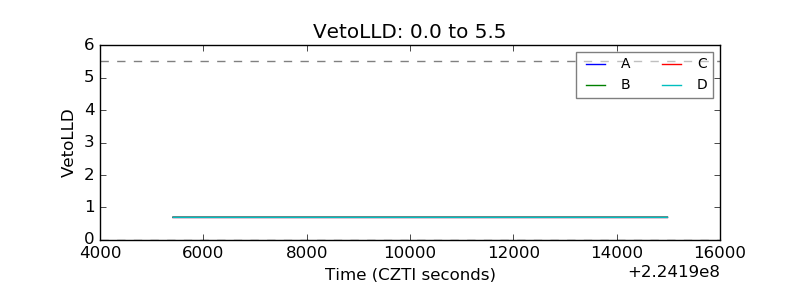 |
| Alpha Counter | 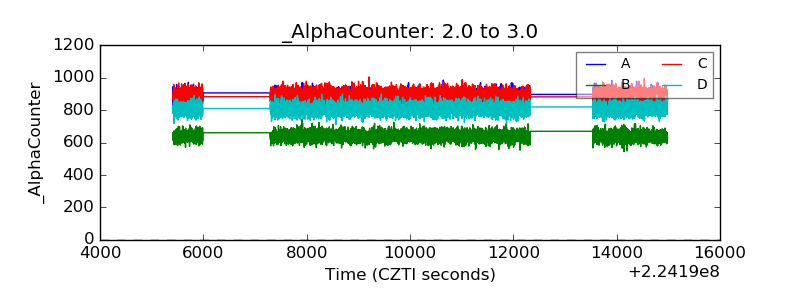 |
| _CPM_Rate | 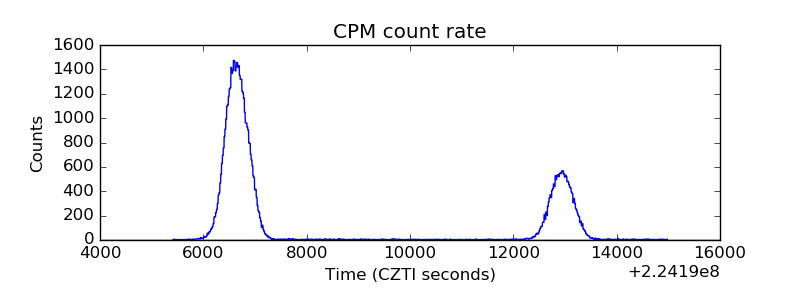 |
| CZT Counter | 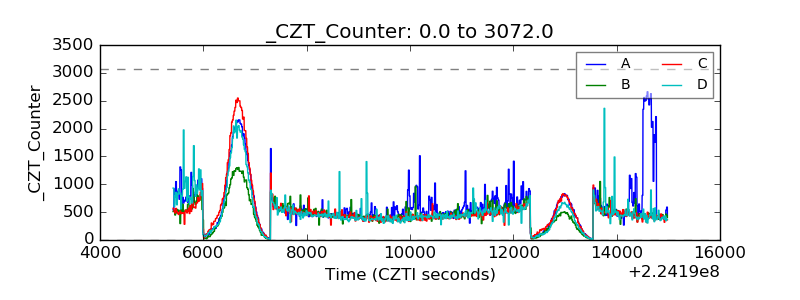 |
| +2.5 Volts monitor | 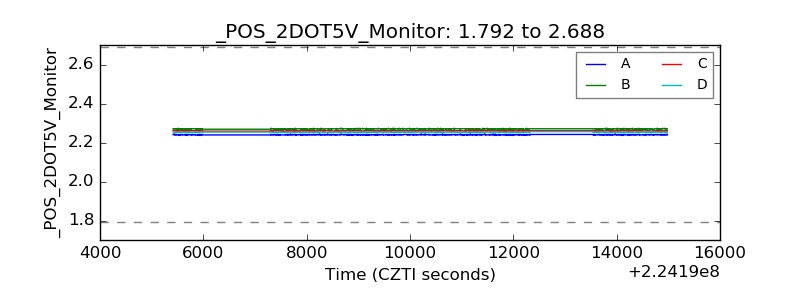 |
| +5 Volts monitor | 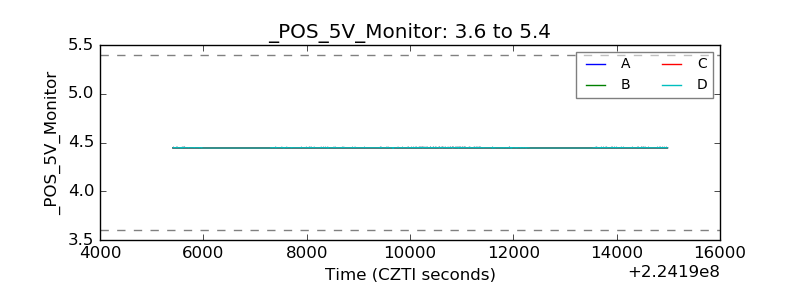 |
| _ROLL_ROT | 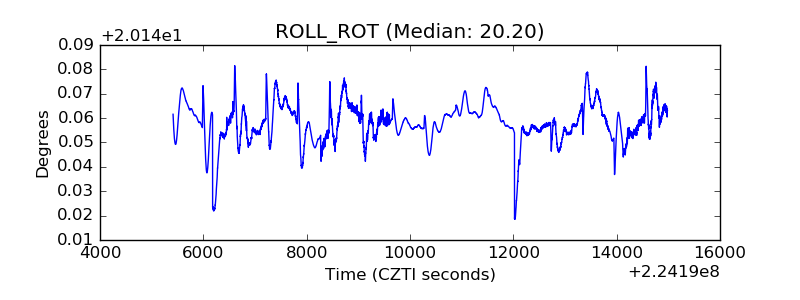 |
| _Roll_DEC | 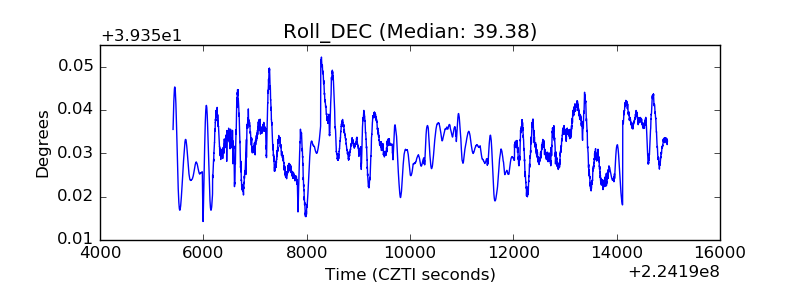 |
| _Roll_RA | 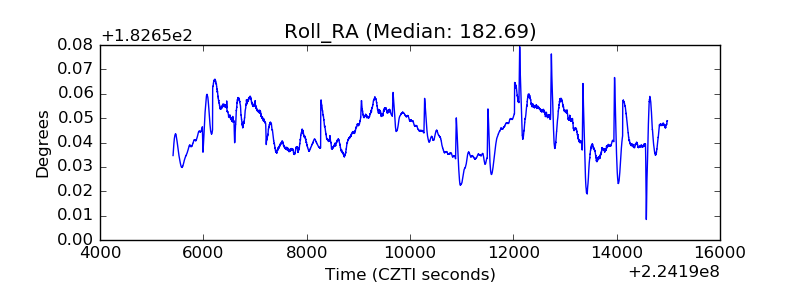 |
| Veto Counter | 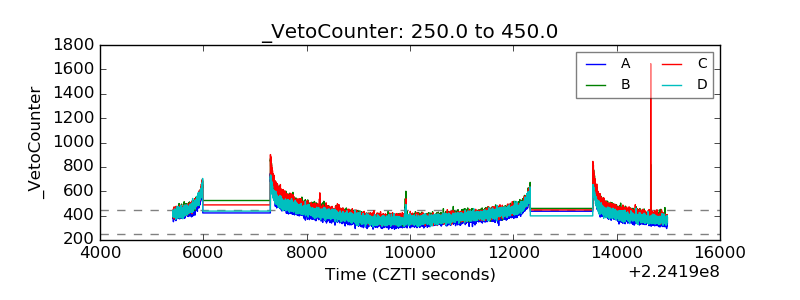 |