| Param | Original file | Final file |
|---|---|---|
| Filename | modeM0/AS1G06_117T01_9000001012_07384cztM0_level2.evt | modeM0/AS1G06_117T01_9000001012_07384cztM0_level2_quad_clean.evt |
| Size (bytes) | 458,850,240 | 90,034,560 |
| Size | 437.6 MB | 85.9 MB |
| Events in quadrant A | 3,818,805 | 545,425 |
| Events in quadrant B | 3,215,102 | 579,304 |
| Events in quadrant C | 3,064,419 | 577,935 |
| Events in quadrant D | 3,332,002 | 546,307 |
| Mode M9 | |||
|---|---|---|---|
| Quadrant | BADHDUFLAG | Total packets | Discarded packets |
| A | 0 | 15 | 0 |
| B | 0 | 15 | 0 |
| C | 0 | 15 | 0 |
| D | 0 | 16 | 0 |
| Mode M0 | |||
|---|---|---|---|
| Quadrant | BADHDUFLAG | Total packets | Discarded packets |
| A | 0 | 16169 | 3 |
| B | 0 | 14335 | 2 |
| C | 0 | 14070 | 2 |
| D | 0 | 14984 | 2 |
| Mode SS | |||
|---|---|---|---|
| Quadrant | BADHDUFLAG | Total packets | Discarded packets |
| A | 0 | 140 | 0 |
| B | 0 | 140 | 0 |
| C | 0 | 140 | 0 |
| D | 0 | 140 | 0 |
| Quadrant | Total seconds | Saturated seconds | Saturation percentage |
|---|---|---|---|
| A | 6849 | 242 | 3.533363% |
| B | 6849 | 31 | 0.452621% |
| C | 6849 | 22 | 0.321215% |
| D | 6849 | 36 | 0.525624% |
Noise dominated data is calculated using 1-second bins in cleaned event files. If a bin has >2000 counts, and if more than 50% of those come from <1% of pixels, then it is considered to be noise-dominated and hence unusable.
| Quadrant | # 1 sec bins | Bins with >0 counts | Bins with >2000 counts | High rate bins dominated by noise | Noise dominated (total time) | Noise dominated (detector-on time) | Marked lightcurve |
|---|---|---|---|---|---|---|---|
| A | 7779 | 6850 | 214 | 214 | 2.75% | 3.12% | 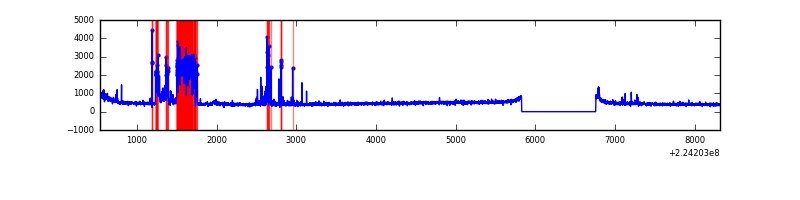 |
| B | 7779 | 6850 | 2 | 2 | 0.03% | 0.03% | 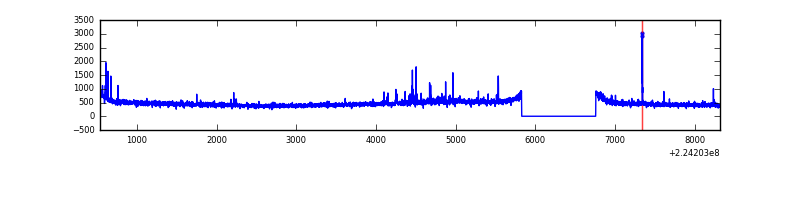 |
| C | 7779 | 6850 | 5 | 5 | 0.06% | 0.07% | 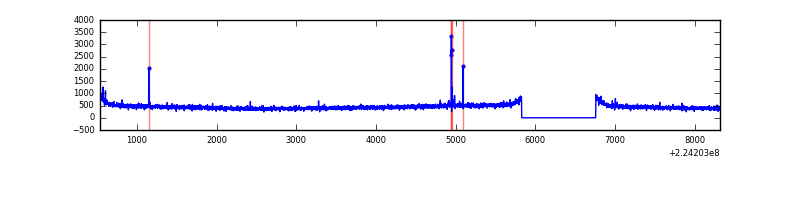 |
| D | 7779 | 6850 | 29 | 29 | 0.37% | 0.42% | 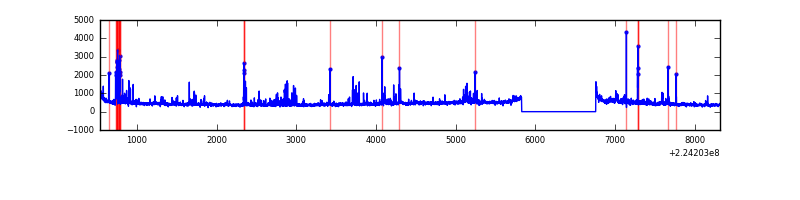 |
Top three noisy pixels from each quadrant. If the there are fewer than three noisy pixels in the level2.evt file, extra rows are filled as -1
| Pixel properties | Quadrant properties | ||||||
|---|---|---|---|---|---|---|---|
| Quadrant | DetID | PixID | Counts | Sigma | Mean | Median | Sigma |
| A | 15 | 239 | 531769 | 3365.73 | 777 | 760 | 157.8 |
| A | 15 | 234 | 277455 | 1753.79 | 777 | 760 | 157.8 |
| A | 14 | 111 | 13010 | 77.64 | 777 | 760 | 157.8 |
| B | 0 | 214 | 48377 | 308.1 | 803 | 784 | 154.5 |
| B | 4 | 81 | 24287 | 152.15 | 803 | 784 | 154.5 |
| B | 12 | 111 | 15838 | 97.45 | 803 | 784 | 154.5 |
| C | 1 | 16 | 20829 | 110.68 | 778 | 782 | 181.1 |
| C | 12 | 4 | 6795 | 33.2 | 778 | 782 | 181.1 |
| C | 13 | 61 | 5927 | 28.41 | 778 | 782 | 181.1 |
| D | 14 | 34 | 228374 | 1206.75 | 767 | 743 | 188.6 |
| D | 12 | 221 | 79096 | 415.38 | 767 | 743 | 188.6 |
| D | 2 | 14 | 29801 | 154.05 | 767 | 743 | 188.6 |
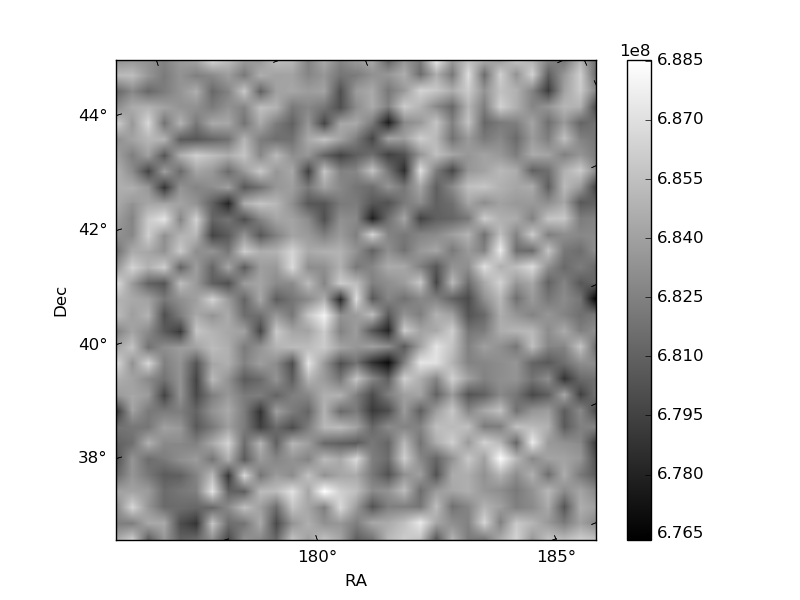
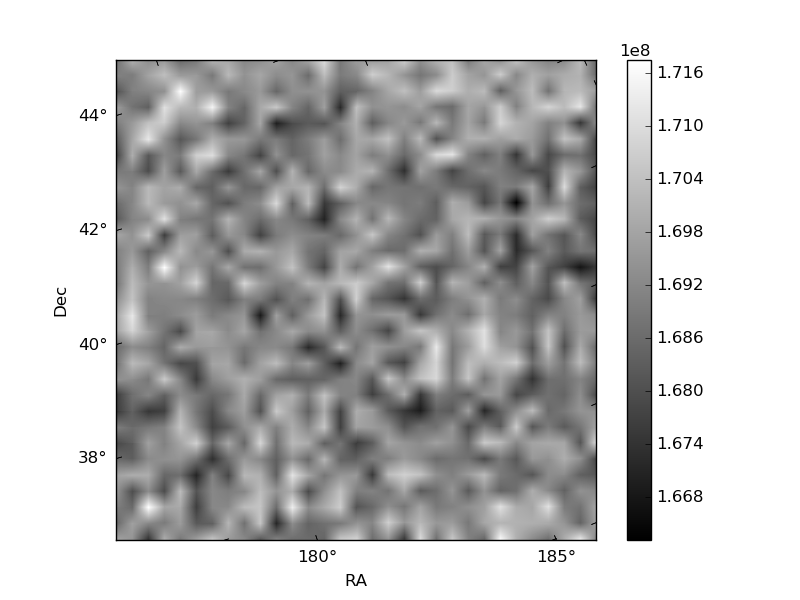
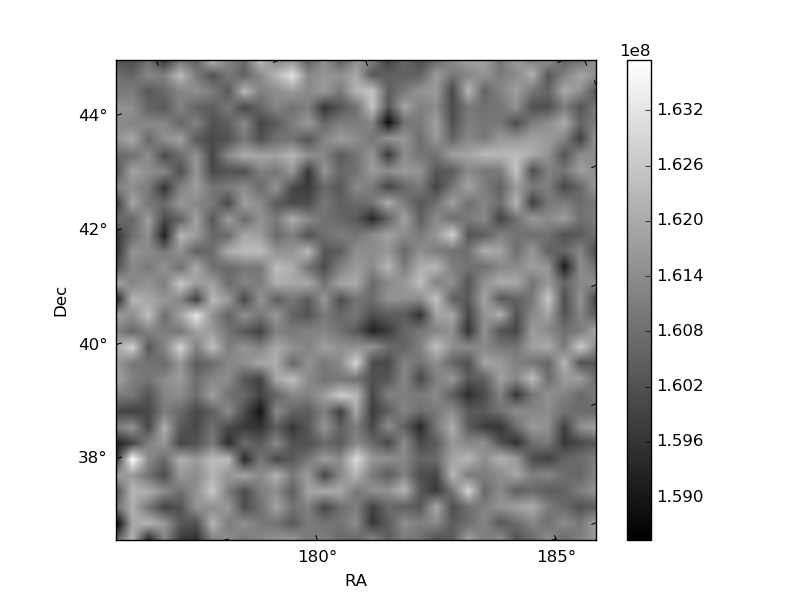
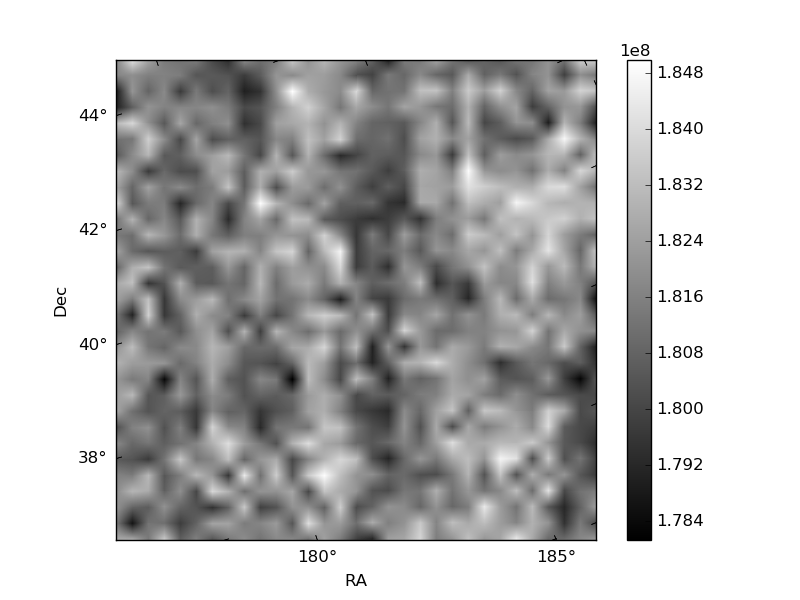
Histogram calculated using DETX and DETY for each event in the final _common_clean file
| Quadrant A | 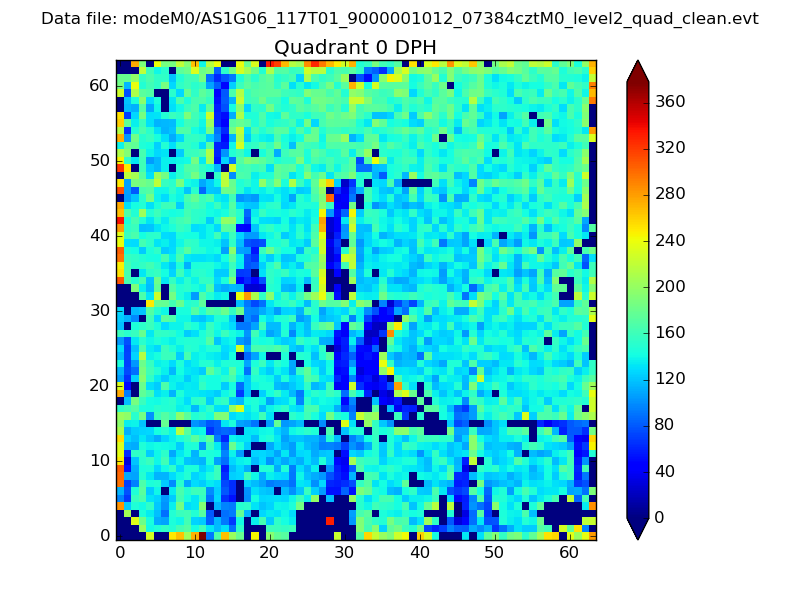 |
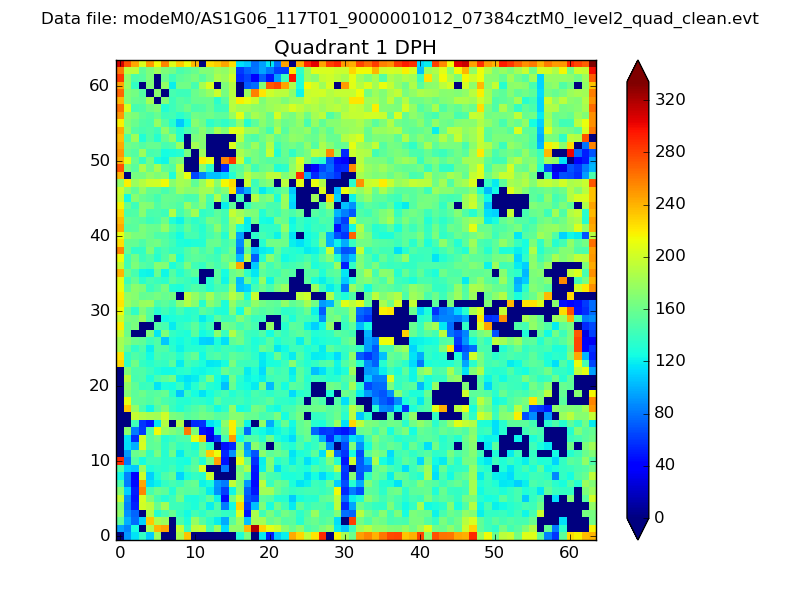 |
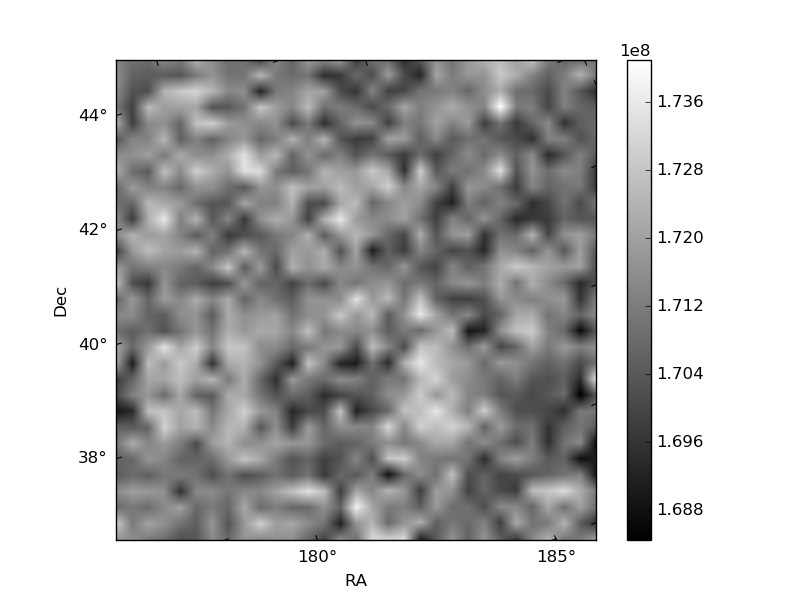
Quadrant B |
|---|---|---|---|
| Quadrant D | 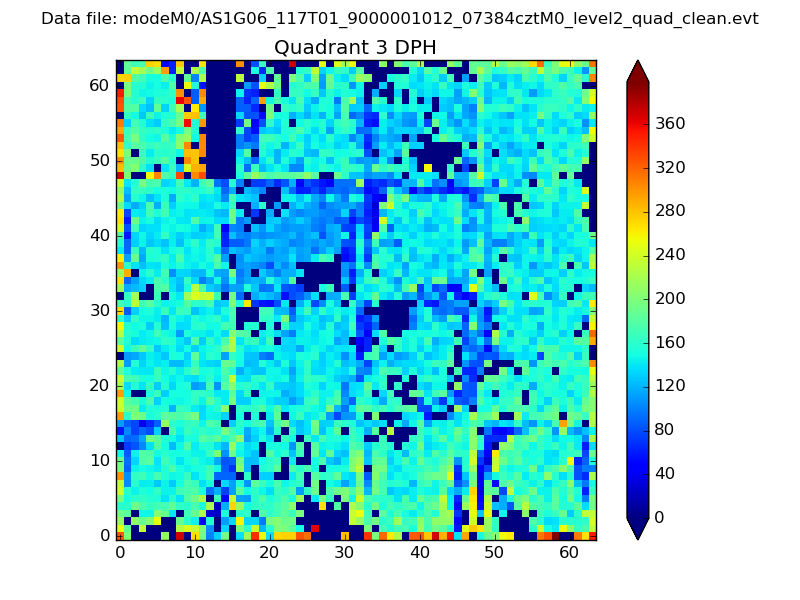 |
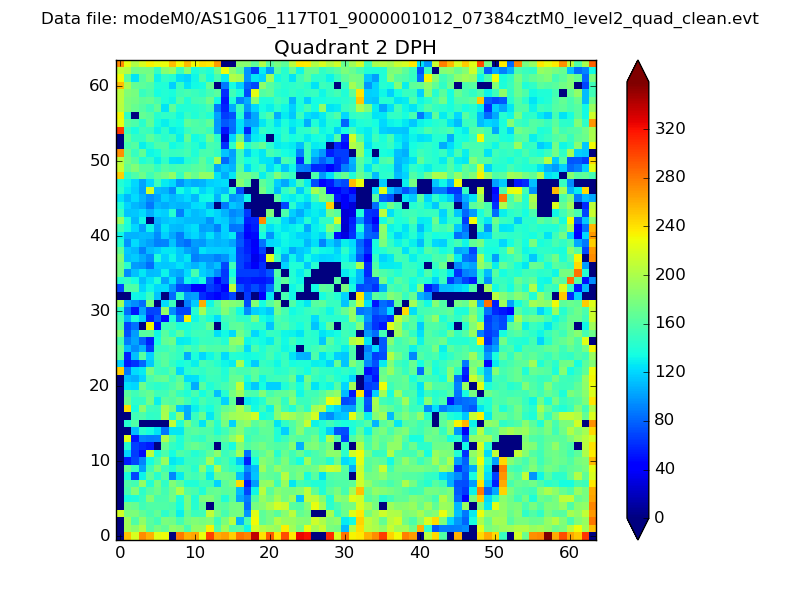 |
Quadrant C |
| Plot type | Count rate plots | Images |
|---|---|---|
| Comparison with Poisson distribution Blue bars denote a histogram of data divided into 1 sec bins. Red curve is a Poisson curve with rate = median count rate of data. |
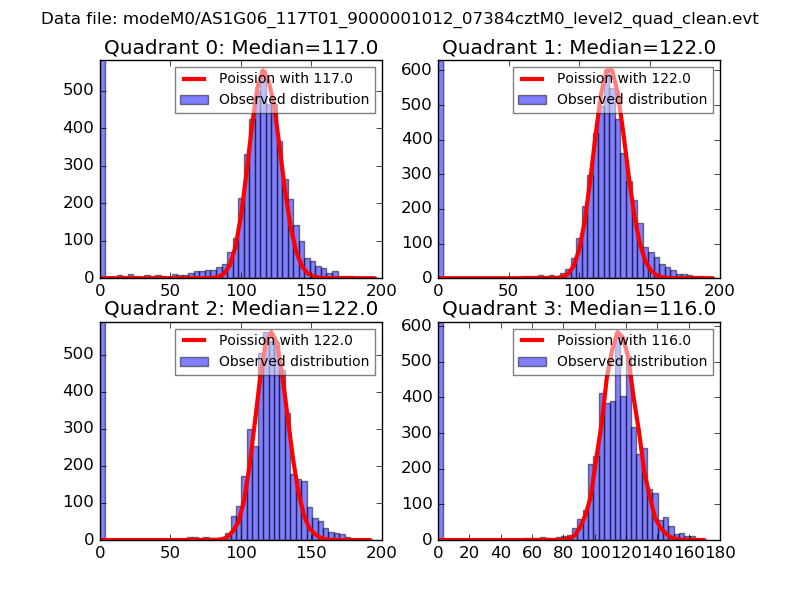 |
 |
| Quadrant-wise count rates Data is divided into 100 sec bins |
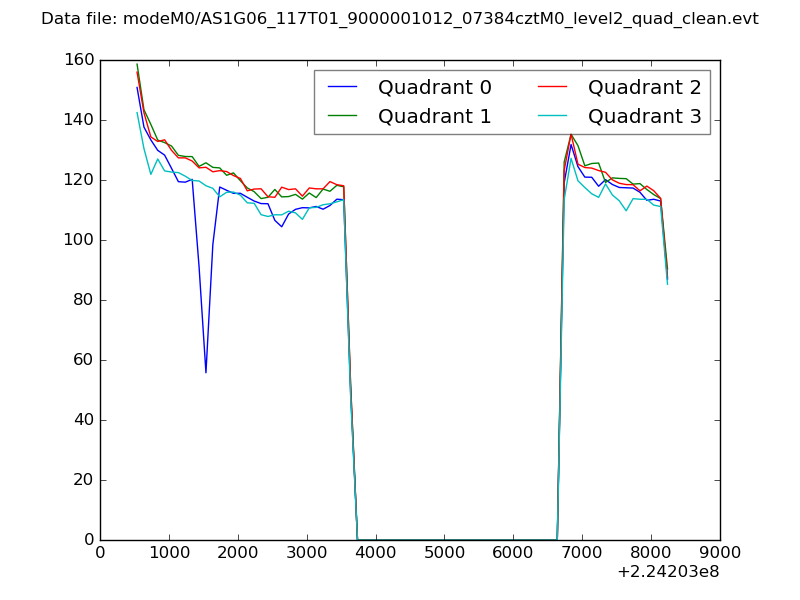 |
|
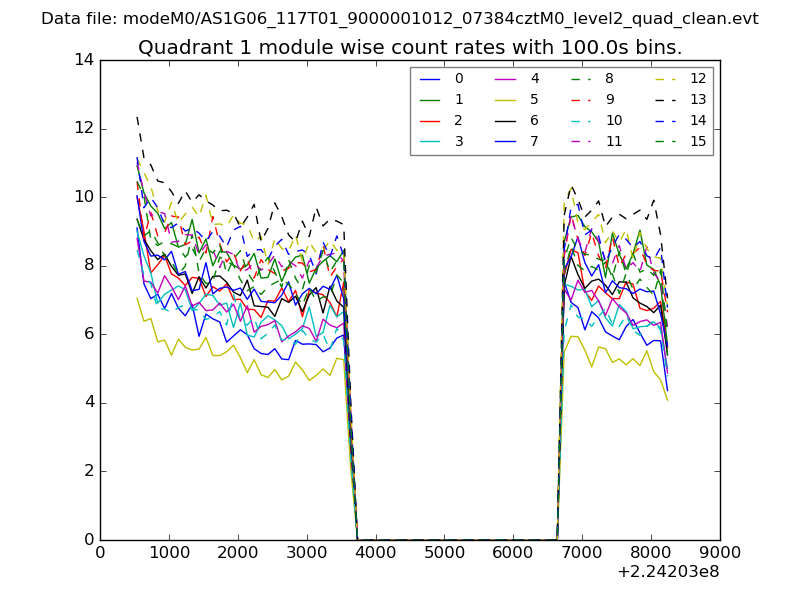
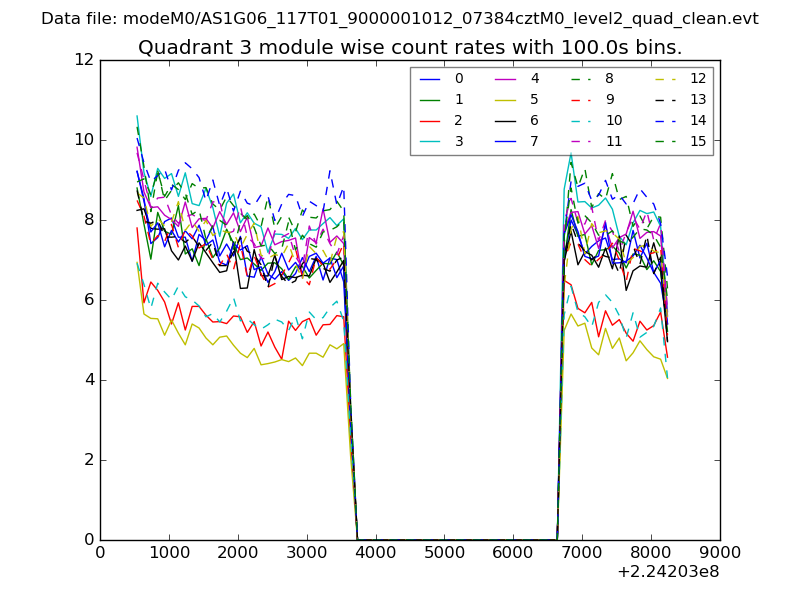
| Module-wise count rates for Quadrant A Data is divided into 100 sec bins |
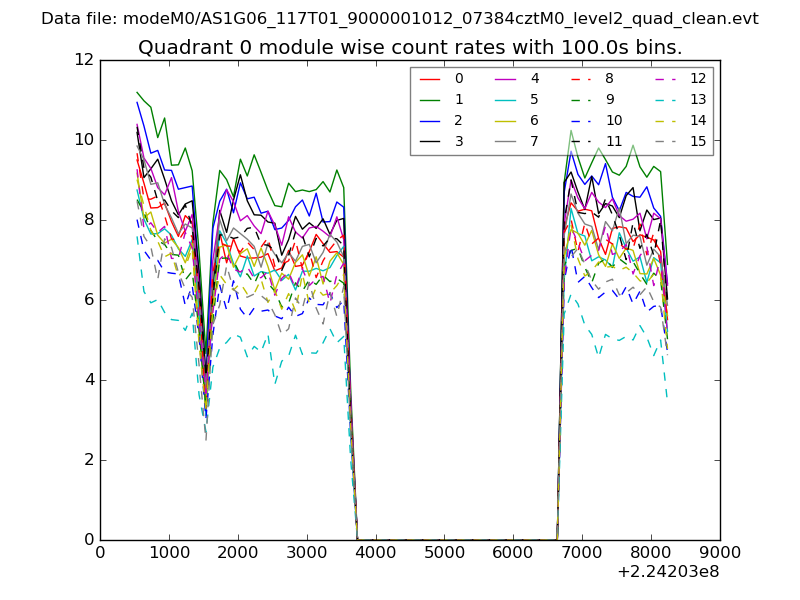 |
 |
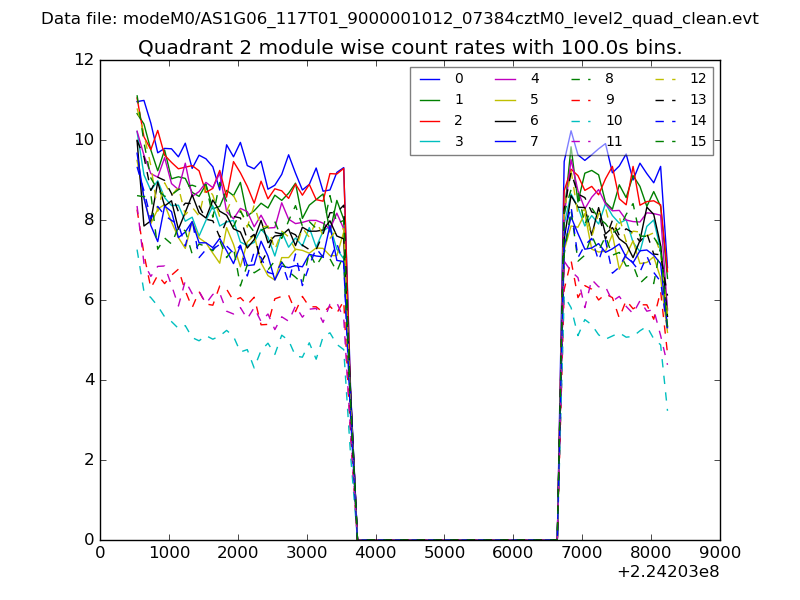
| Module-wise count rates for Quadrant B Data is divided into 100 sec bins |
 |
 |
| Module-wise count rates for Quadrant C Data is divided into 100 sec bins |
 |
 |
| Module-wise count rates for Quadrant D Data is divided into 100 sec bins |
 |
 |
| Parameter | Plot |
|---|---|
| CZT HV Monitor | 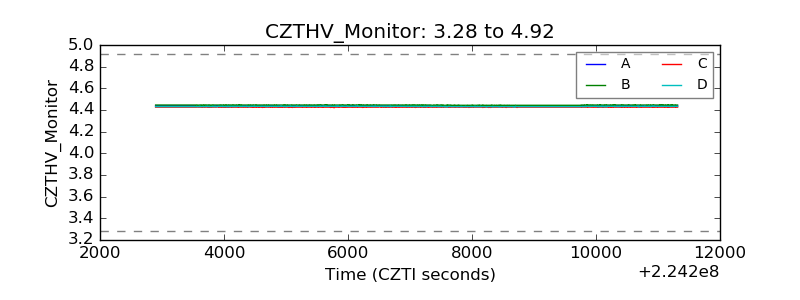 |
| D_VDD | 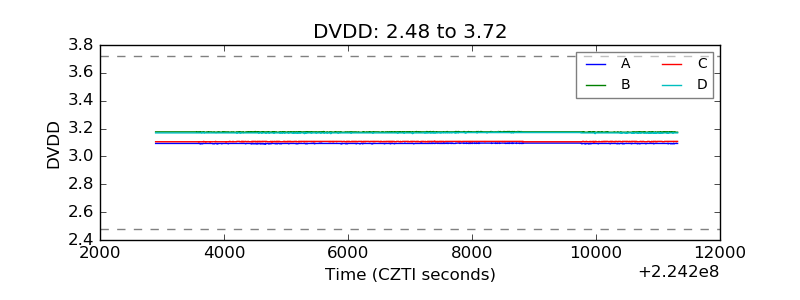 |
| Temperature 1 | 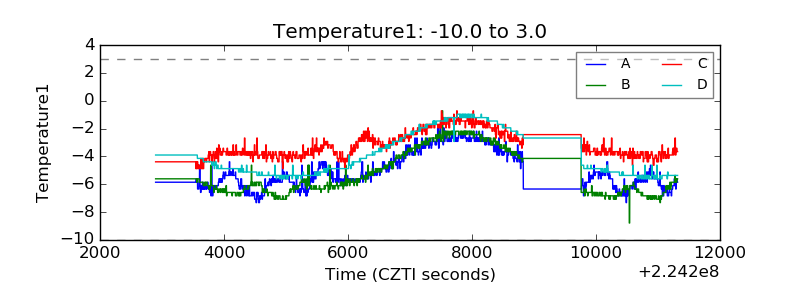 |
| Veto HV Monitor | 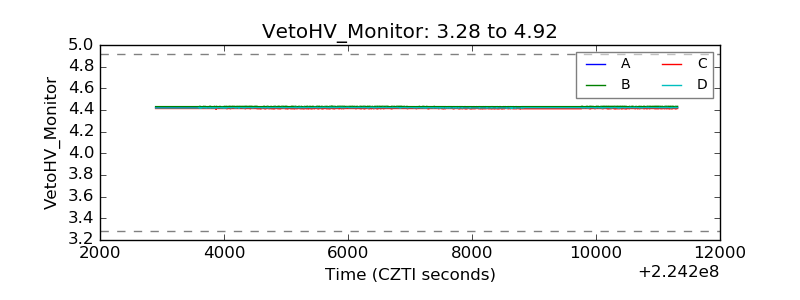 |
| Veto LLD | 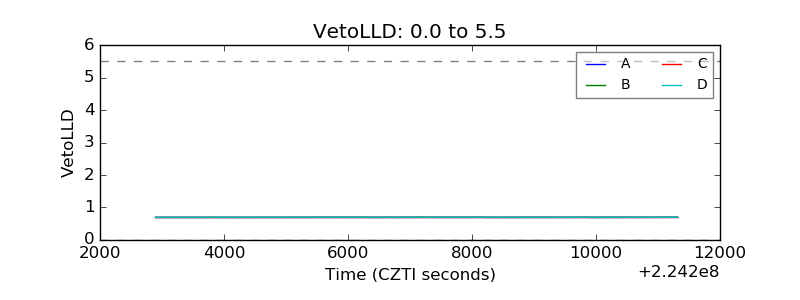 |
| Alpha Counter | 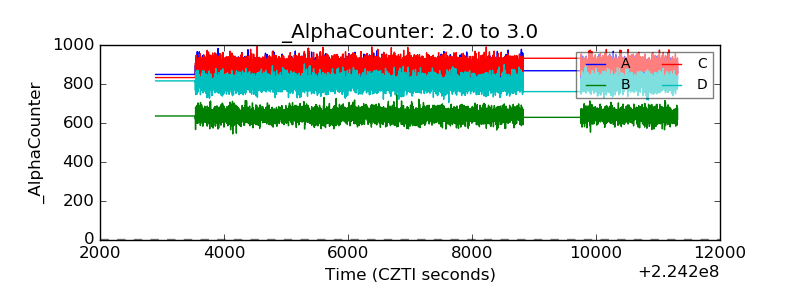 |
| _CPM_Rate | 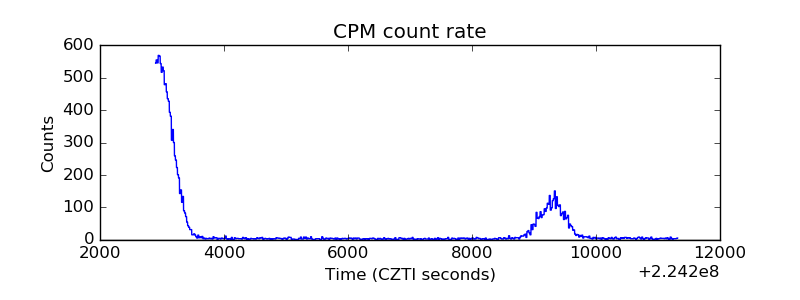 |
| CZT Counter | 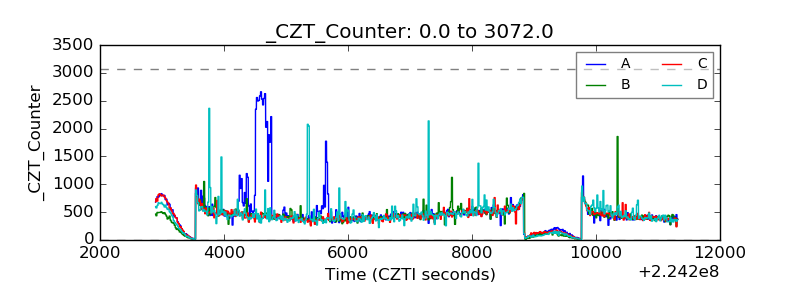 |
| +2.5 Volts monitor |  |
| +5 Volts monitor |  |
| _ROLL_ROT | 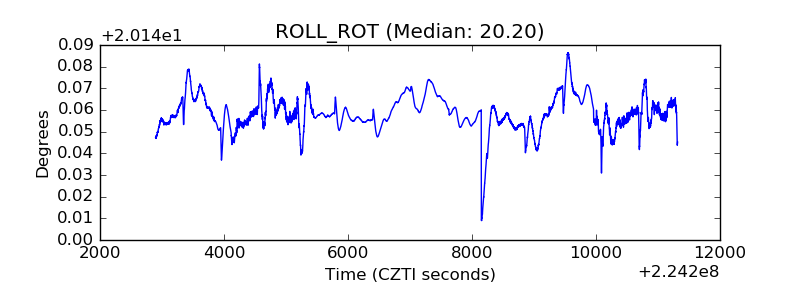 |
| _Roll_DEC | 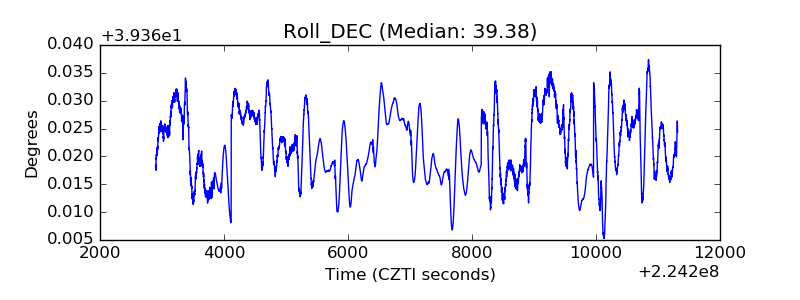 |
| _Roll_RA | 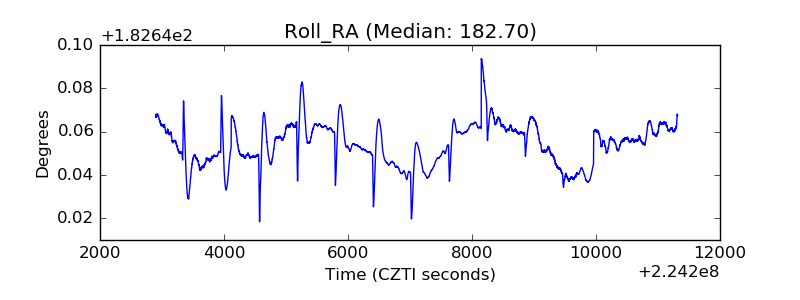 |
| Veto Counter | 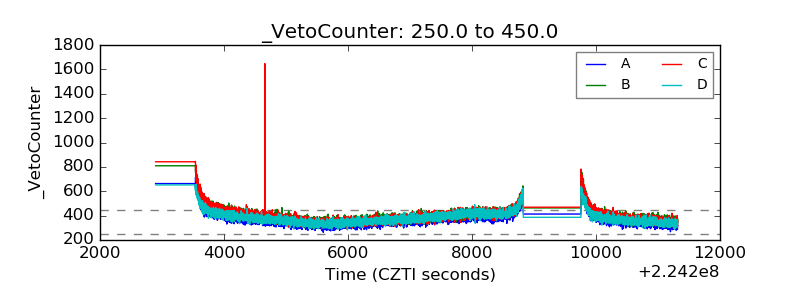 |