| Param | Original file | Final file |
|---|---|---|
| Filename | modeM0/AS1G06_117T01_9000001012_07387cztM0_level2.evt | modeM0/AS1G06_117T01_9000001012_07387cztM0_level2_quad_clean.evt |
| Size (bytes) | 554,791,680 | 97,767,360 |
| Size | 529.1 MB | 93.2 MB |
| Events in quadrant A | 4,012,016 | 603,730 |
| Events in quadrant B | 3,907,005 | 624,732 |
| Events in quadrant C | 3,293,592 | 625,992 |
| Events in quadrant D | 5,078,949 | 583,364 |
| Mode M9 | |||
|---|---|---|---|
| Quadrant | BADHDUFLAG | Total packets | Discarded packets |
| A | 0 | 2 | 0 |
| B | 0 | 2 | 0 |
| C | 0 | 2 | 0 |
| D | 0 | 2 | 0 |
| Mode M0 | |||
|---|---|---|---|
| Quadrant | BADHDUFLAG | Total packets | Discarded packets |
| A | 0 | 17231 | 6 |
| B | 0 | 17009 | 2 |
| C | 0 | 15342 | 2 |
| D | 0 | 20621 | 2 |
| Mode SS | |||
|---|---|---|---|
| Quadrant | BADHDUFLAG | Total packets | Discarded packets |
| A | 0 | 152 | 0 |
| B | 0 | 152 | 0 |
| C | 0 | 152 | 0 |
| D | 0 | 152 | 0 |
| Quadrant | Total seconds | Saturated seconds | Saturation percentage |
|---|---|---|---|
| A | 7511 | 389 | 5.179071% |
| B | 7512 | 174 | 2.316294% |
| C | 7512 | 122 | 1.624068% |
| D | 7512 | 740 | 9.850905% |
Noise dominated data is calculated using 1-second bins in cleaned event files. If a bin has >2000 counts, and if more than 50% of those come from <1% of pixels, then it is considered to be noise-dominated and hence unusable.
| Quadrant | # 1 sec bins | Bins with >0 counts | Bins with >2000 counts | High rate bins dominated by noise | Noise dominated (total time) | Noise dominated (detector-on time) | Marked lightcurve |
|---|---|---|---|---|---|---|---|
| A | 7707 | 7514 | 45 | 45 | 0.58% | 0.60% | 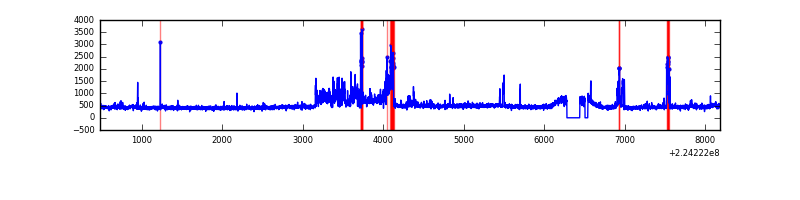 |
| B | 7707 | 7514 | 0 | 0 | 0.00% | 0.00% | 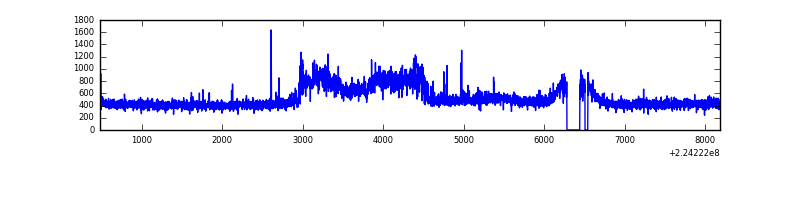 |
| C | 7707 | 7514 | 0 | 0 | 0.00% | 0.00% | 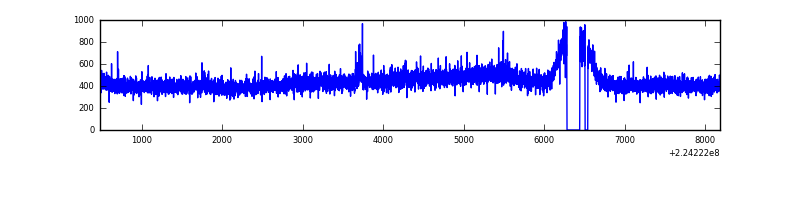 |
| D | 7707 | 7514 | 291 | 291 | 3.78% | 3.87% | 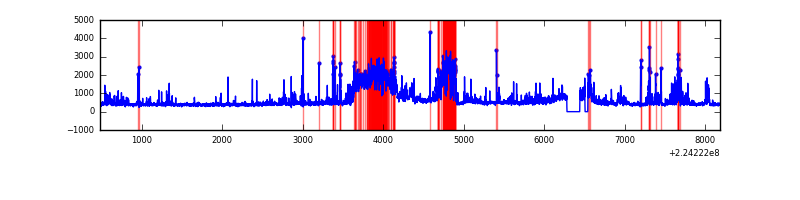 |
Top three noisy pixels from each quadrant. If the there are fewer than three noisy pixels in the level2.evt file, extra rows are filled as -1
| Pixel properties | Quadrant properties | ||||||
|---|---|---|---|---|---|---|---|
| Quadrant | DetID | PixID | Counts | Sigma | Mean | Median | Sigma |
| A | 14 | 111 | 453449 | 2576.18 | 851 | 829 | 175.7 |
| A | 0 | 23 | 226956 | 1287.05 | 851 | 829 | 175.7 |
| A | 0 | 226 | 23569 | 129.43 | 851 | 829 | 175.7 |
| B | 0 | 187 | 481868 | 2886.32 | 866 | 843 | 166.7 |
| B | 0 | 214 | 43730 | 257.34 | 866 | 843 | 166.7 |
| B | 12 | 111 | 17698 | 101.14 | 866 | 843 | 166.7 |
| C | 1 | 16 | 12755 | 60.87 | 838 | 838 | 195.8 |
| C | 8 | 229 | 9821 | 45.88 | 838 | 838 | 195.8 |
| C | 13 | 61 | 6637 | 29.62 | 838 | 838 | 195.8 |
| D | 13 | 137 | 1365379 | 6778.83 | 814 | 786 | 201.3 |
| D | 2 | 216 | 440382 | 2183.76 | 814 | 786 | 201.3 |
| D | 5 | 233 | 62335 | 305.75 | 814 | 786 | 201.3 |
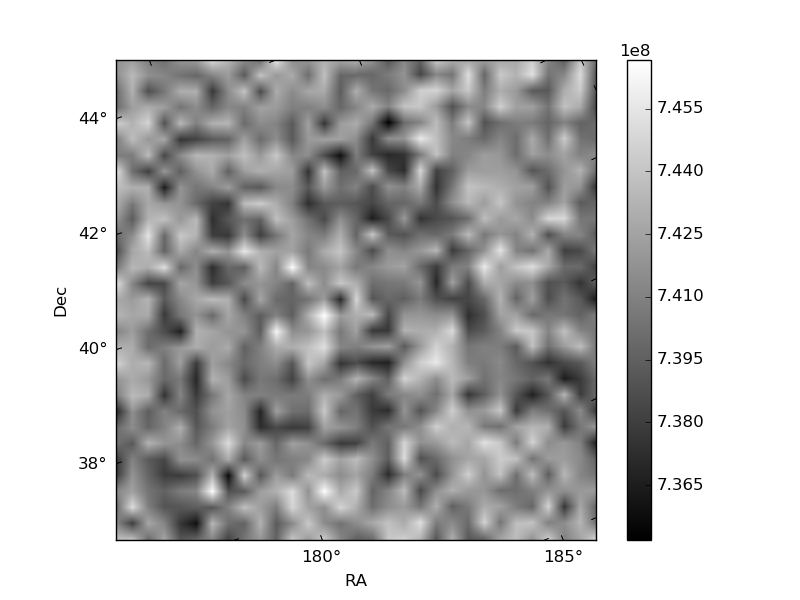
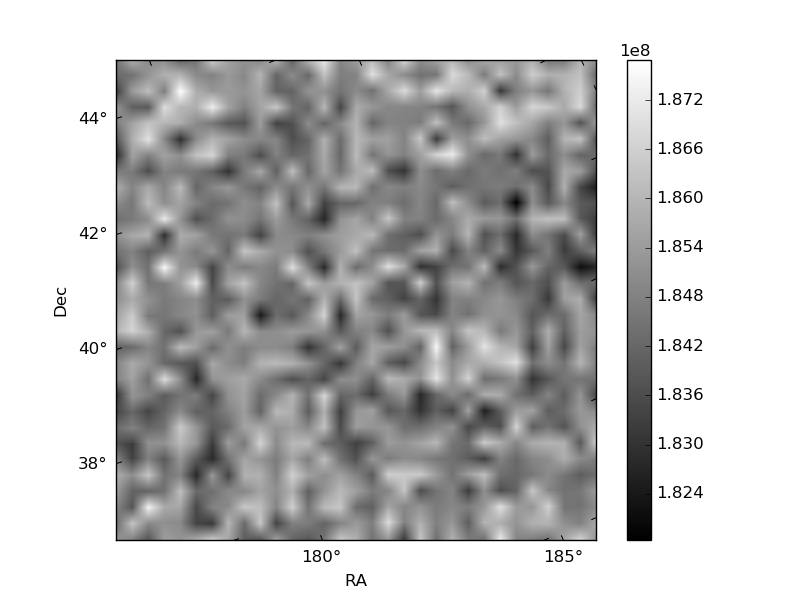
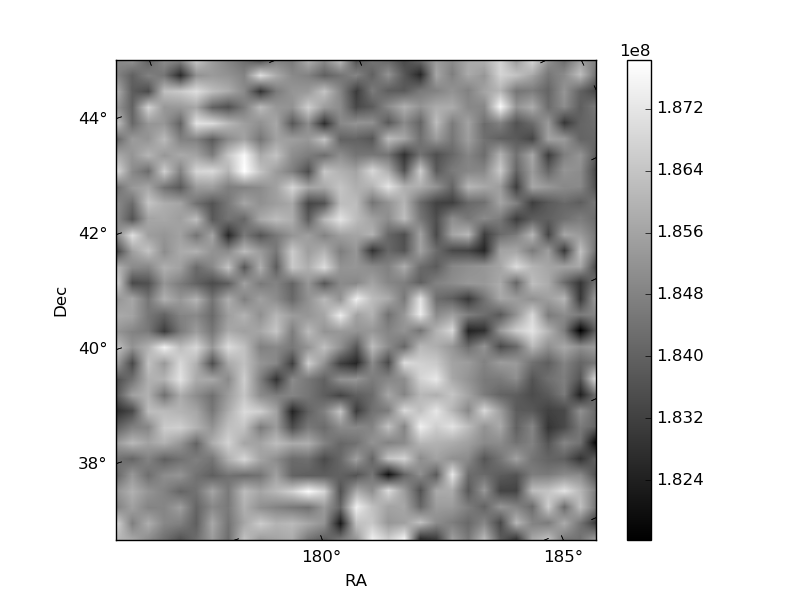
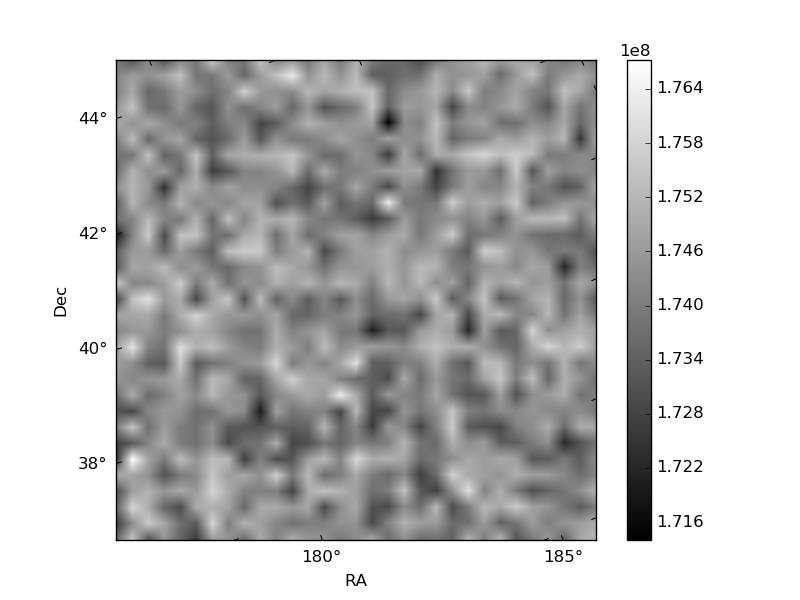
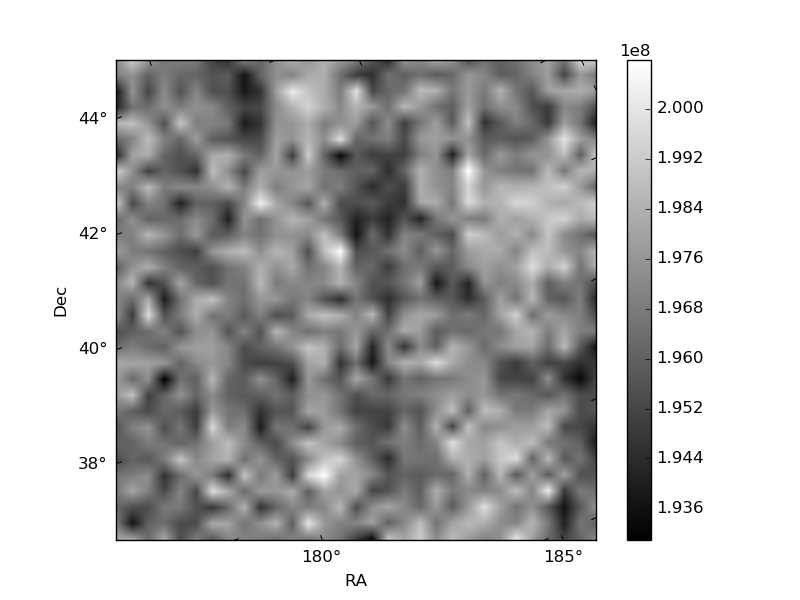
Histogram calculated using DETX and DETY for each event in the final _common_clean file
| Quadrant A | 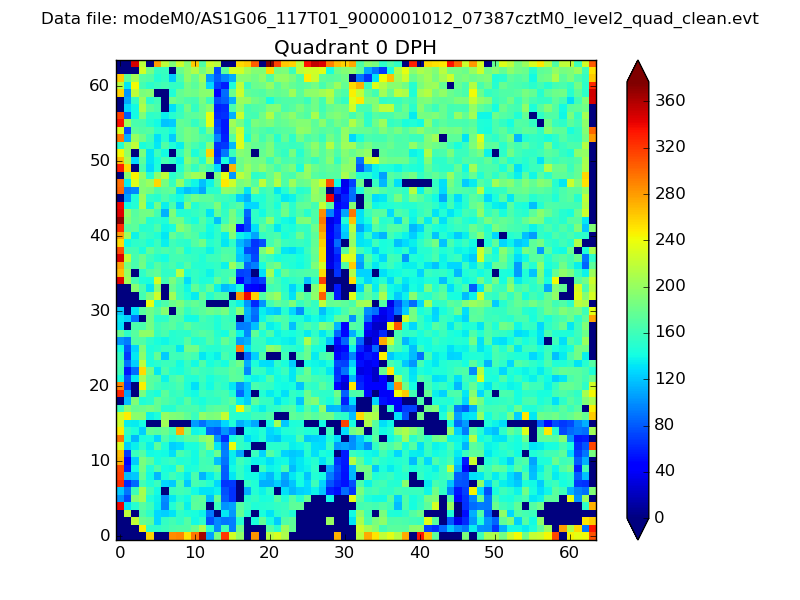 |
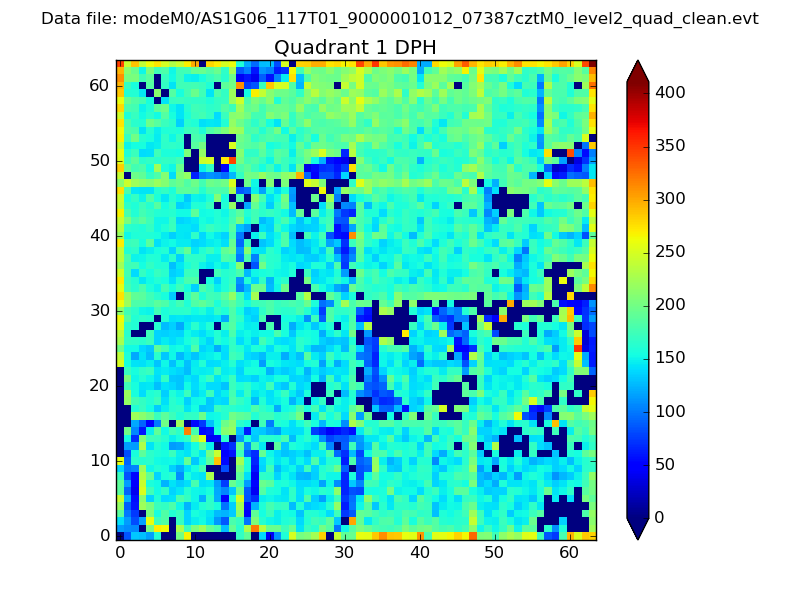 |
Quadrant B |
|---|---|---|---|
| Quadrant D | 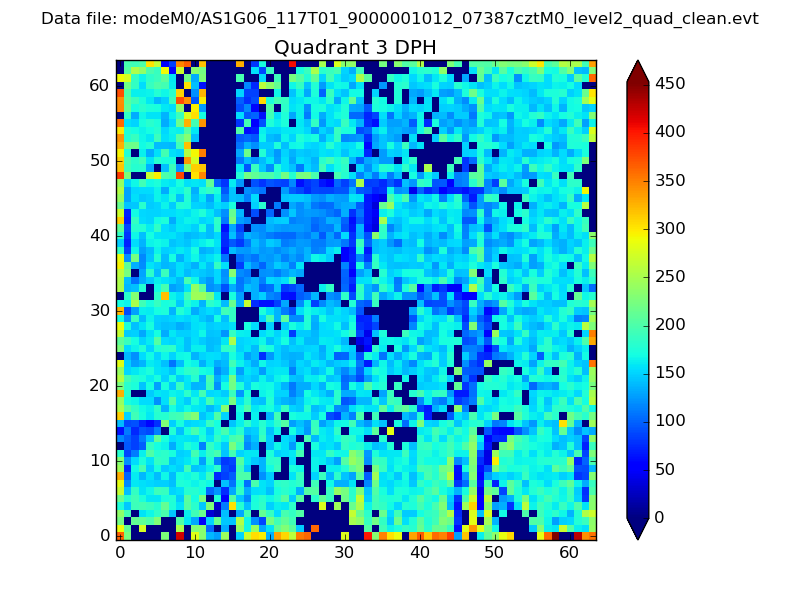 |
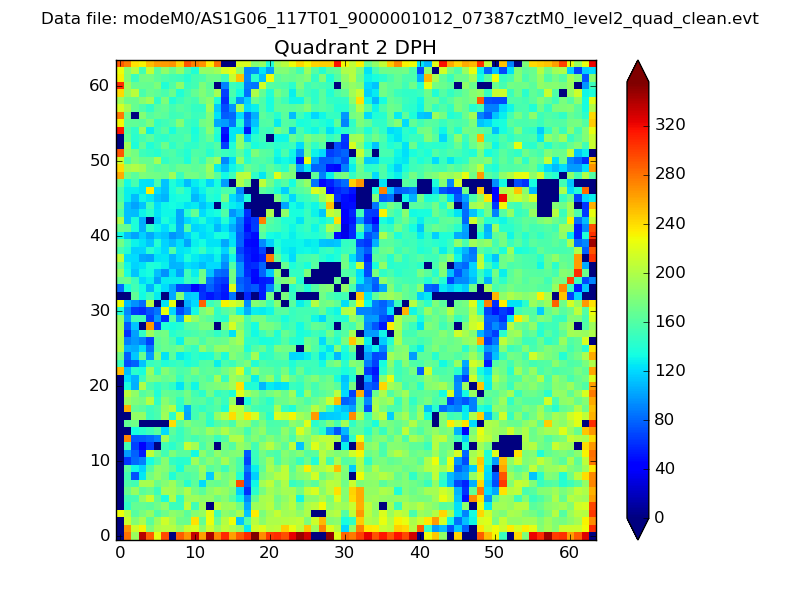 |
Quadrant C |
| Plot type | Count rate plots | Images |
|---|---|---|
| Comparison with Poisson distribution Blue bars denote a histogram of data divided into 1 sec bins. Red curve is a Poisson curve with rate = median count rate of data. |
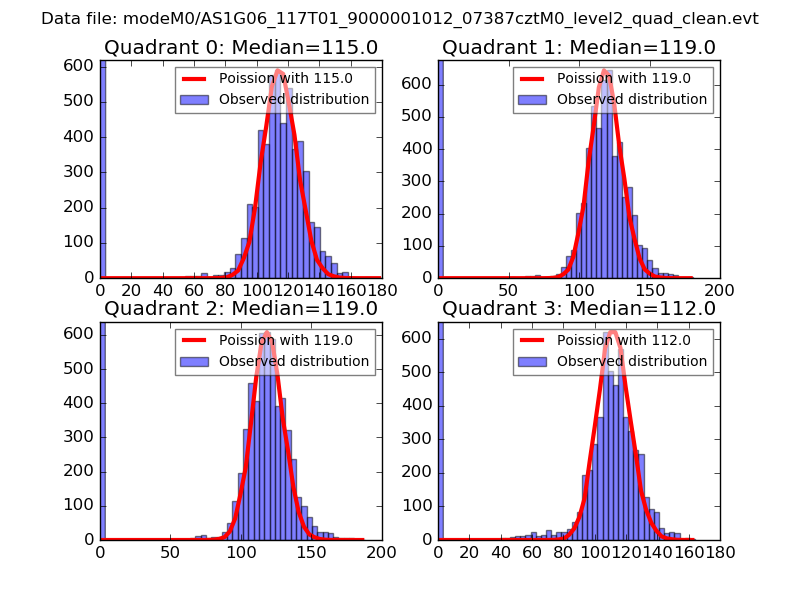 |
 |
| Quadrant-wise count rates Data is divided into 100 sec bins |
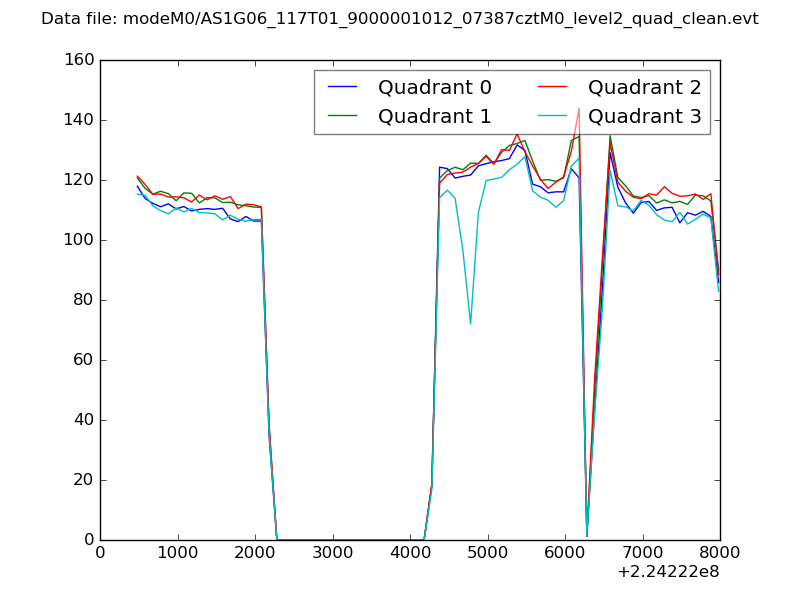 |
|
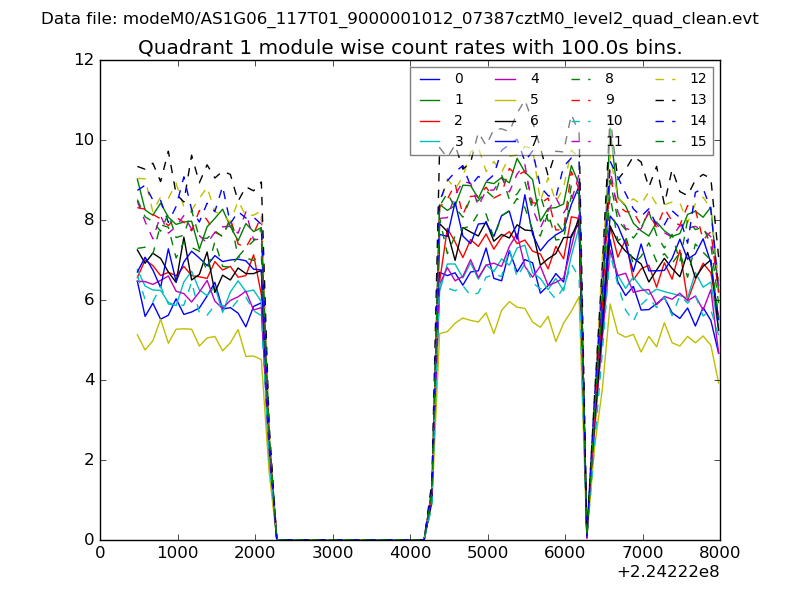
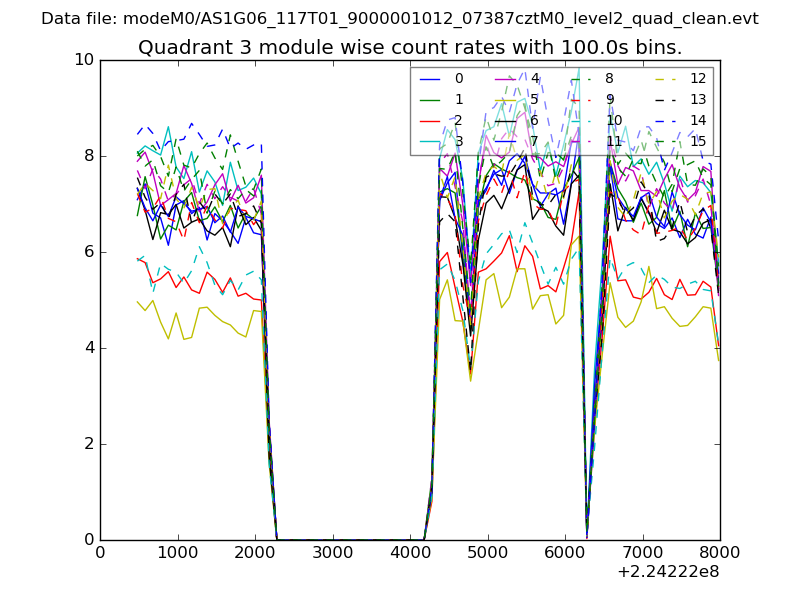
| Module-wise count rates for Quadrant A Data is divided into 100 sec bins |
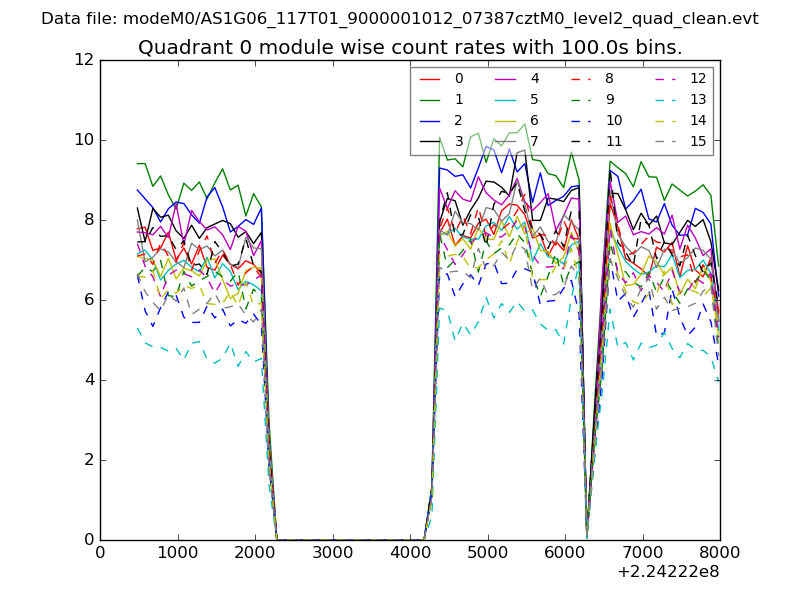 |
 |
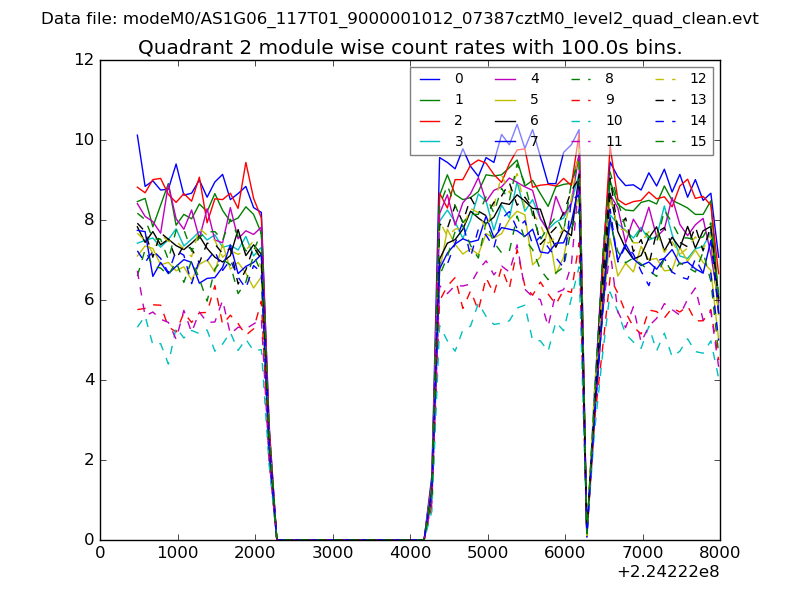
| Module-wise count rates for Quadrant B Data is divided into 100 sec bins |
 |
 |
| Module-wise count rates for Quadrant C Data is divided into 100 sec bins |
 |
 |
| Module-wise count rates for Quadrant D Data is divided into 100 sec bins |
 |
 |
| Parameter | Plot |
|---|---|
| CZT HV Monitor | 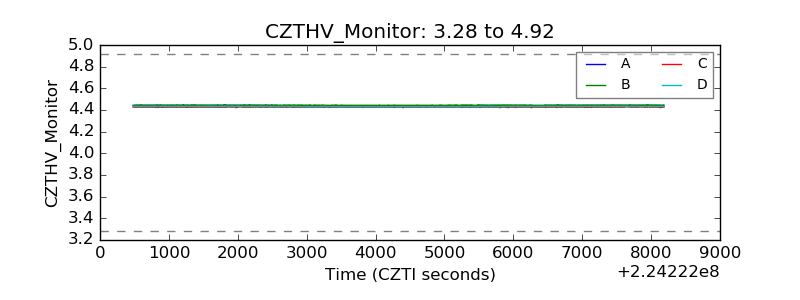 |
| D_VDD | 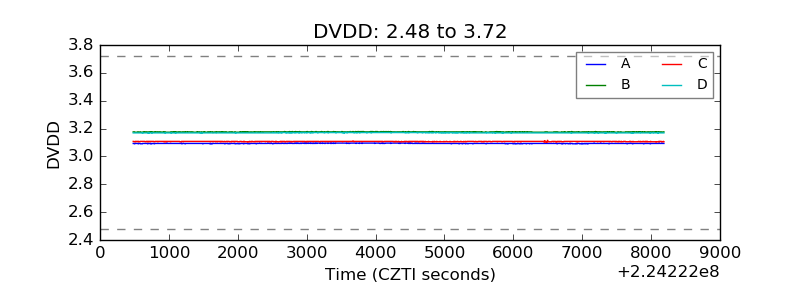 |
| Temperature 1 | 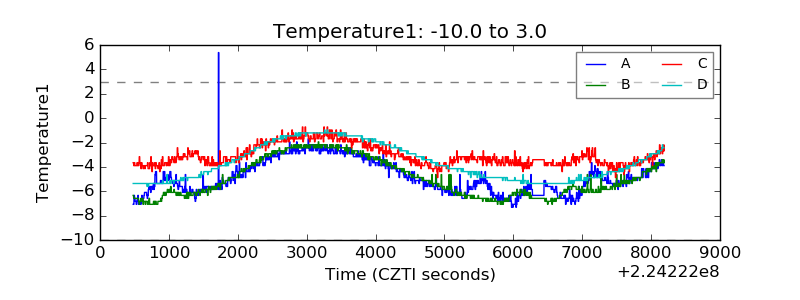 |
| Veto HV Monitor | 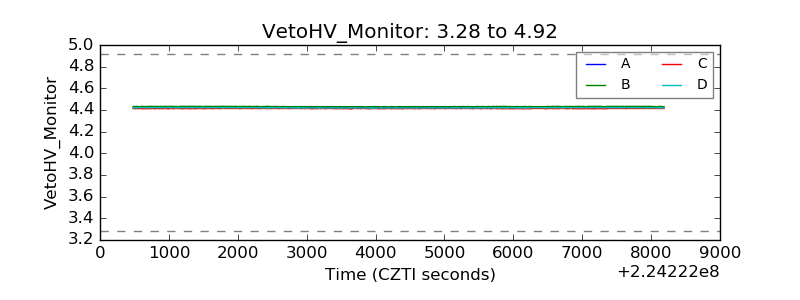 |
| Veto LLD | 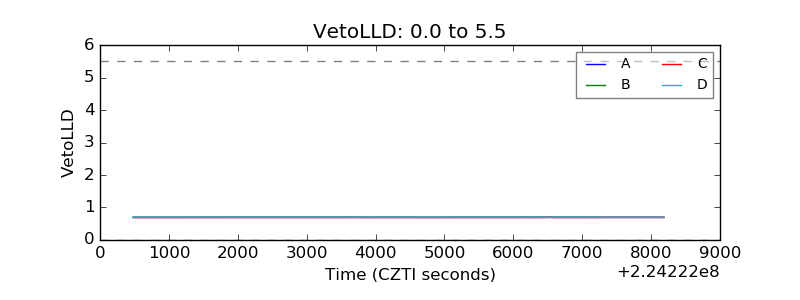 |
| Alpha Counter | 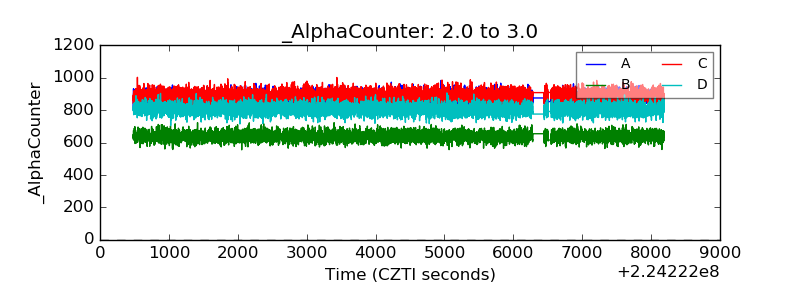 |
| _CPM_Rate | 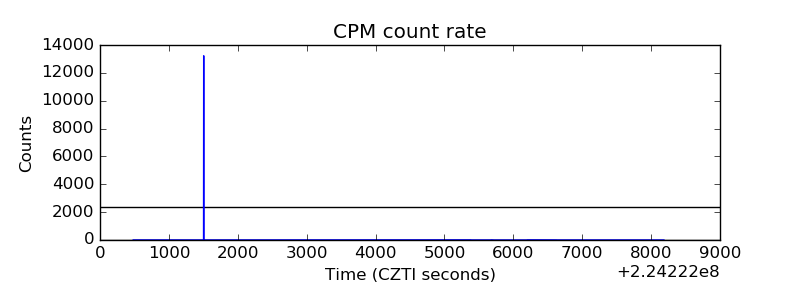 |
| CZT Counter | 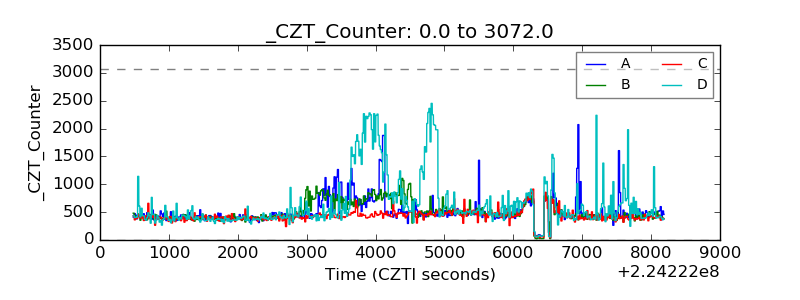 |
| +2.5 Volts monitor |  |
| +5 Volts monitor |  |
| _ROLL_ROT |  |
| _Roll_DEC | 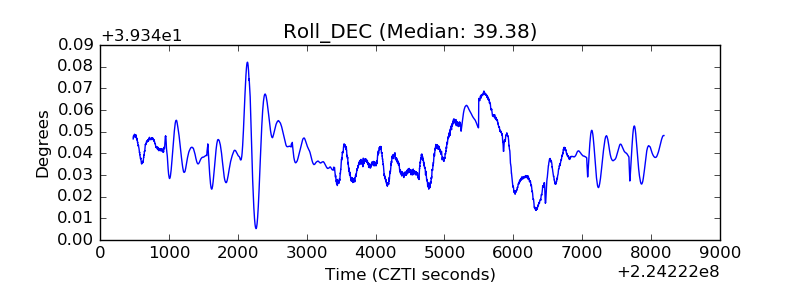 |
| _Roll_RA | 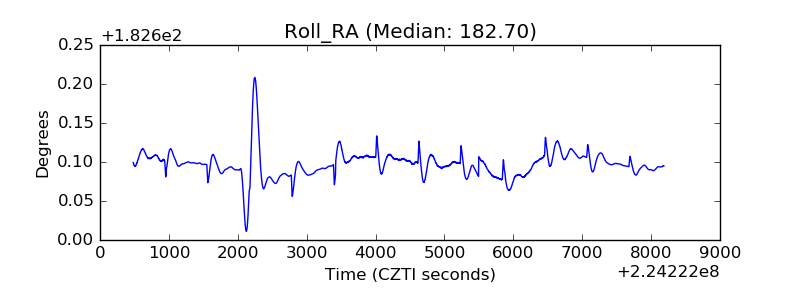 |
| Veto Counter | 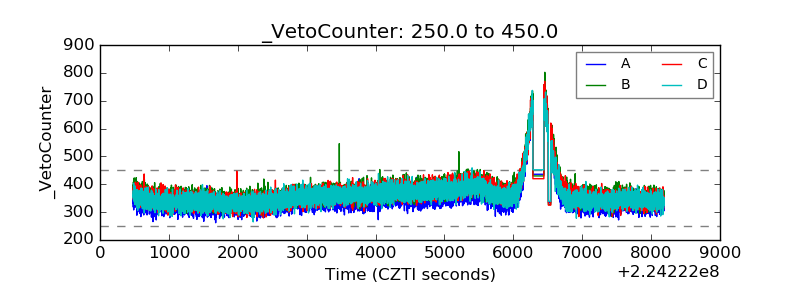 |