| Param | Original file | Final file |
|---|---|---|
| Filename | modeM0/AS1G06_117T01_9000001012_07390cztM0_level2.evt | modeM0/AS1G06_117T01_9000001012_07390cztM0_level2_quad_clean.evt |
| Size (bytes) | 821,358,720 | 126,676,800 |
| Size | 783.3 MB | 120.8 MB |
| Events in quadrant A | 6,378,768 | 756,309 |
| Events in quadrant B | 5,834,505 | 777,163 |
| Events in quadrant C | 5,372,441 | 770,818 |
| Events in quadrant D | 6,497,328 | 723,046 |
| Mode M9 | |||
|---|---|---|---|
| Quadrant | BADHDUFLAG | Total packets | Discarded packets |
| A | 0 | 16 | 4 |
| B | 0 | 16 | 2 |
| C | 0 | 16 | 3 |
| D | 0 | 18 | 7 |
| Mode M0 | |||
|---|---|---|---|
| Quadrant | BADHDUFLAG | Total packets | Discarded packets |
| A | 0 | 28905 | 2124 |
| B | 0 | 27090 | 2115 |
| C | 0 | 26306 | 2097 |
| D | 0 | 30108 | 2730 |
| Mode SS | |||
|---|---|---|---|
| Quadrant | BADHDUFLAG | Total packets | Discarded packets |
| A | 0 | 257 | 21 |
| B | 0 | 257 | 23 |
| C | 0 | 258 | 24 |
| D | 0 | 257 | 19 |
| Quadrant | Total seconds | Saturated seconds | Saturation percentage |
|---|---|---|---|
| A | 11692 | 144 | 1.231611% |
| B | 11685 | 201 | 1.720154% |
| C | 11727 | 117 | 0.997698% |
| D | 11619 | 228 | 1.962303% |
Noise dominated data is calculated using 1-second bins in cleaned event files. If a bin has >2000 counts, and if more than 50% of those come from <1% of pixels, then it is considered to be noise-dominated and hence unusable.
| Quadrant | # 1 sec bins | Bins with >0 counts | Bins with >2000 counts | High rate bins dominated by noise | Noise dominated (total time) | Noise dominated (detector-on time) | Marked lightcurve |
|---|---|---|---|---|---|---|---|
| A | 14211 | 11940 | 34 | 34 | 0.24% | 0.28% | 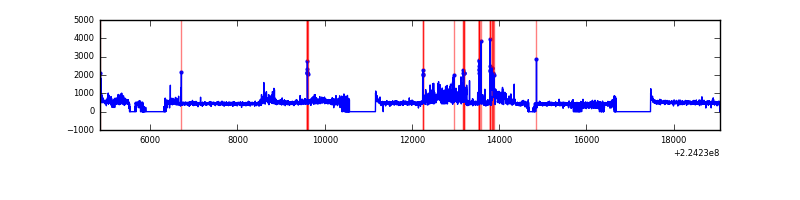 |
| B | 14212 | 11934 | 100 | 100 | 0.70% | 0.84% | 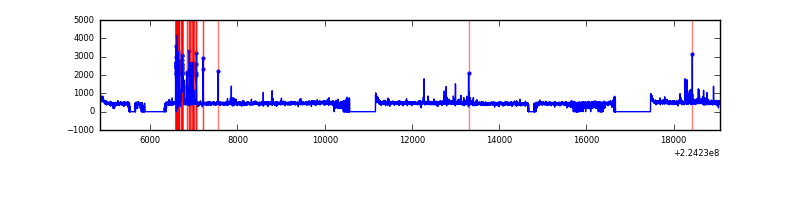 |
| C | 14212 | 11968 | 41 | 41 | 0.29% | 0.34% | 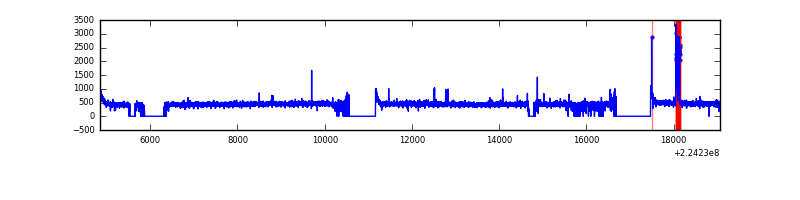 |
| D | 14212 | 11884 | 111 | 111 | 0.78% | 0.93% |  |
Top three noisy pixels from each quadrant. If the there are fewer than three noisy pixels in the level2.evt file, extra rows are filled as -1
| Pixel properties | Quadrant properties | ||||||
|---|---|---|---|---|---|---|---|
| Quadrant | DetID | PixID | Counts | Sigma | Mean | Median | Sigma |
| A | 0 | 23 | 802601 | 2852.02 | 1366 | 1335 | 280.9 |
| A | 0 | 128 | 202666 | 716.62 | 1366 | 1335 | 280.9 |
| A | 0 | 226 | 68162 | 237.86 | 1366 | 1335 | 280.9 |
| B | 11 | 51 | 355185 | 1344.19 | 1375 | 1342 | 263.2 |
| B | 0 | 214 | 116217 | 436.39 | 1375 | 1342 | 263.2 |
| B | 12 | 111 | 27474 | 99.27 | 1375 | 1342 | 263.2 |
| C | 9 | 68 | 136888 | 436.42 | 1333 | 1338 | 310.6 |
| C | 1 | 16 | 31281 | 96.41 | 1333 | 1338 | 310.6 |
| C | 13 | 61 | 10510 | 29.53 | 1333 | 1338 | 310.6 |
| D | 2 | 216 | 664062 | 2037.43 | 1318 | 1273 | 325.3 |
| D | 14 | 34 | 271267 | 829.97 | 1318 | 1273 | 325.3 |
| D | 5 | 233 | 220437 | 673.72 | 1318 | 1273 | 325.3 |
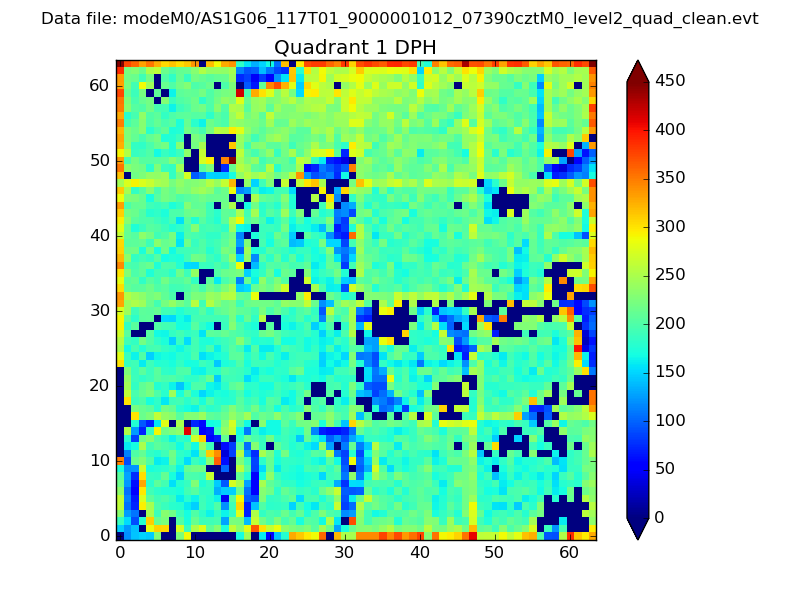
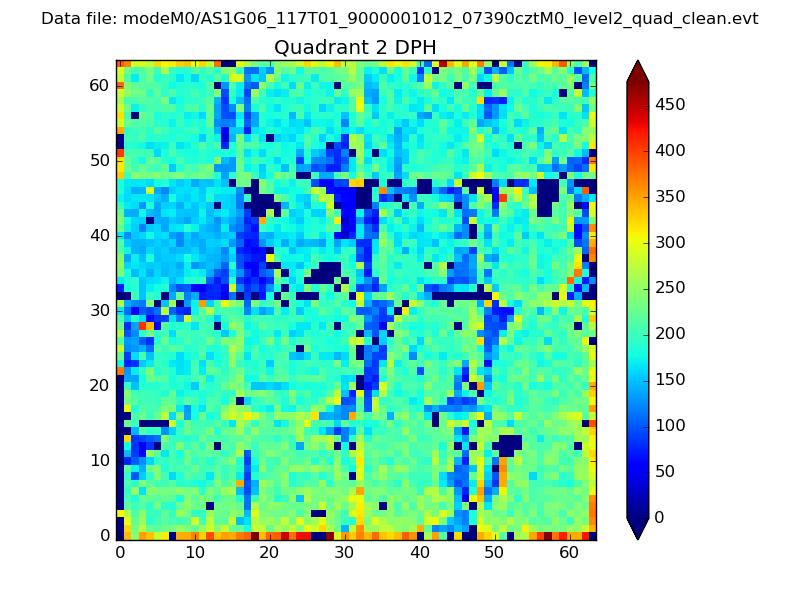
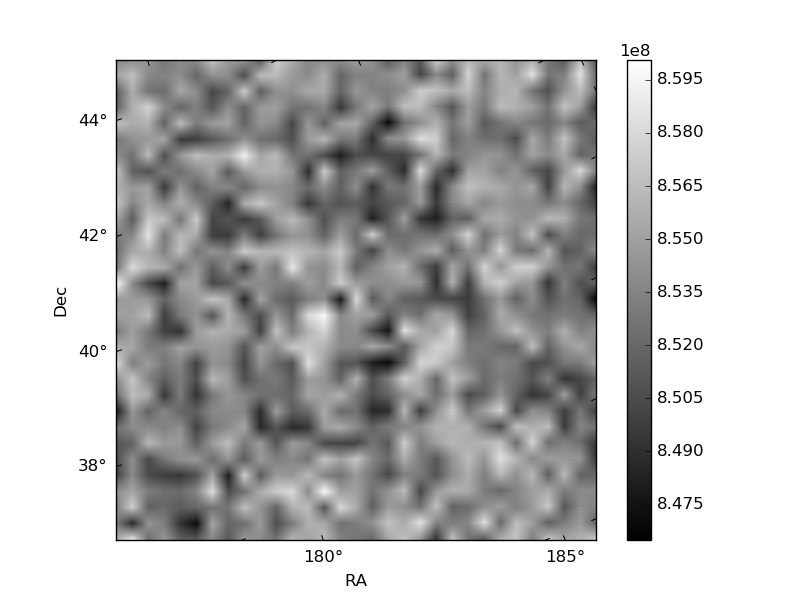
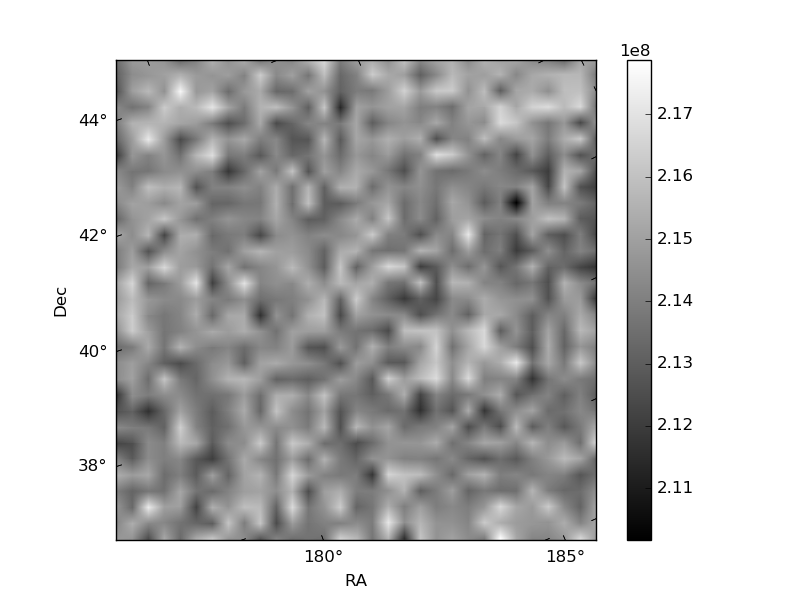
Histogram calculated using DETX and DETY for each event in the final _common_clean file
| Quadrant A | 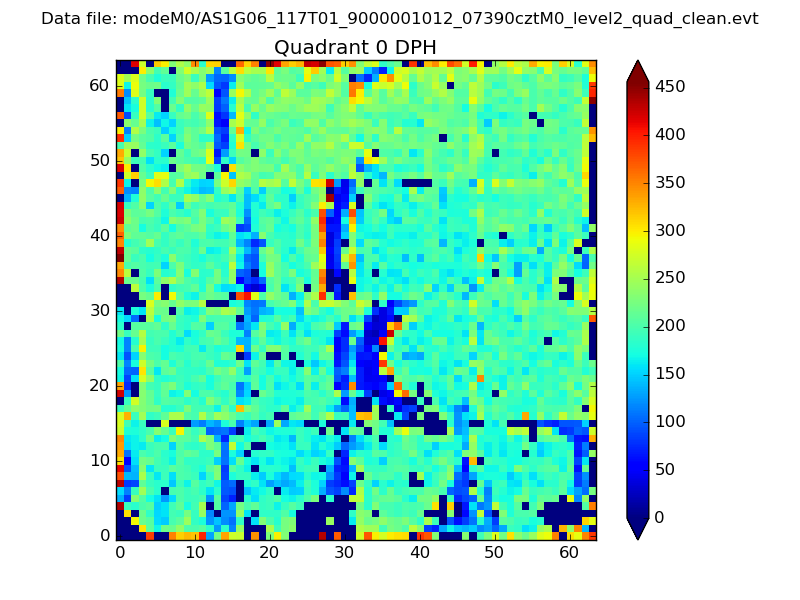 |
 |
Quadrant B |
|---|---|---|---|
| Quadrant D | 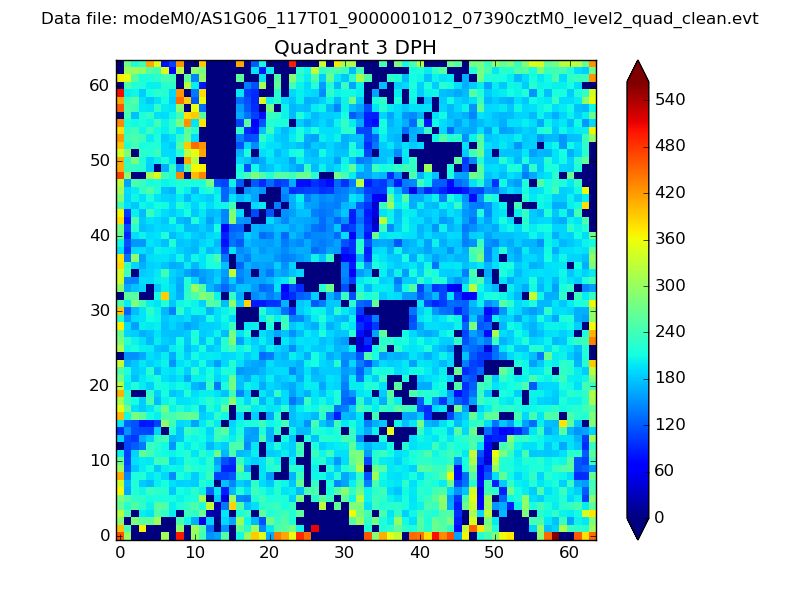 |
 |
Quadrant C |
| Plot type | Count rate plots | Images |
|---|---|---|
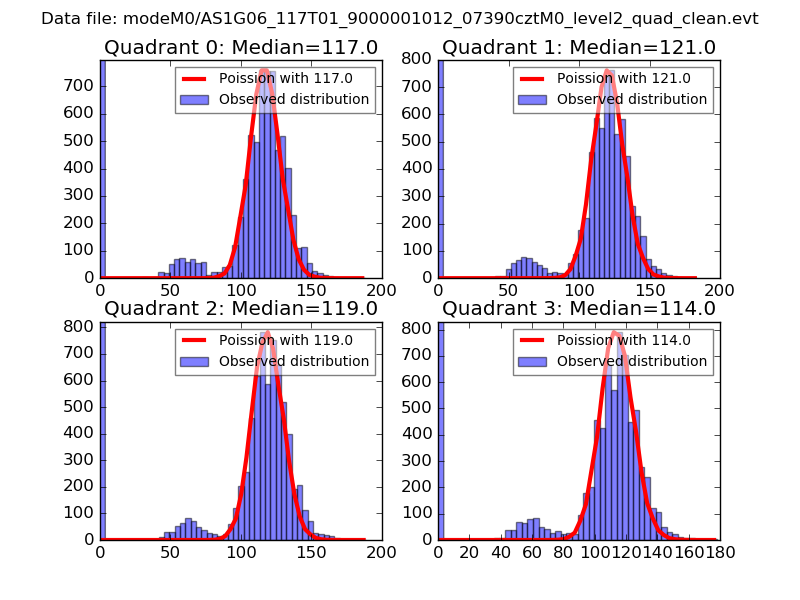
| Comparison with Poisson distribution Blue bars denote a histogram of data divided into 1 sec bins. Red curve is a Poisson curve with rate = median count rate of data. |
 |
 |
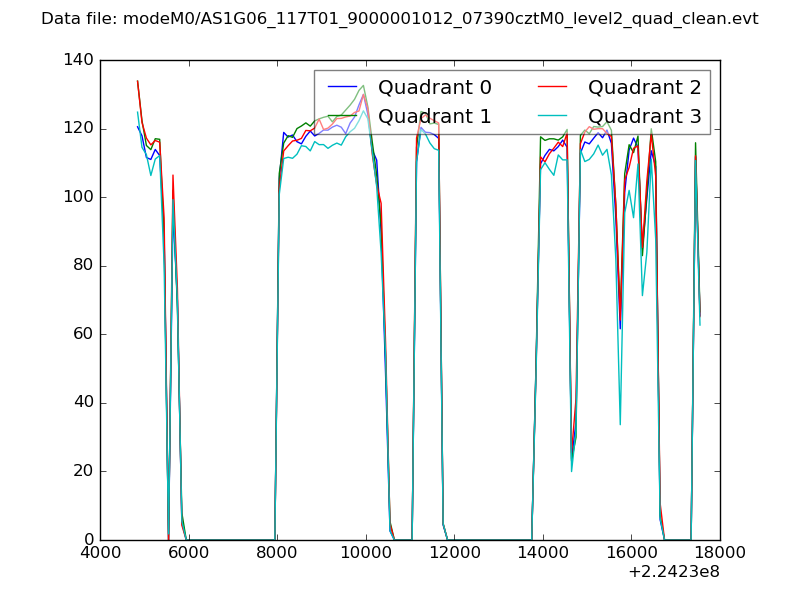
| Quadrant-wise count rates Data is divided into 100 sec bins |
 |
|
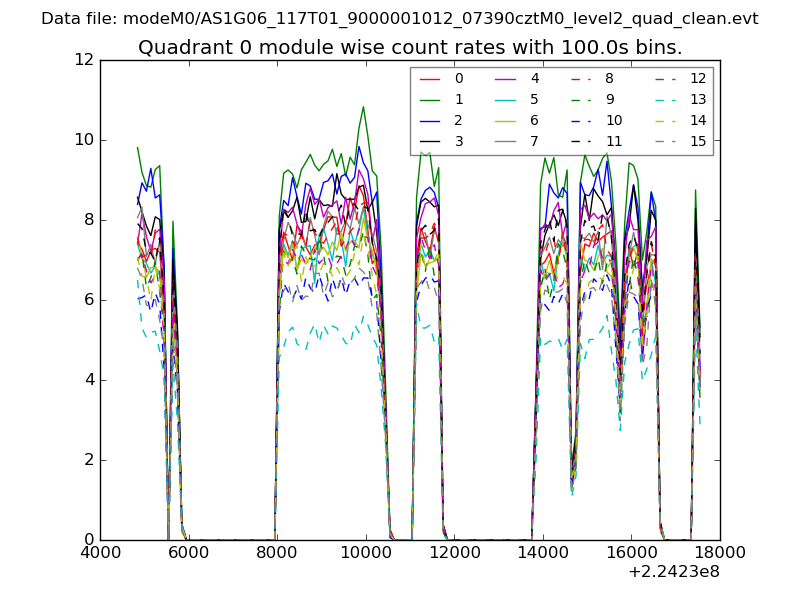
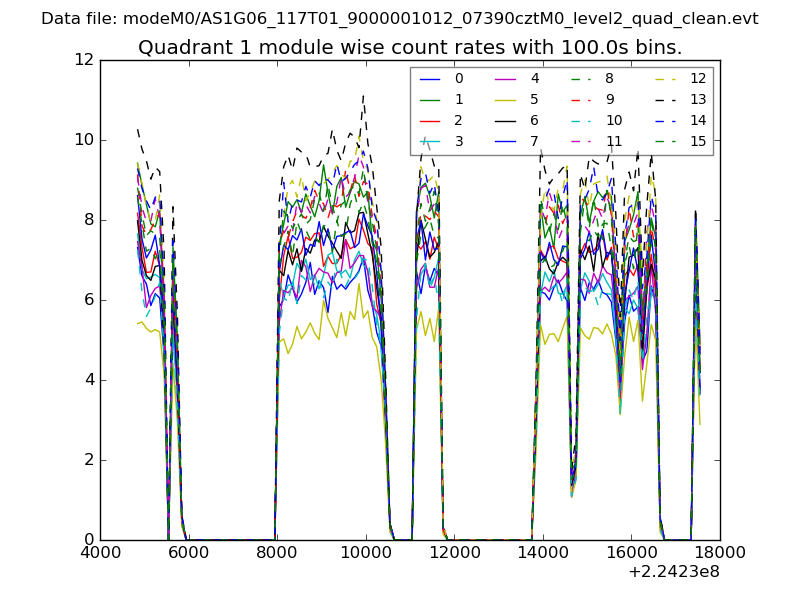
| Module-wise count rates for Quadrant A Data is divided into 100 sec bins |
 |
 |
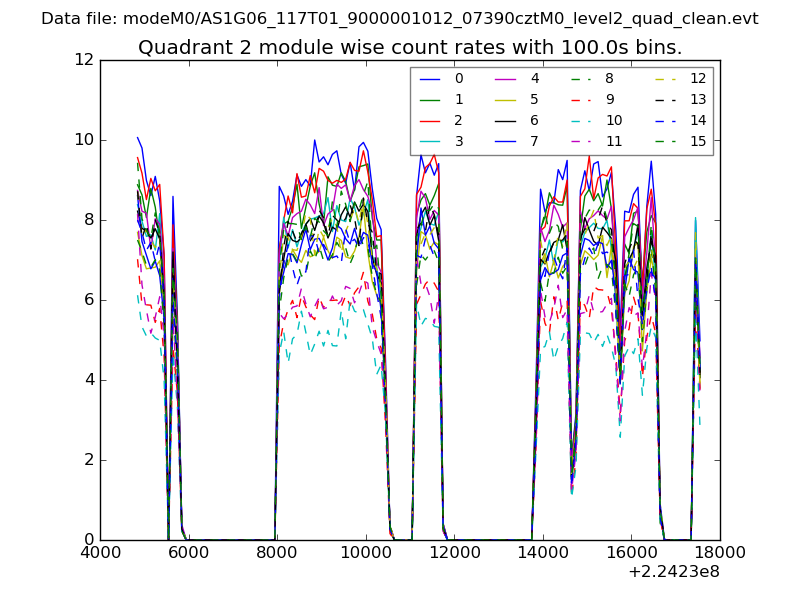
| Module-wise count rates for Quadrant B Data is divided into 100 sec bins |
 |
 |
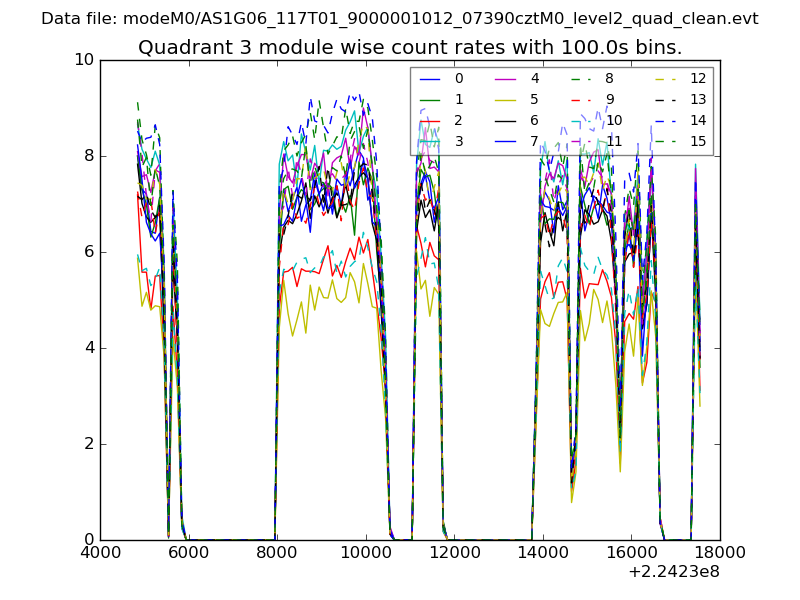
| Module-wise count rates for Quadrant C Data is divided into 100 sec bins |
 |
 |
| Module-wise count rates for Quadrant D Data is divided into 100 sec bins |
 |
 |
| Parameter | Plot |
|---|---|
| CZT HV Monitor | 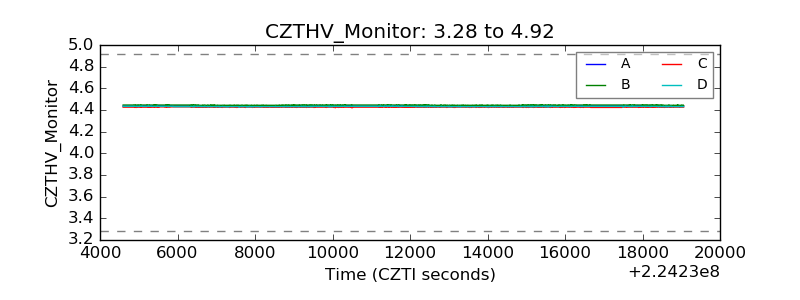 |
| D_VDD | 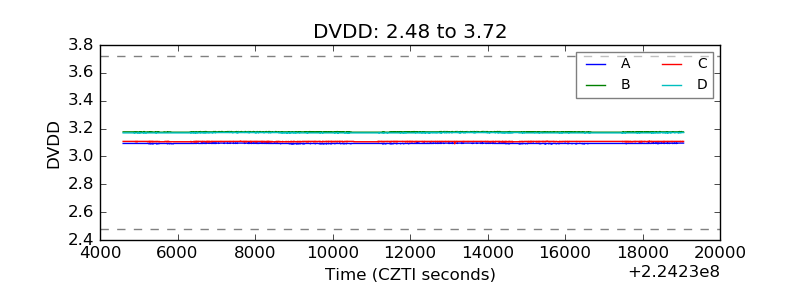 |
| Temperature 1 | 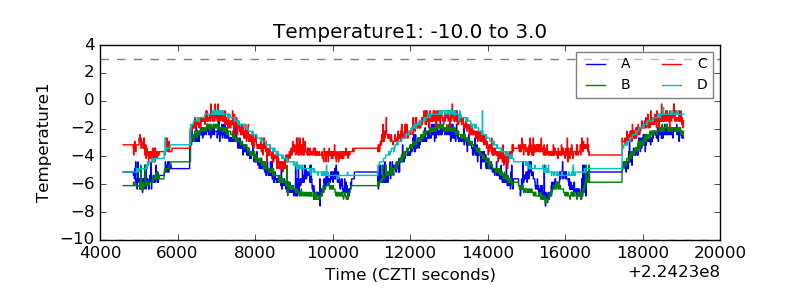 |
| Veto HV Monitor | 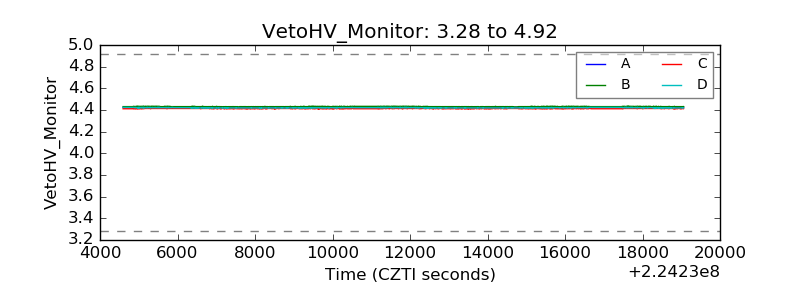 |
| Veto LLD | 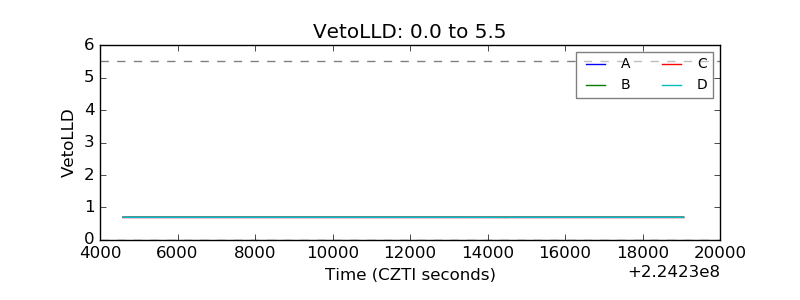 |
| Alpha Counter | 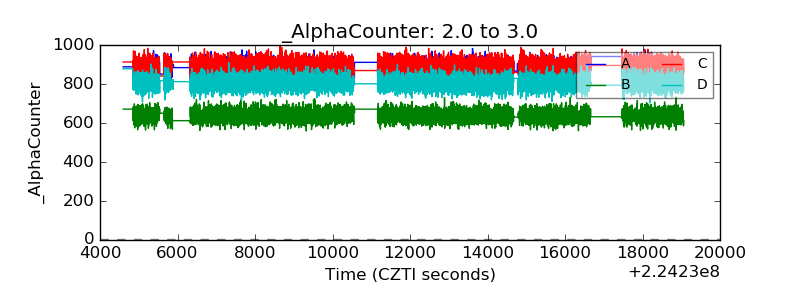 |
| _CPM_Rate | 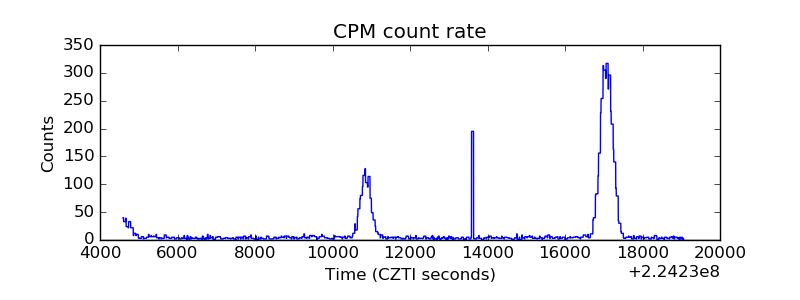 |
| CZT Counter | 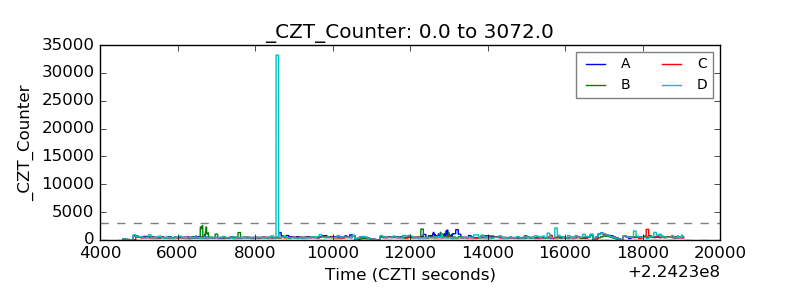 |
| +2.5 Volts monitor |  |
| +5 Volts monitor |  |
| _ROLL_ROT | 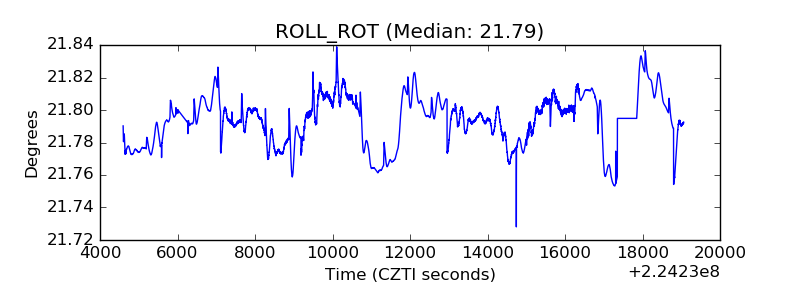 |
| _Roll_DEC | 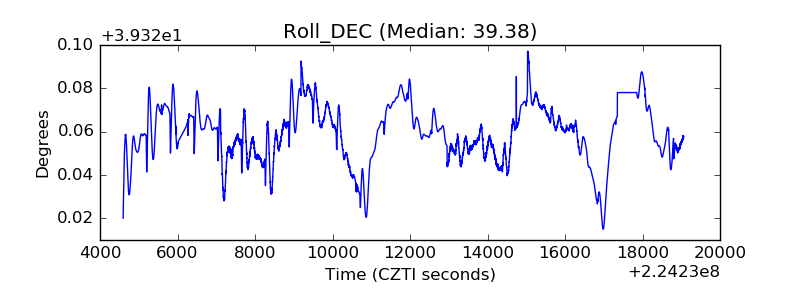 |
| _Roll_RA | 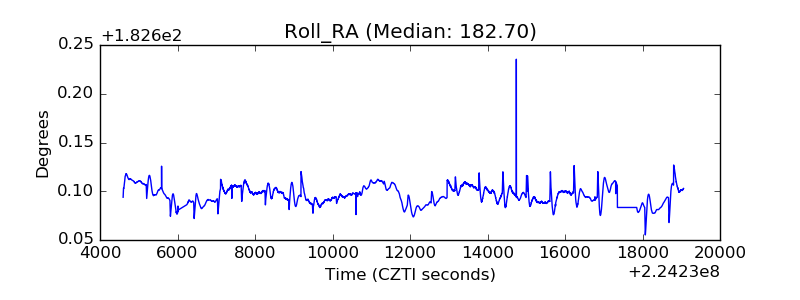 |
| Veto Counter | 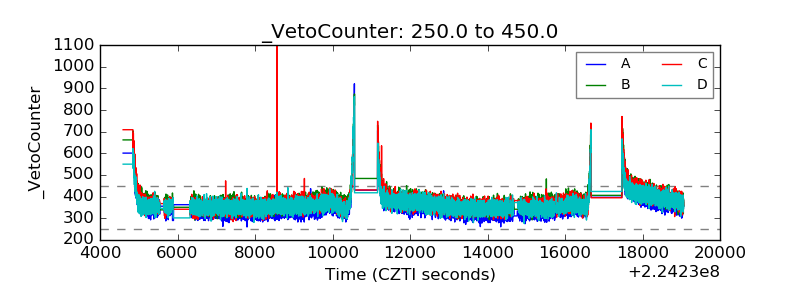 |