| Param | Original file | Final file |
|---|---|---|
| Filename | modeM0/AS1G06_117T01_9000001012_07393cztM0_level2.evt | modeM0/AS1G06_117T01_9000001012_07393cztM0_level2_quad_clean.evt |
| Size (bytes) | 989,605,440 | 152,807,040 |
| Size | 943.8 MB | 145.7 MB |
| Events in quadrant A | 7,181,716 | 921,383 |
| Events in quadrant B | 6,842,328 | 935,386 |
| Events in quadrant C | 6,656,675 | 923,728 |
| Events in quadrant D | 8,340,252 | 878,555 |
| Mode M9 | |||
|---|---|---|---|
| Quadrant | BADHDUFLAG | Total packets | Discarded packets |
| A | 0 | 34 | 2 |
| B | 0 | 35 | 3 |
| C | 0 | 35 | 1 |
| D | 0 | 34 | 2 |
| Mode M0 | |||
|---|---|---|---|
| Quadrant | BADHDUFLAG | Total packets | Discarded packets |
| A | 0 | 38239 | 7334 |
| B | 0 | 36461 | 6829 |
| C | 0 | 36210 | 6806 |
| D | 0 | 42830 | 8499 |
| Mode SS | |||
|---|---|---|---|
| Quadrant | BADHDUFLAG | Total packets | Discarded packets |
| A | 0 | 353 | 59 |
| B | 0 | 356 | 68 |
| C | 0 | 357 | 71 |
| D | 0 | 349 | 57 |
| Quadrant | Total seconds | Saturated seconds | Saturation percentage |
|---|---|---|---|
| A | 14020 | 158 | 1.126961% |
| B | 14031 | 142 | 1.012045% |
| C | 14024 | 175 | 1.247861% |
| D | 13957 | 346 | 2.479043% |
Noise dominated data is calculated using 1-second bins in cleaned event files. If a bin has >2000 counts, and if more than 50% of those come from <1% of pixels, then it is considered to be noise-dominated and hence unusable.
| Quadrant | # 1 sec bins | Bins with >0 counts | Bins with >2000 counts | High rate bins dominated by noise | Noise dominated (total time) | Noise dominated (detector-on time) | Marked lightcurve |
|---|---|---|---|---|---|---|---|
| A | 21791 | 14459 | 31 | 31 | 0.14% | 0.21% | 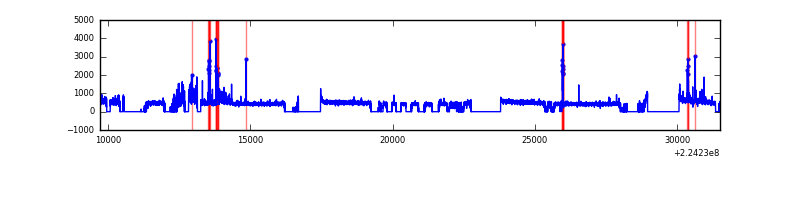 |
| B | 21789 | 14440 | 14 | 14 | 0.06% | 0.10% | 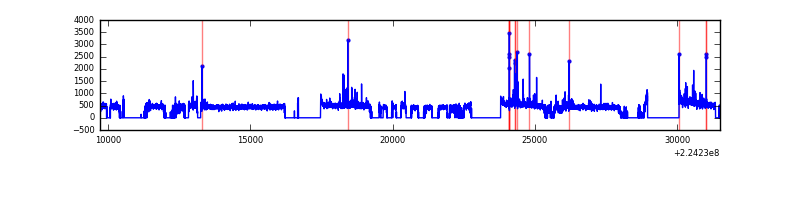 |
| C | 21789 | 14427 | 57 | 57 | 0.26% | 0.40% | 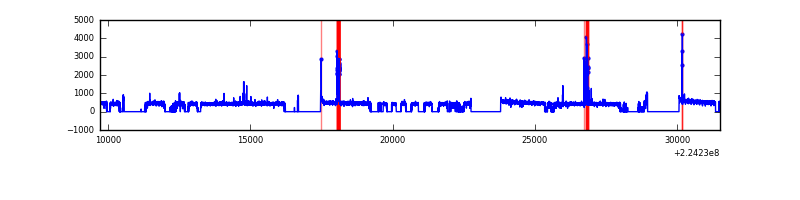 |
| D | 21787 | 14358 | 186 | 186 | 0.85% | 1.30% | 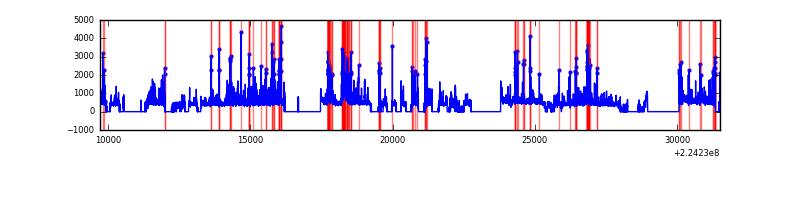 |
Top three noisy pixels from each quadrant. If the there are fewer than three noisy pixels in the level2.evt file, extra rows are filled as -1
| Pixel properties | Quadrant properties | ||||||
|---|---|---|---|---|---|---|---|
| Quadrant | DetID | PixID | Counts | Sigma | Mean | Median | Sigma |
| A | 0 | 23 | 356671 | 1036.59 | 1671 | 1635 | 342.5 |
| A | 0 | 128 | 203128 | 588.29 | 1671 | 1635 | 342.5 |
| A | 15 | 234 | 151009 | 436.12 | 1671 | 1635 | 342.5 |
| B | 0 | 214 | 210738 | 647.82 | 1689 | 1650 | 322.8 |
| B | 4 | 81 | 81016 | 245.9 | 1689 | 1650 | 322.8 |
| B | 12 | 111 | 32874 | 96.74 | 1689 | 1650 | 322.8 |
| C | 9 | 68 | 137257 | 358.31 | 1632 | 1641 | 378.5 |
| C | 1 | 16 | 132443 | 345.59 | 1632 | 1641 | 378.5 |
| C | 10 | 22 | 24283 | 59.82 | 1632 | 1641 | 378.5 |
| D | 2 | 216 | 1141449 | 2879.34 | 1612 | 1560 | 395.9 |
| D | 14 | 34 | 243382 | 610.84 | 1612 | 1560 | 395.9 |
| D | 5 | 233 | 231528 | 580.89 | 1612 | 1560 | 395.9 |
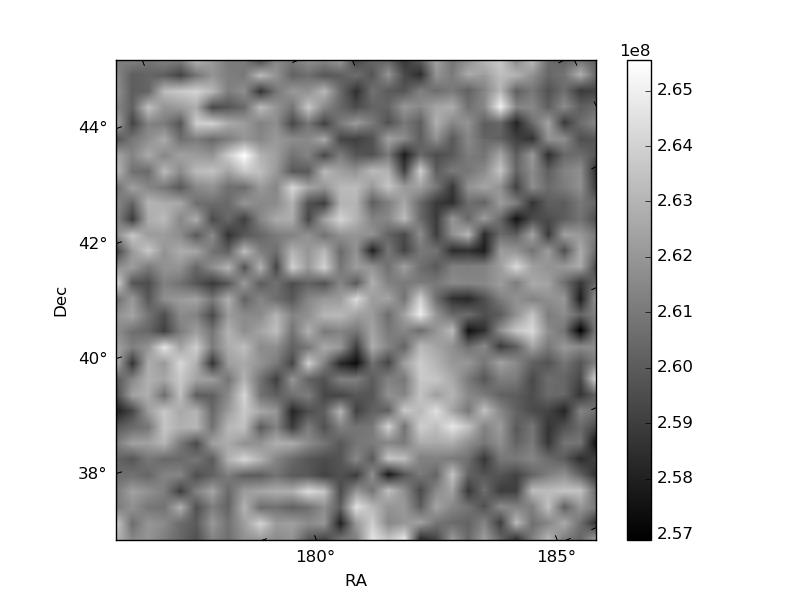
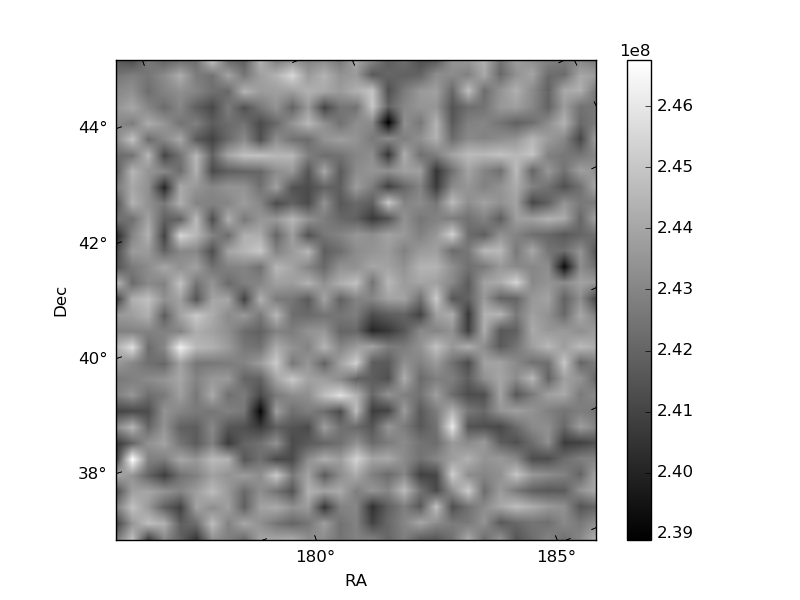
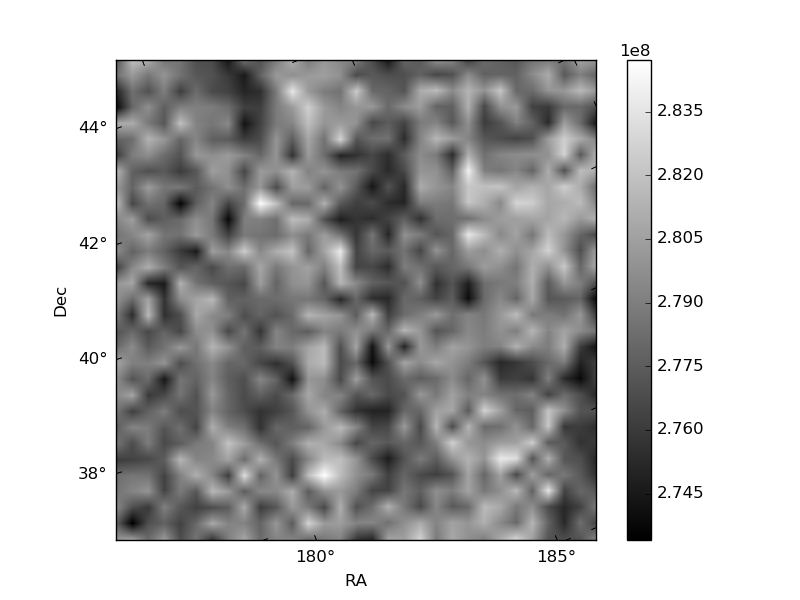
Histogram calculated using DETX and DETY for each event in the final _common_clean file
| Quadrant A | 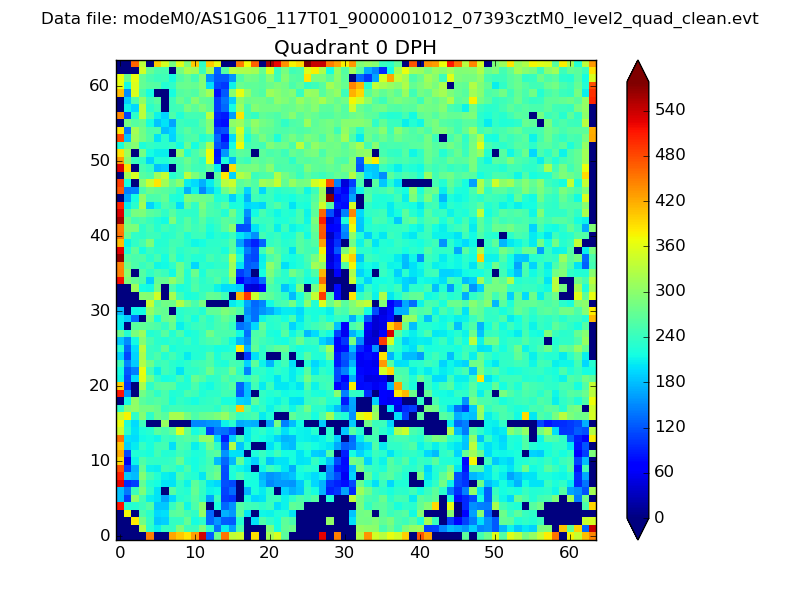 |
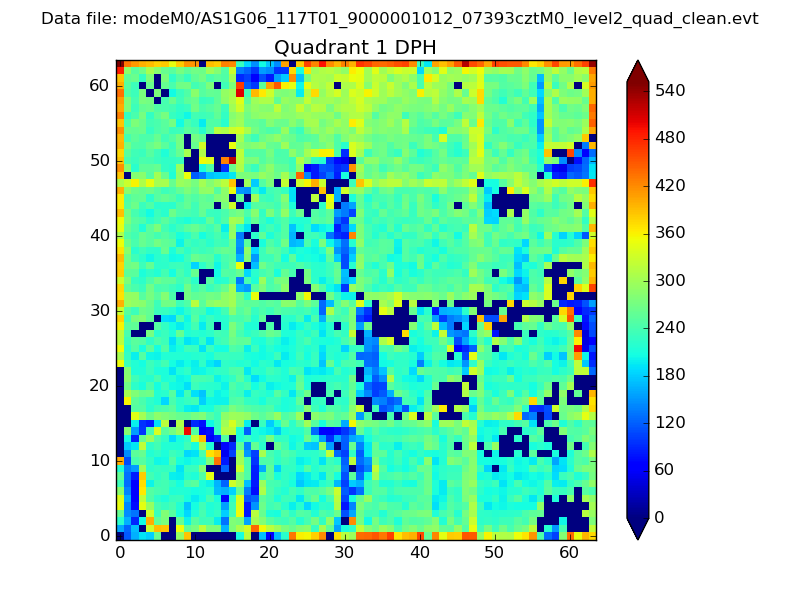 |
Quadrant B |
|---|---|---|---|
| Quadrant D | 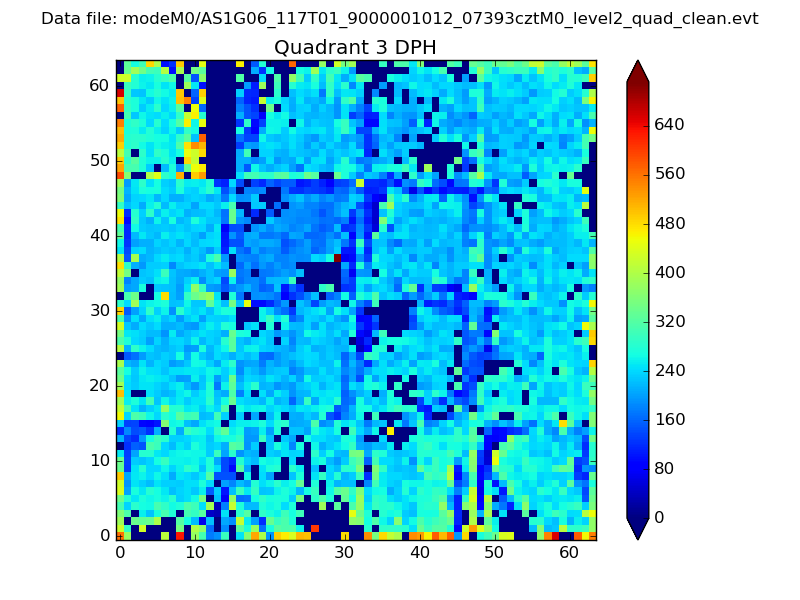 |
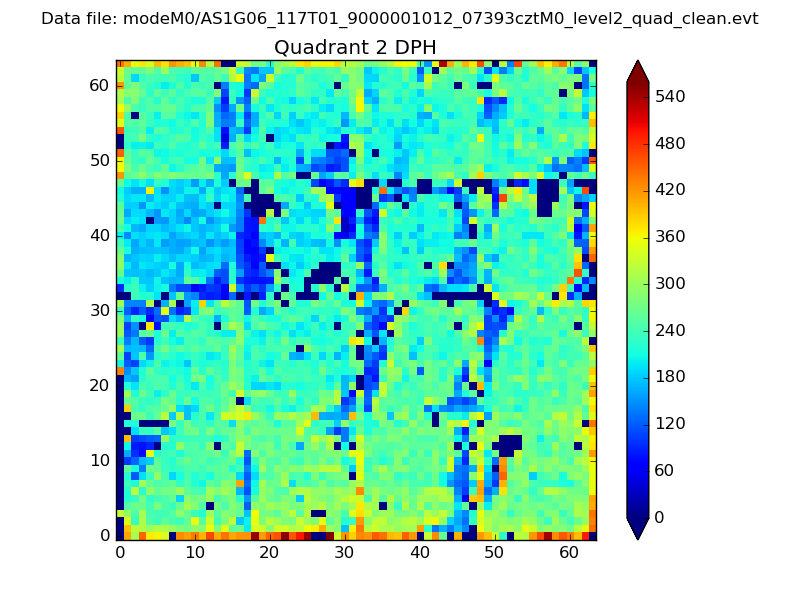 |
Quadrant C |
| Plot type | Count rate plots | Images |
|---|---|---|
| Comparison with Poisson distribution Blue bars denote a histogram of data divided into 1 sec bins. Red curve is a Poisson curve with rate = median count rate of data. |
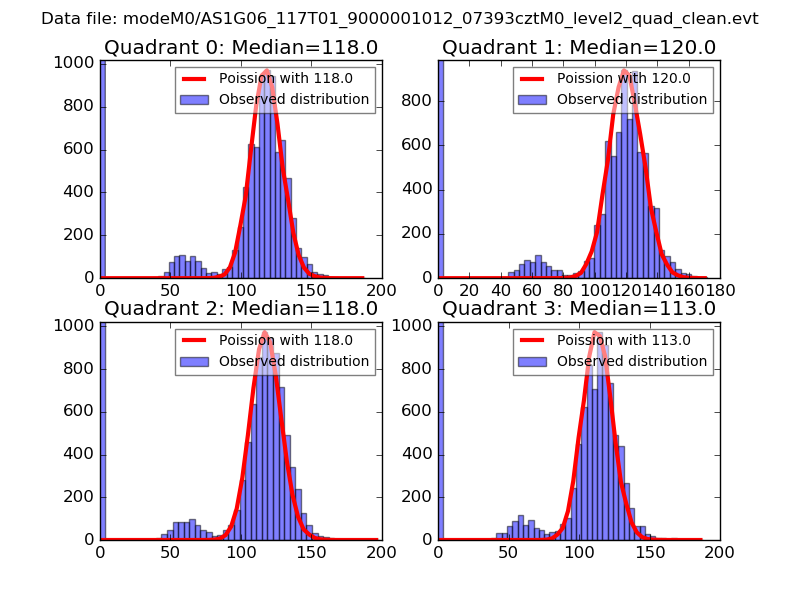 |
 |
| Quadrant-wise count rates Data is divided into 100 sec bins |
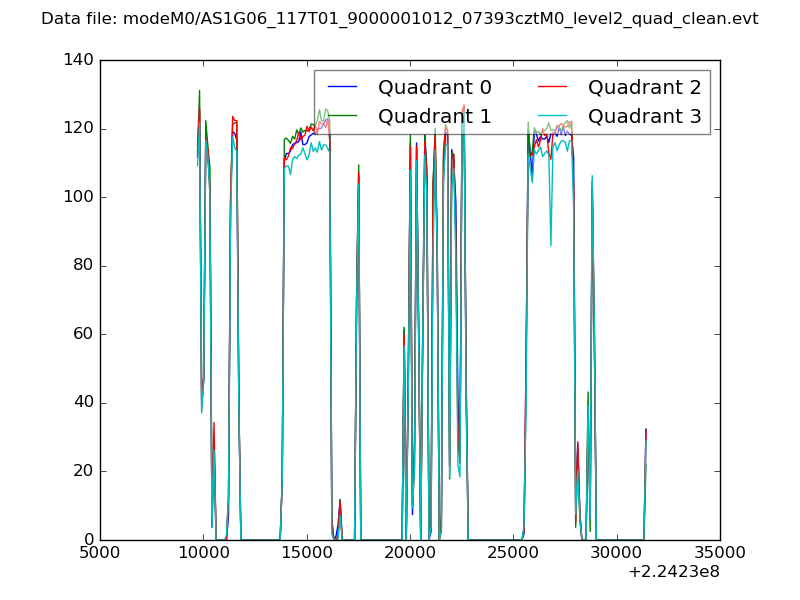 |
|
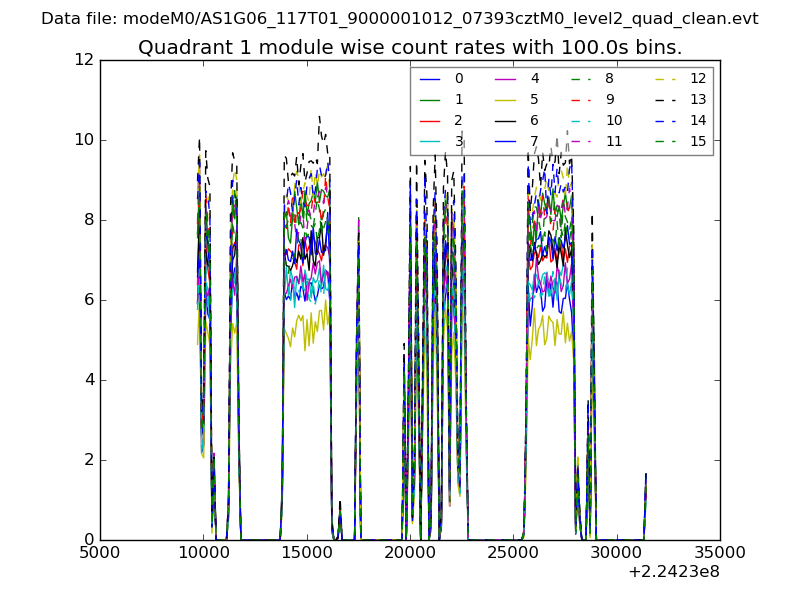
| Module-wise count rates for Quadrant A Data is divided into 100 sec bins |
 |
 |
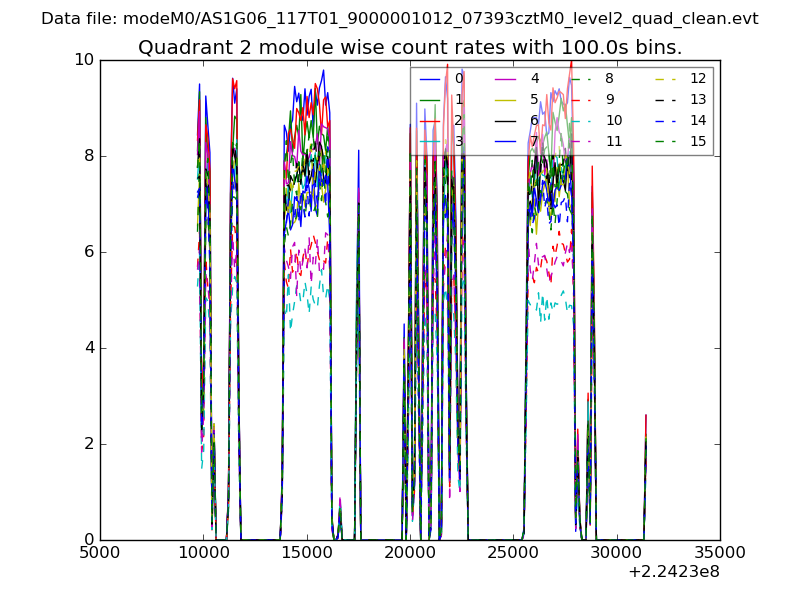
| Module-wise count rates for Quadrant B Data is divided into 100 sec bins |
 |
 |
| Module-wise count rates for Quadrant C Data is divided into 100 sec bins |
 |
 |
| Module-wise count rates for Quadrant D Data is divided into 100 sec bins |
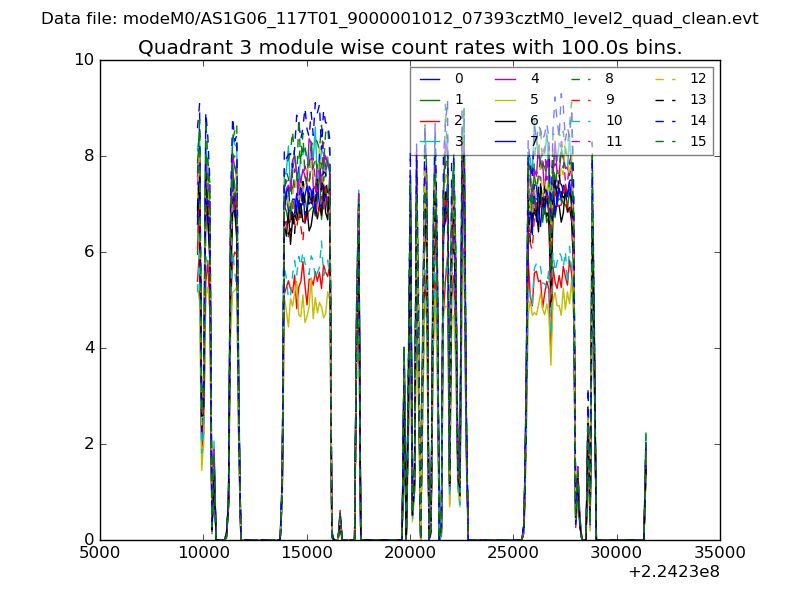 |
 |
| Parameter | Plot |
|---|---|
| CZT HV Monitor | 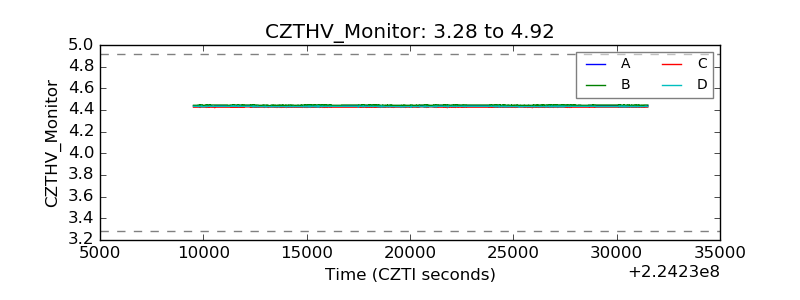 |
| D_VDD | 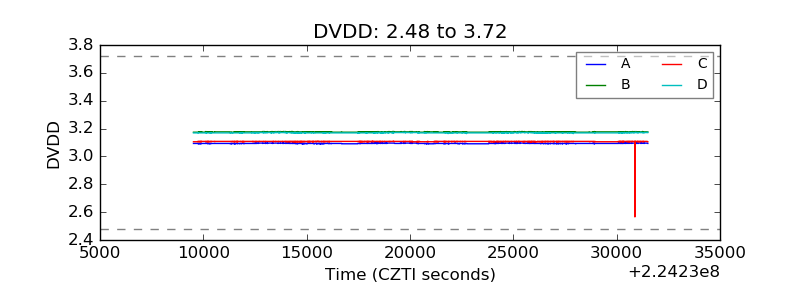 |
| Temperature 1 | 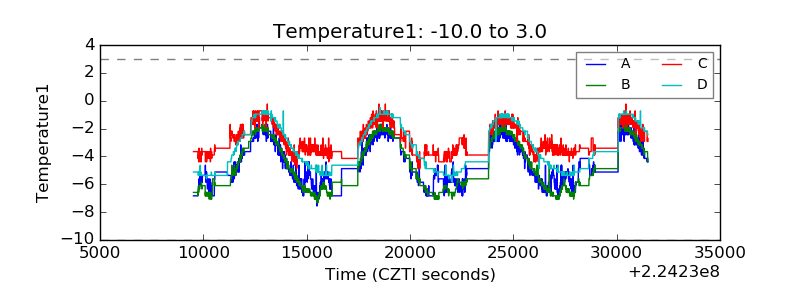 |
| Veto HV Monitor | 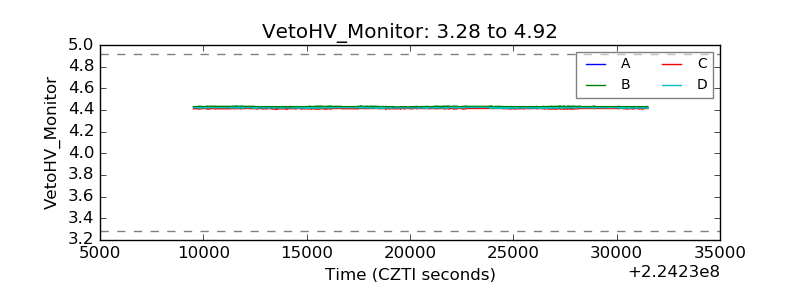 |
| Veto LLD | 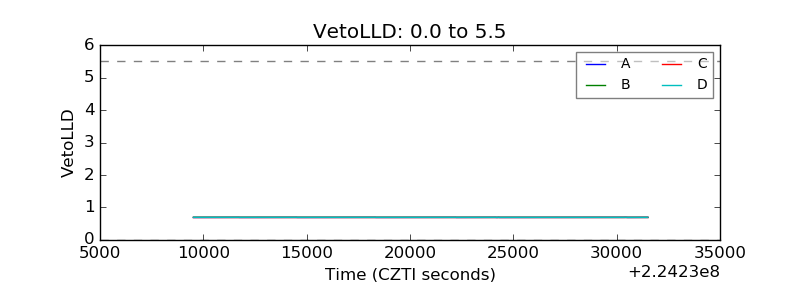 |
| Alpha Counter | 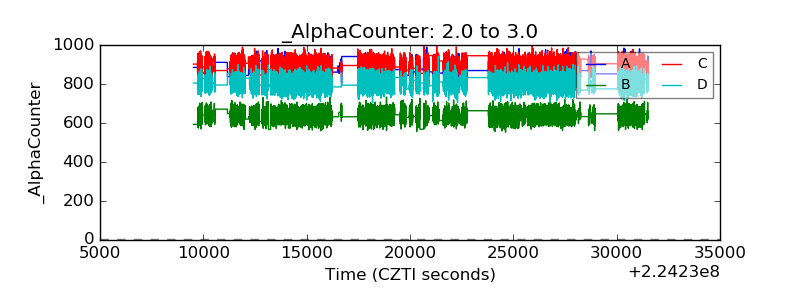 |
| _CPM_Rate | 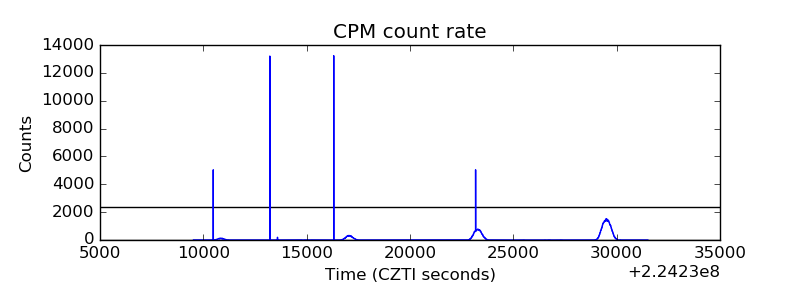 |
| CZT Counter | 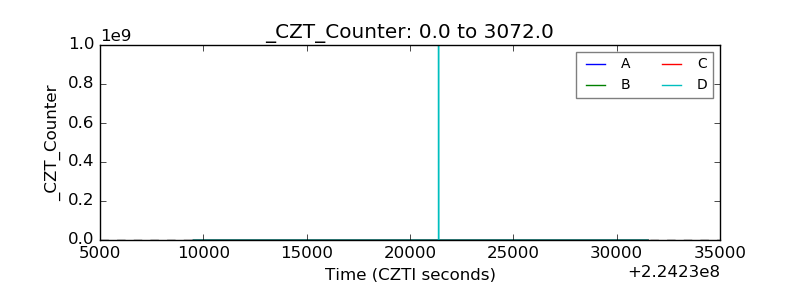 |
| +2.5 Volts monitor |  |
| +5 Volts monitor |  |
| _ROLL_ROT | 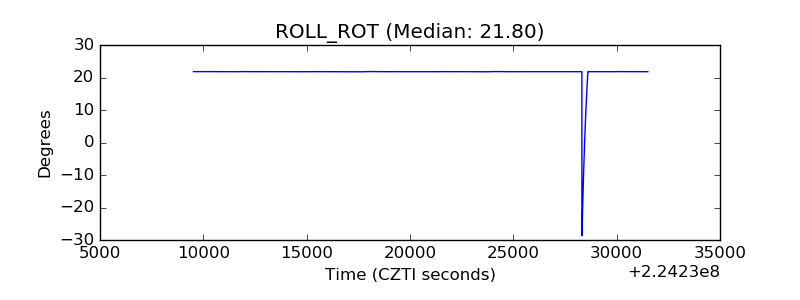 |
| _Roll_DEC | 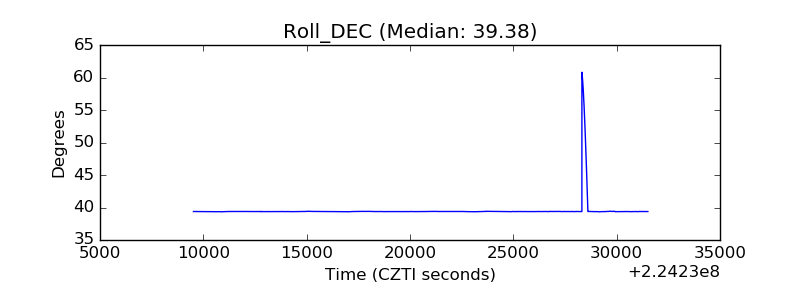 |
| _Roll_RA | 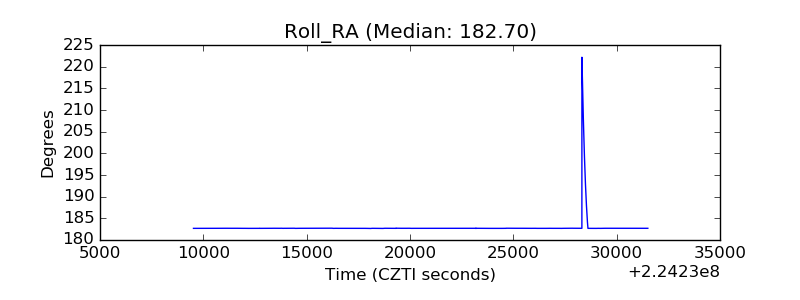 |
| Veto Counter | 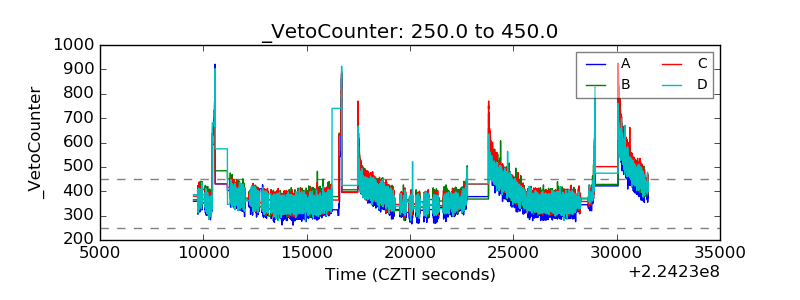 |