| Param | Original file | Final file |
|---|---|---|
| Filename | modeM0/AS1G06_117T01_9000001012_07394cztM0_level2.evt | modeM0/AS1G06_117T01_9000001012_07394cztM0_level2_quad_clean.evt |
| Size (bytes) | 234,832,320 | 39,769,920 |
| Size | 224.0 MB | 37.9 MB |
| Events in quadrant A | 1,616,033 | 244,909 |
| Events in quadrant B | 1,595,084 | 252,677 |
| Events in quadrant C | 1,566,898 | 254,712 |
| Events in quadrant D | 2,123,631 | 233,198 |
| Mode M9 | |||
|---|---|---|---|
| Quadrant | BADHDUFLAG | Total packets | Discarded packets |
| A | 0 | 22 | 1 |
| B | 0 | 22 | 2 |
| C | 0 | 22 | 3 |
| D | 0 | 23 | 5 |
| Mode M0 | |||
|---|---|---|---|
| Quadrant | BADHDUFLAG | Total packets | Discarded packets |
| A | 0 | 13066 | 6139 |
| B | 0 | 12891 | 6153 |
| C | 0 | 12545 | 5864 |
| D | 0 | 15915 | 7571 |
| Mode SS | |||
|---|---|---|---|
| Quadrant | BADHDUFLAG | Total packets | Discarded packets |
| A | 0 | 119 | 49 |
| B | 0 | 121 | 57 |
| C | 0 | 118 | 55 |
| D | 0 | 119 | 59 |
| Quadrant | Total seconds | Saturated seconds | Saturation percentage |
|---|---|---|---|
| A | 3066 | 64 | 2.087410% |
| B | 3055 | 54 | 1.767594% |
| C | 3088 | 47 | 1.522021% |
| D | 3019 | 112 | 3.709838% |
Noise dominated data is calculated using 1-second bins in cleaned event files. If a bin has >2000 counts, and if more than 50% of those come from <1% of pixels, then it is considered to be noise-dominated and hence unusable.
| Quadrant | # 1 sec bins | Bins with >0 counts | Bins with >2000 counts | High rate bins dominated by noise | Noise dominated (total time) | Noise dominated (detector-on time) | Marked lightcurve |
|---|---|---|---|---|---|---|---|
| A | 7511 | 3333 | 4 | 4 | 0.05% | 0.12% | 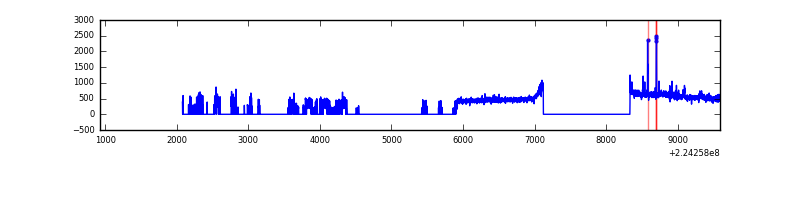 |
| B | 7515 | 3324 | 1 | 1 | 0.01% | 0.03% | 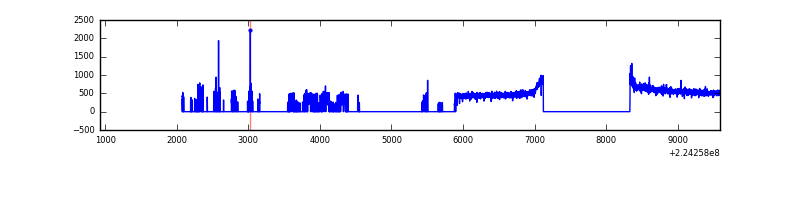 |
| C | 7510 | 3350 | 0 | 0 | 0.00% | 0.00% | 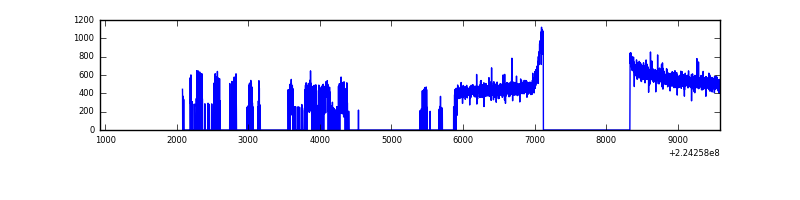 |
| D | 8663 | 3290 | 28 | 28 | 0.32% | 0.85% | 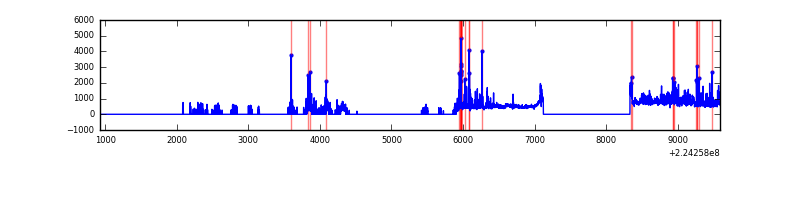 |
Top three noisy pixels from each quadrant. If the there are fewer than three noisy pixels in the level2.evt file, extra rows are filled as -1
| Pixel properties | Quadrant properties | ||||||
|---|---|---|---|---|---|---|---|
| Quadrant | DetID | PixID | Counts | Sigma | Mean | Median | Sigma |
| A | 14 | 111 | 41068 | 482.79 | 403 | 395 | 84.2 |
| A | 15 | 234 | 22035 | 256.87 | 403 | 395 | 84.2 |
| A | 0 | 226 | 3761 | 39.95 | 403 | 395 | 84.2 |
| B | 4 | 81 | 13569 | 168.92 | 405 | 396 | 78.0 |
| B | 0 | 214 | 12585 | 156.31 | 405 | 396 | 78.0 |
| B | 12 | 111 | 7434 | 90.25 | 405 | 396 | 78.0 |
| C | 13 | 61 | 3059 | 28.54 | 399 | 400 | 93.2 |
| C | 10 | 22 | 2770 | 25.44 | 399 | 400 | 93.2 |
| C | 1 | 16 | 1955 | 16.69 | 399 | 400 | 93.2 |
| D | 12 | 233 | 238495 | 2478.71 | 387 | 376 | 96.1 |
| D | 12 | 221 | 157378 | 1634.32 | 387 | 376 | 96.1 |
| D | 2 | 216 | 114642 | 1189.46 | 387 | 376 | 96.1 |
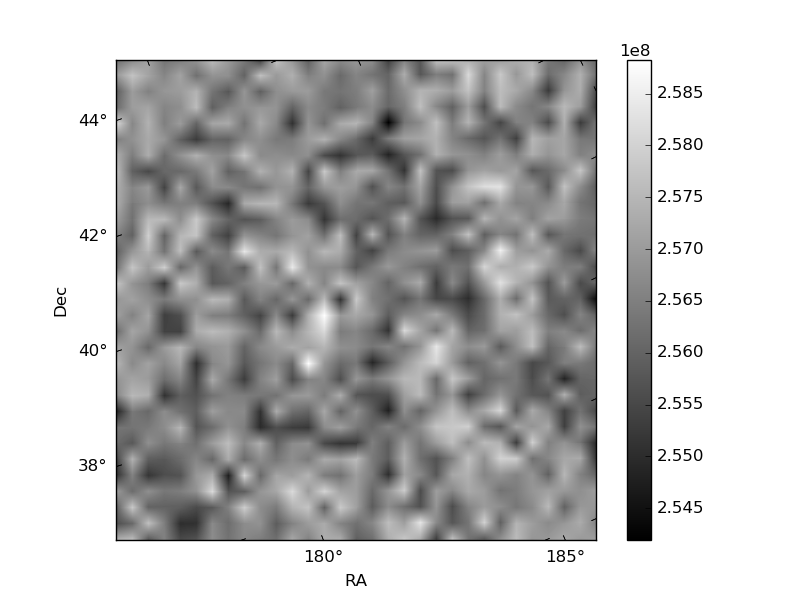
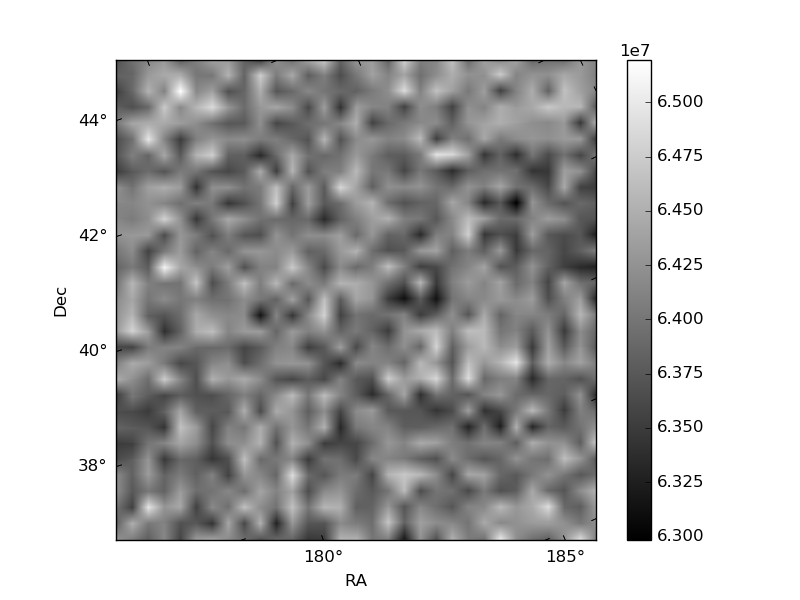
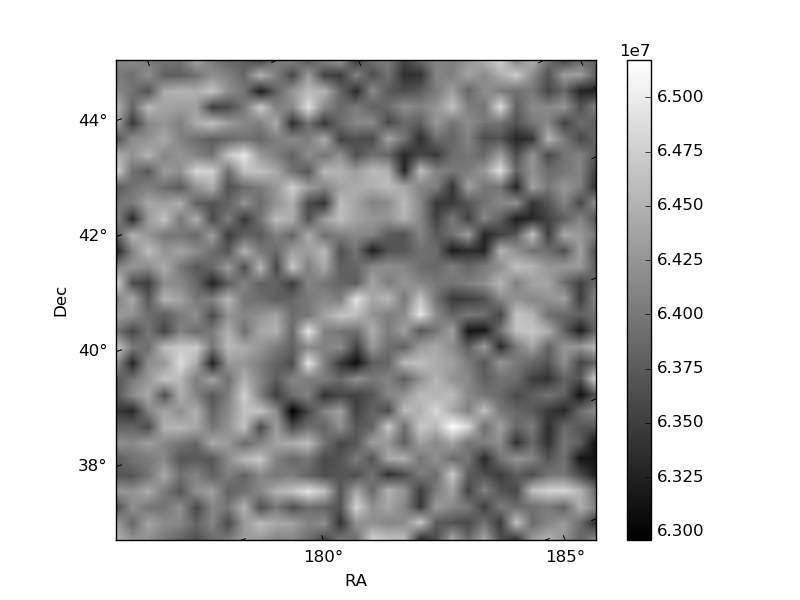
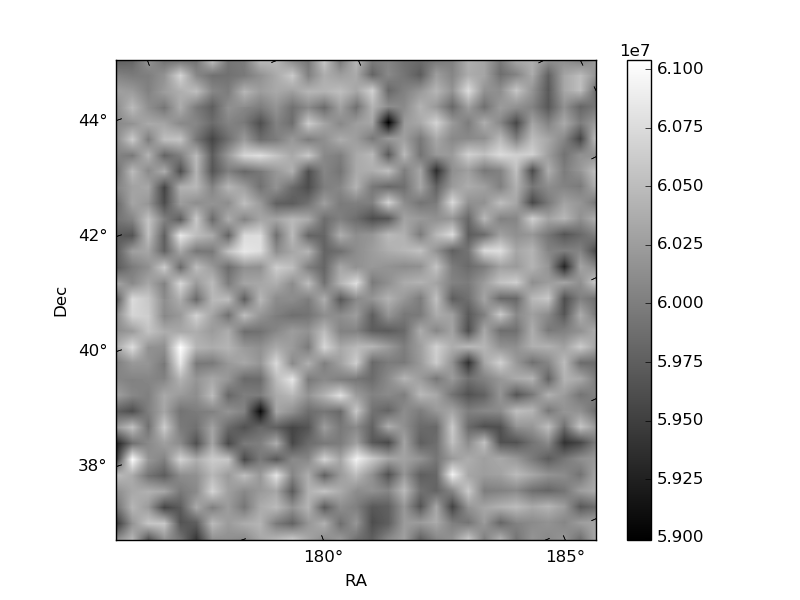
Histogram calculated using DETX and DETY for each event in the final _common_clean file
| Quadrant A | 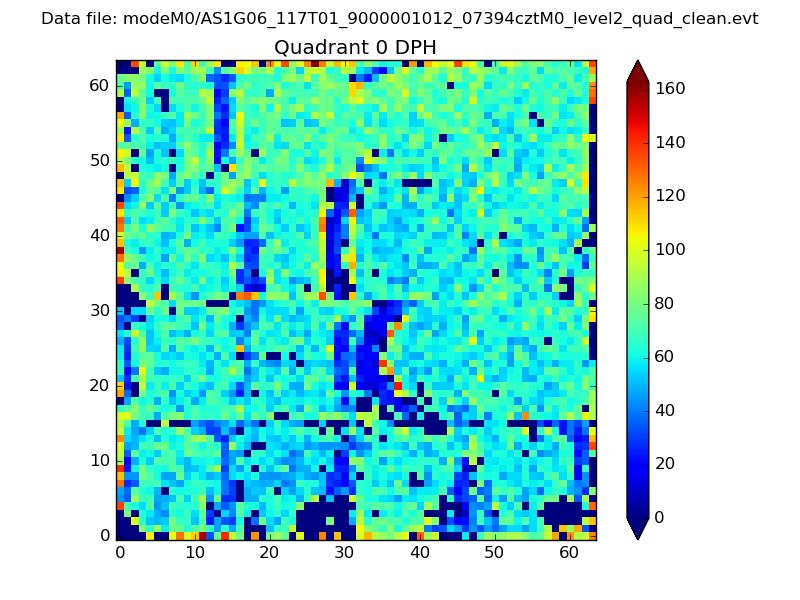 |
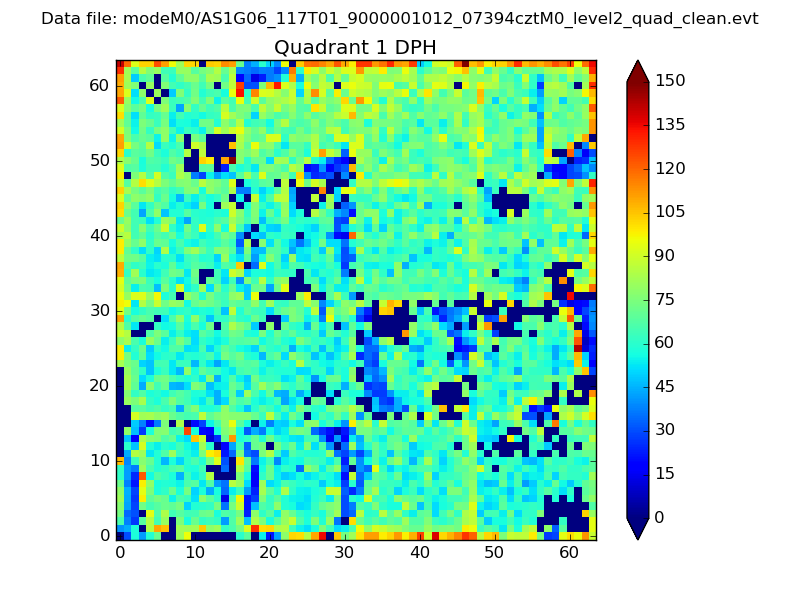 |
Quadrant B |
|---|---|---|---|
| Quadrant D | 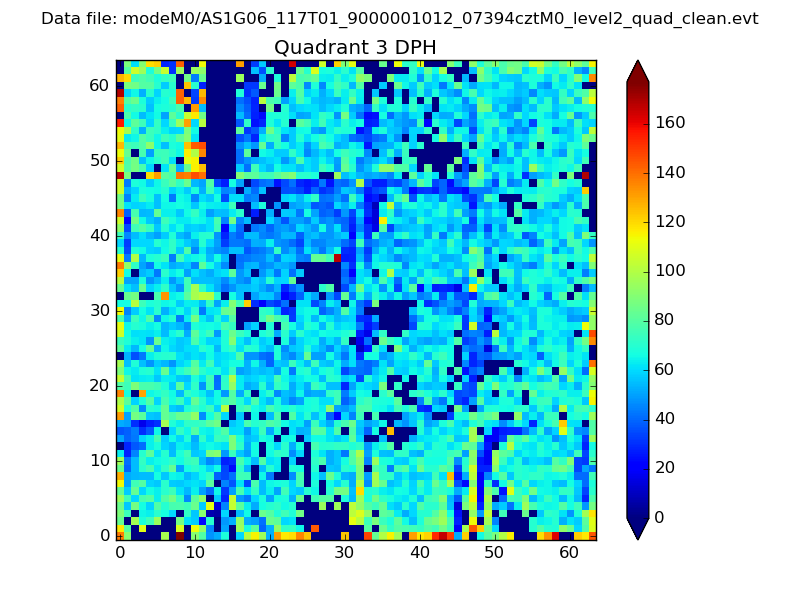 |
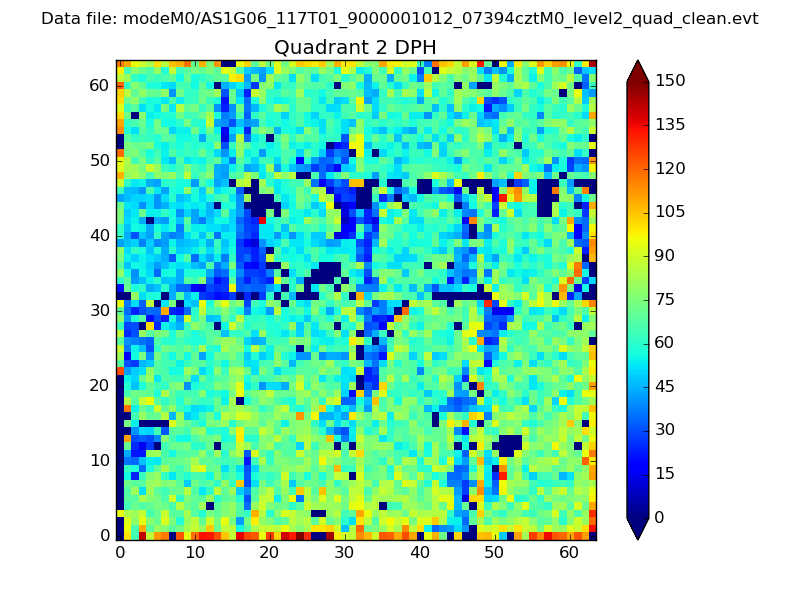 |
Quadrant C |
| Plot type | Count rate plots | Images |
|---|---|---|
| Comparison with Poisson distribution Blue bars denote a histogram of data divided into 1 sec bins. Red curve is a Poisson curve with rate = median count rate of data. |
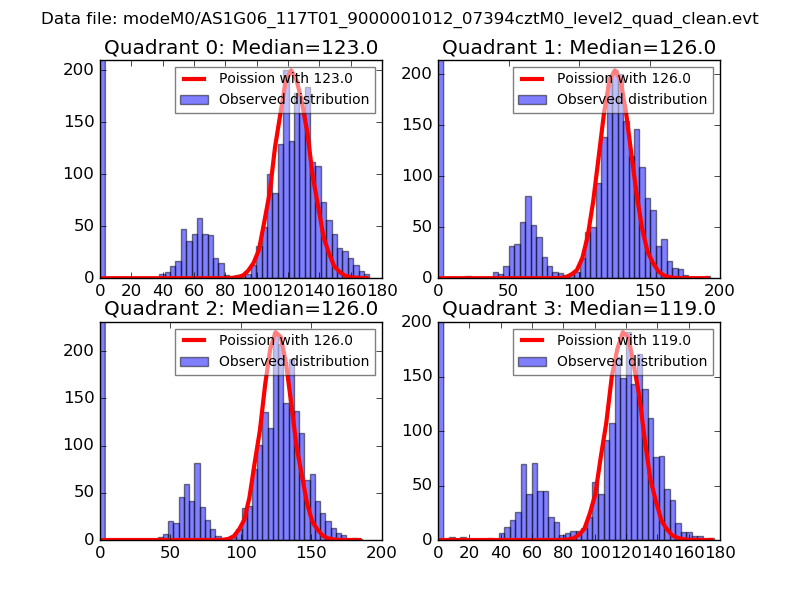 |
 |
| Quadrant-wise count rates Data is divided into 100 sec bins |
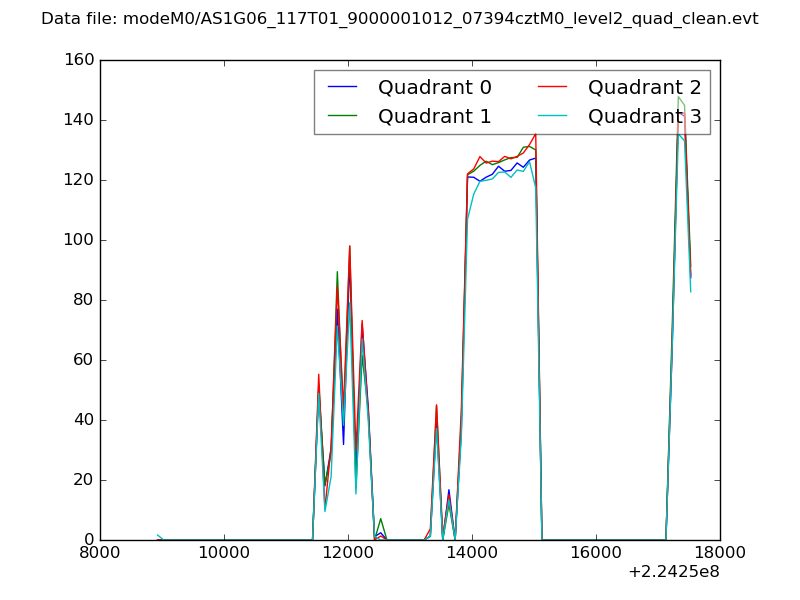 |
|
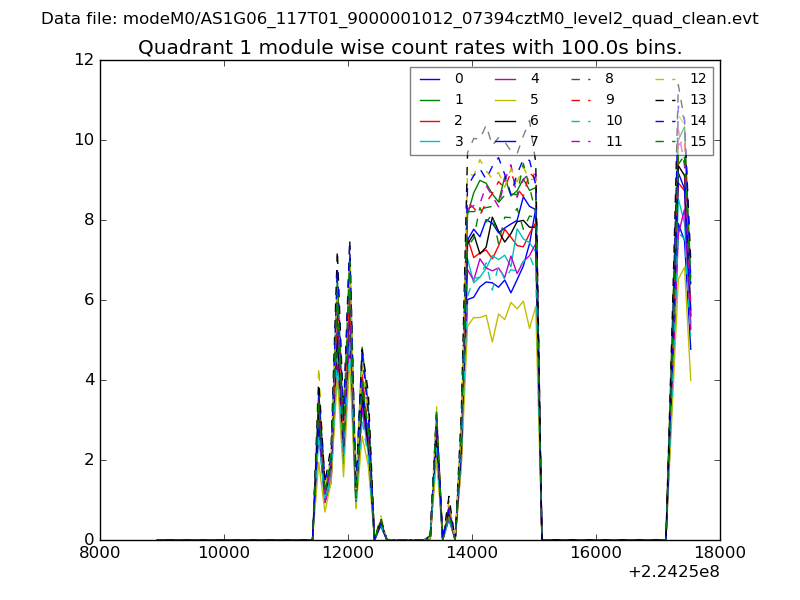
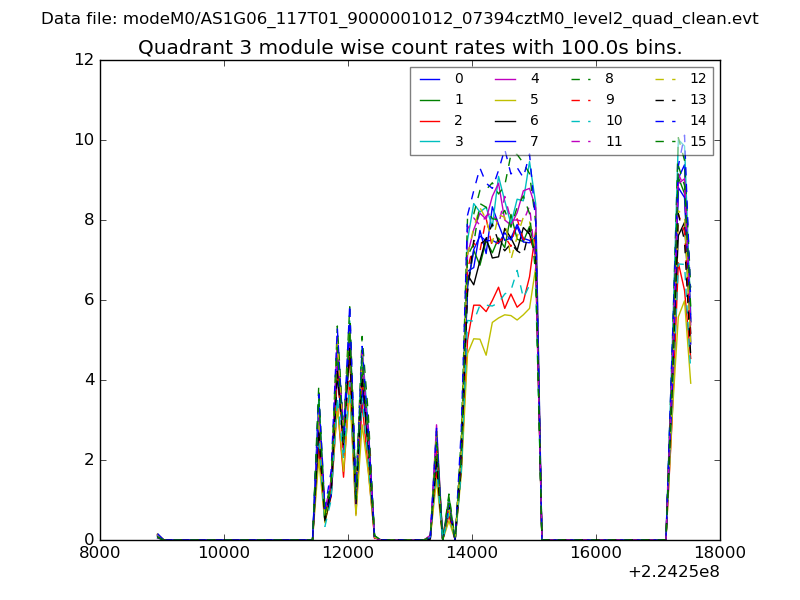
| Module-wise count rates for Quadrant A Data is divided into 100 sec bins |
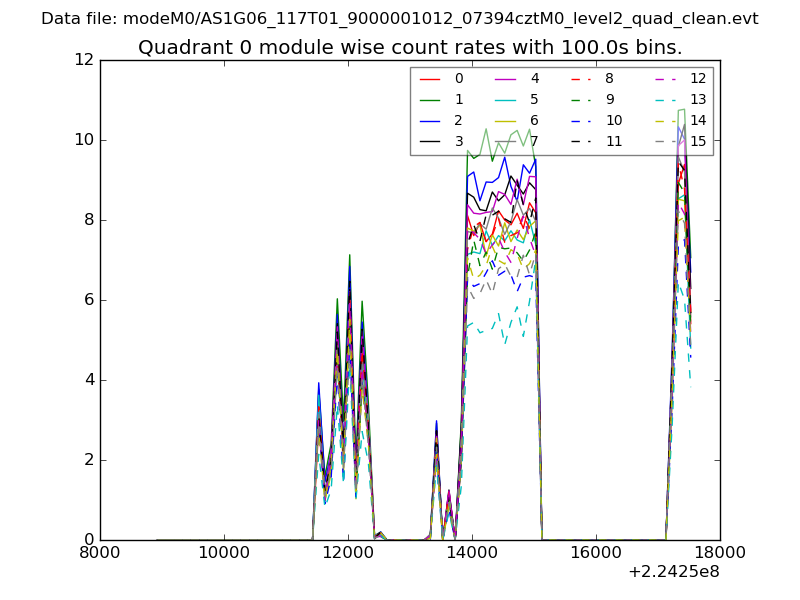 |
 |
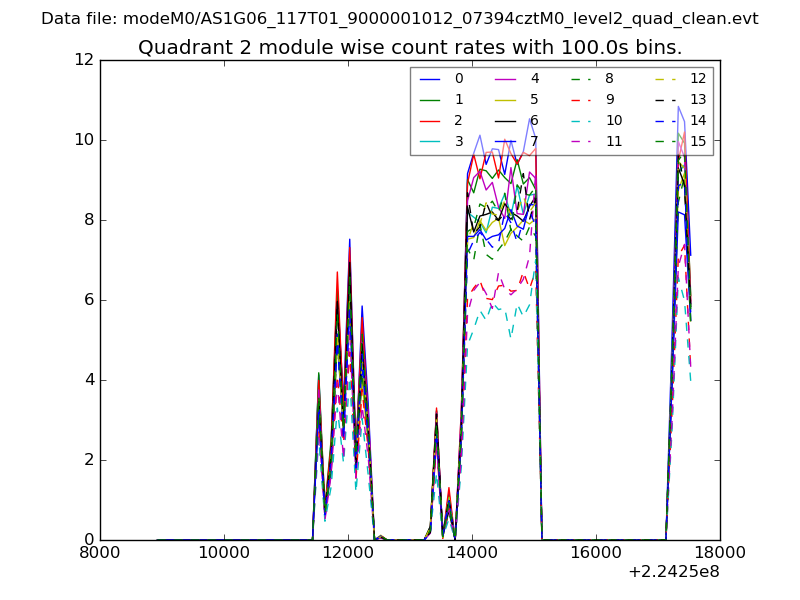
| Module-wise count rates for Quadrant B Data is divided into 100 sec bins |
 |
 |
| Module-wise count rates for Quadrant C Data is divided into 100 sec bins |
 |
 |
| Module-wise count rates for Quadrant D Data is divided into 100 sec bins |
 |
 |
| Parameter | Plot |
|---|---|
| CZT HV Monitor | 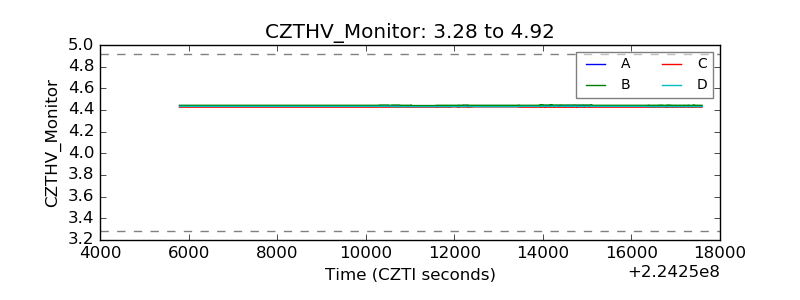 |
| D_VDD | 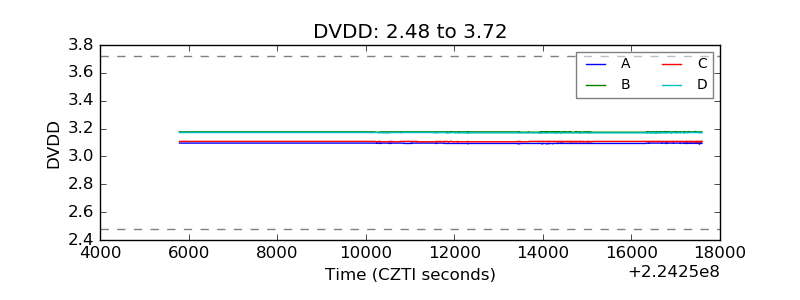 |
| Temperature 1 | 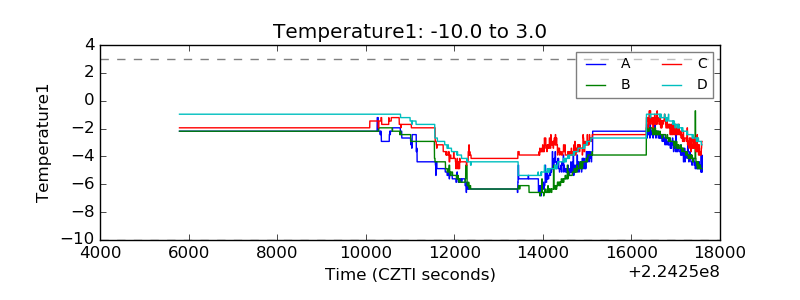 |
| Veto HV Monitor | 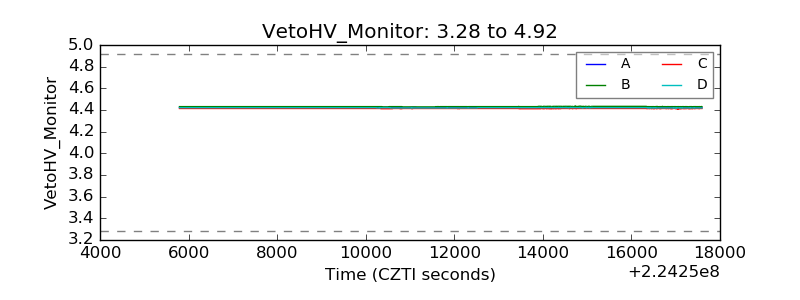 |
| Veto LLD | 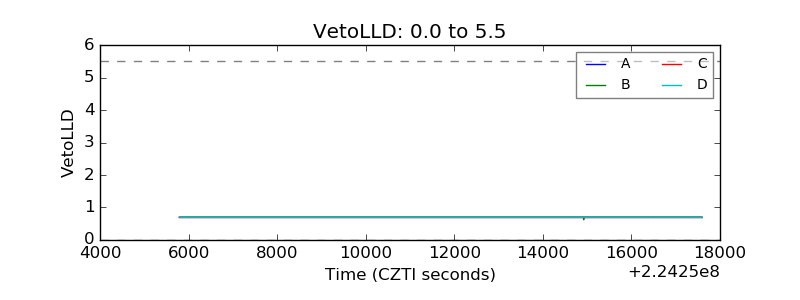 |
| Alpha Counter | 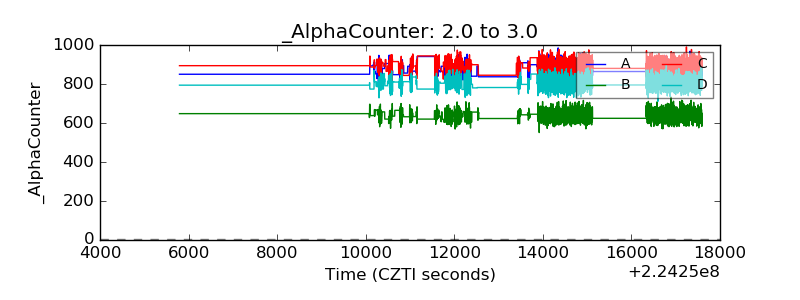 |
| _CPM_Rate | 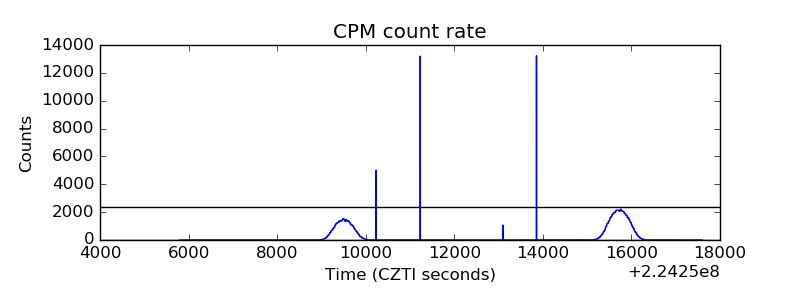 |
| CZT Counter | 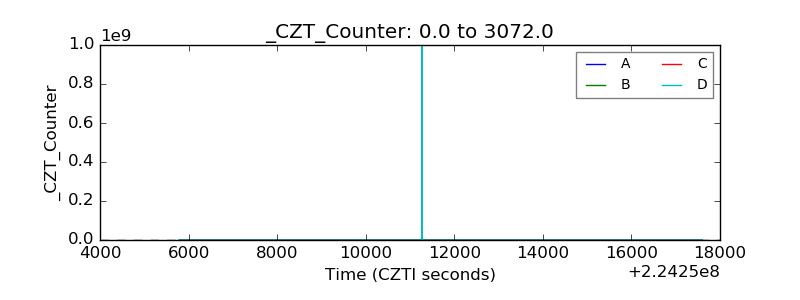 |
| +2.5 Volts monitor |  |
| +5 Volts monitor | 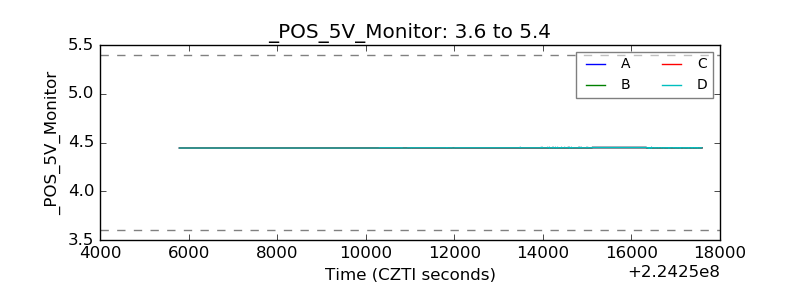 |
| _ROLL_ROT |  |
| _Roll_DEC |  |
| _Roll_RA | 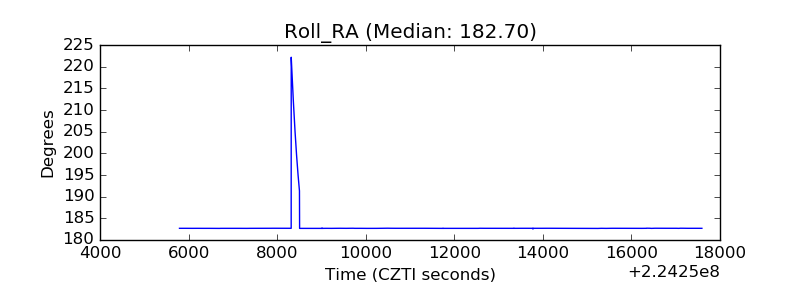 |
| Veto Counter | 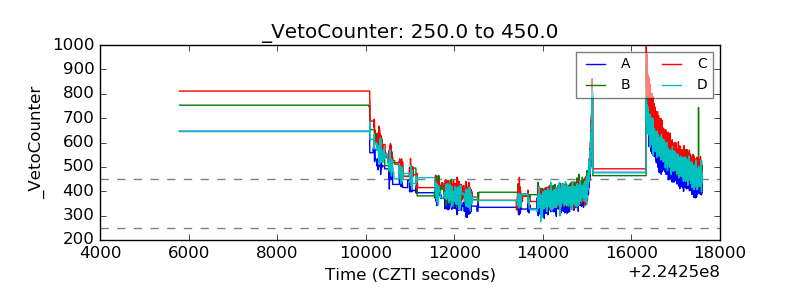 |