| Param | Original file | Final file |
|---|---|---|
| Filename | modeM0/AS1A02_031T01_9000001014cztM0_level2.fits | modeM0/AS1A02_031T01_9000001014cztM0_level2_quad_clean.evt |
| Size (bytes) | 194,800,320 | 216,725,760 |
| Size | 185.8 MB | 206.7 MB |
| Events in quadrant A | 1,164,858 | 1,323,021 |
| Events in quadrant B | 1,147,042 | 1,347,637 |
| Events in quadrant C | 1,171,516 | 1,298,330 |
| Events in quadrant D | 1,009,396 | 1,187,729 |
| Mode M9 | |||
|---|---|---|---|
| Quadrant | BADHDUFLAG | Total packets | Discarded packets |
| A | 0 | 39 | 0 |
| B | 0 | 41 | 0 |
| C | 0 | 37 | 0 |
| D | 0 | 38 | 0 |
| Mode SS | |||
|---|---|---|---|
| Quadrant | BADHDUFLAG | Total packets | Discarded packets |
| A | 0 | 418 | 0 |
| B | 0 | 421 | 0 |
| C | 0 | 418 | 0 |
| D | 0 | 420 | 0 |
| Mode M0 | |||
|---|---|---|---|
| Quadrant | BADHDUFLAG | Total packets | Discarded packets |
| A | 0 | 42622 | 0 |
| B | 0 | 44298 | 0 |
| C | 0 | 42373 | 0 |
| D | 0 | 49960 | 0 |
| Quadrant | Total seconds | Saturated seconds | Saturation percentage |
|---|---|---|---|
| A | 20407 | 168 | 0.823247% |
| B | 20397 | 199 | 0.975634% |
| C | 20403 | 94 | 0.460717% |
| D | 20440 | 365 | 1.785714% |
Noise dominated data is calculated using 1-second bins in cleaned event files. If a bin has >2000 counts, and if more than 50% of those come from <1% of pixels, then it is considered to be noise-dominated and hence unusable.
| Quadrant | # 1 sec bins | Bins with >0 counts | Bins with >2000 counts | High rate bins dominated by noise | Noise dominated (total time) | Noise dominated (detector-on time) | Marked lightcurve |
|---|---|---|---|---|---|---|---|
| A | 29111 | 20567 | 0 | 0 | 0.00% | 0.00% |  |
| B | 29111 | 20565 | 0 | 0 | 0.00% | 0.00% |  |
| C | 29111 | 20563 | 0 | 0 | 0.00% | 0.00% |  |
| D | 29111 | 20605 | 0 | 0 | 0.00% | 0.00% |  |
Top three noisy pixels from each quadrant. If the there are fewer than three noisy pixels in the level2.evt file, extra rows are filled as -1
| Pixel properties | Quadrant properties | ||||||
|---|---|---|---|---|---|---|---|
| Quadrant | DetID | PixID | Counts | Sigma | Mean | Median | Sigma |
| A | 0 | 29 | 1175 | 11.41 | 303 | 284 | 78.1 |
| A | 7 | 110 | 978 | 8.89 | 303 | 284 | 78.1 |
| A | 0 | 30 | 880 | 7.64 | 303 | 284 | 78.1 |
| B | 2 | 9 | 987 | 11.19 | 302 | 287 | 62.5 |
| B | 3 | 80 | 782 | 7.91 | 302 | 287 | 62.5 |
| B | 12 | 226 | 773 | 7.77 | 302 | 287 | 62.5 |
| C | 1 | 80 | 894 | 7.4 | 309 | 288 | 81.8 |
| C | 1 | 81 | 845 | 6.81 | 309 | 288 | 81.8 |
| C | 1 | 65 | 810 | 6.38 | 309 | 288 | 81.8 |
| D | 6 | 231 | 758 | 6.34 | 287 | 260 | 78.5 |
| D | 3 | 14 | 741 | 6.13 | 287 | 260 | 78.5 |
| D | 7 | 3 | 732 | 6.01 | 287 | 260 | 78.5 |
Histogram calculated using DETX and DETY for each event in the final _common_clean file
| Quadrant A |  |
 |
Quadrant B |
|---|---|---|---|
| Quadrant D | 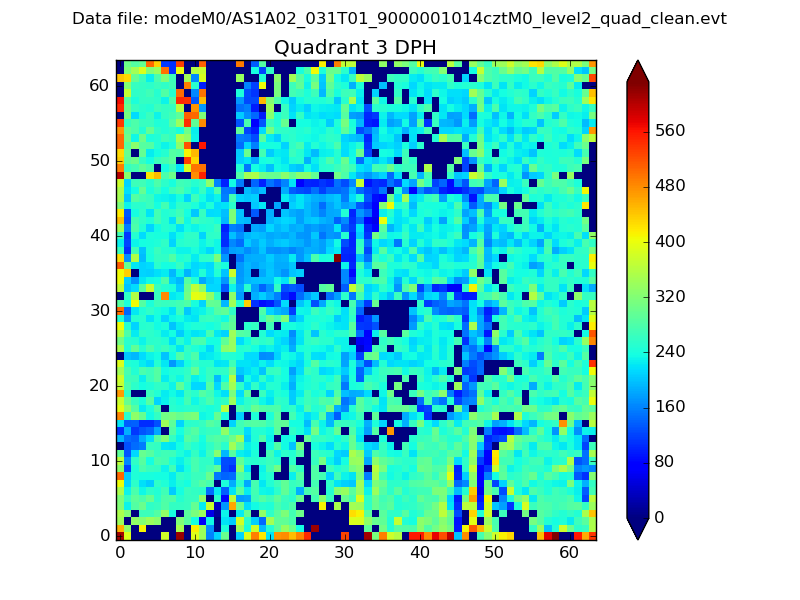 |
 |
Quadrant C |
| Plot type | Count rate plots | Images |
|---|---|---|
| Comparison with Poisson distribution Blue bars denote a histogram of data divided into 1 sec bins. Red curve is a Poisson curve with rate = median count rate of data. |
 |
 |
| Quadrant-wise count rates Data is divided into 100 sec bins |
 |
|
| Module-wise count rates for Quadrant A Data is divided into 100 sec bins |
 |
 |
| Module-wise count rates for Quadrant B Data is divided into 100 sec bins |
 |
 |
| Module-wise count rates for Quadrant C Data is divided into 100 sec bins |
 |
 |
| Module-wise count rates for Quadrant D Data is divided into 100 sec bins |
 |
 |
| Parameter | Plot |
|---|---|
| CZT HV Monitor |  |
| D_VDD |  |
| Temperature 1 |  |
| Veto HV Monitor |  |
| Veto LLD |  |
| Alpha Counter |  |
| _CPM_Rate |  |
| CZT Counter |  |
| +2.5 Volts monitor |  |
| +5 Volts monitor |  |
| _ROLL_ROT |  |
| _Roll_DEC |  |
| _Roll_RA |  |
| Veto Counter |  |