| Param | Original file | Final file |
|---|---|---|
| Filename | modeM0/AS1A02_031T01_9000001014_07396cztM0_level2.evt | modeM0/AS1A02_031T01_9000001014_07396cztM0_level2_quad_clean.evt |
| Size (bytes) | 334,365,120 | 73,509,120 |
| Size | 318.9 MB | 70.1 MB |
| Events in quadrant A | 2,317,997 | 471,091 |
| Events in quadrant B | 2,341,772 | 486,371 |
| Events in quadrant C | 2,257,797 | 482,249 |
| Events in quadrant D | 2,887,926 | 455,671 |
| Mode M9 | |||
|---|---|---|---|
| Quadrant | BADHDUFLAG | Total packets | Discarded packets |
| A | 0 | 13 | 0 |
| B | 0 | 13 | 0 |
| C | 0 | 13 | 0 |
| D | 0 | 13 | 0 |
| Mode SS | |||
|---|---|---|---|
| Quadrant | BADHDUFLAG | Total packets | Discarded packets |
| A | 0 | 99 | 3 |
| B | 0 | 100 | 4 |
| C | 0 | 101 | 5 |
| D | 0 | 101 | 3 |
| Mode M0 | |||
|---|---|---|---|
| Quadrant | BADHDUFLAG | Total packets | Discarded packets |
| A | 0 | 10399 | 338 |
| B | 0 | 10438 | 362 |
| C | 0 | 10239 | 364 |
| D | 0 | 12273 | 345 |
| Quadrant | Total seconds | Saturated seconds | Saturation percentage |
|---|---|---|---|
| A | 4710 | 72 | 1.528662% |
| B | 4708 | 54 | 1.146984% |
| C | 4701 | 41 | 0.872155% |
| D | 4707 | 102 | 2.166985% |
Noise dominated data is calculated using 1-second bins in cleaned event files. If a bin has >2000 counts, and if more than 50% of those come from <1% of pixels, then it is considered to be noise-dominated and hence unusable.
| Quadrant | # 1 sec bins | Bins with >0 counts | Bins with >2000 counts | High rate bins dominated by noise | Noise dominated (total time) | Noise dominated (detector-on time) | Marked lightcurve |
|---|---|---|---|---|---|---|---|
| A | 6052 | 4720 | 3 | 3 | 0.05% | 0.06% |  |
| B | 6004 | 4717 | 2 | 2 | 0.03% | 0.04% |  |
| C | 6000 | 4711 | 0 | 0 | 0.00% | 0.00% | 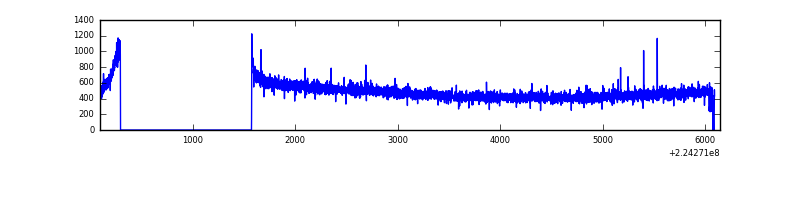 |
| D | 6002 | 4715 | 50 | 50 | 0.83% | 1.06% |  |
Top three noisy pixels from each quadrant. If the there are fewer than three noisy pixels in the level2.evt file, extra rows are filled as -1
| Pixel properties | Quadrant properties | ||||||
|---|---|---|---|---|---|---|---|
| Quadrant | DetID | PixID | Counts | Sigma | Mean | Median | Sigma |
| A | 14 | 111 | 57185 | 476.25 | 583 | 571 | 118.9 |
| A | 3 | 1 | 10101 | 80.17 | 583 | 571 | 118.9 |
| A | 15 | 234 | 7984 | 62.36 | 583 | 571 | 118.9 |
| B | 0 | 214 | 29408 | 256.15 | 593 | 580 | 112.5 |
| B | 12 | 111 | 11149 | 93.91 | 593 | 580 | 112.5 |
| B | 11 | 111 | 8761 | 72.69 | 593 | 580 | 112.5 |
| C | 1 | 16 | 7655 | 52.82 | 576 | 581 | 133.9 |
| C | 13 | 61 | 4422 | 28.68 | 576 | 581 | 133.9 |
| C | 12 | 4 | 4416 | 28.64 | 576 | 581 | 133.9 |
| D | 2 | 216 | 366406 | 2603.75 | 569 | 553 | 140.5 |
| D | 14 | 34 | 138616 | 982.58 | 569 | 553 | 140.5 |
| D | 12 | 233 | 87594 | 619.46 | 569 | 553 | 140.5 |
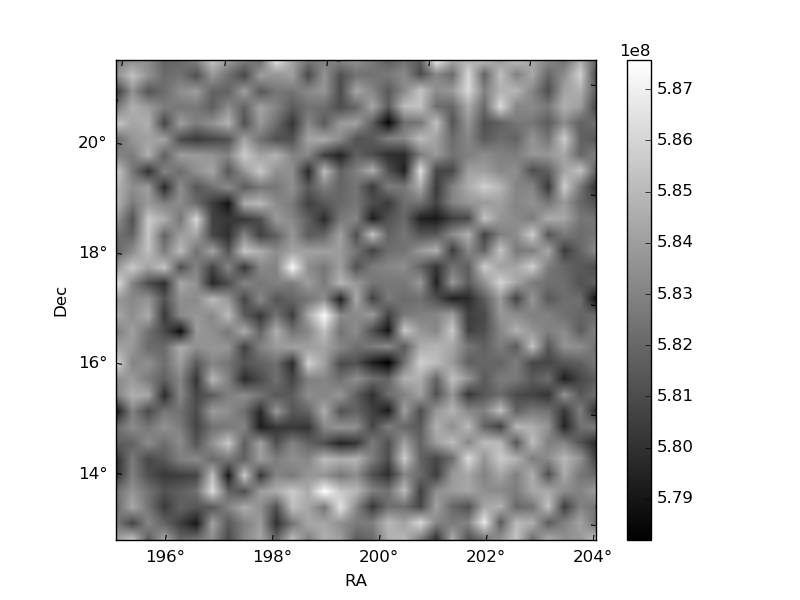
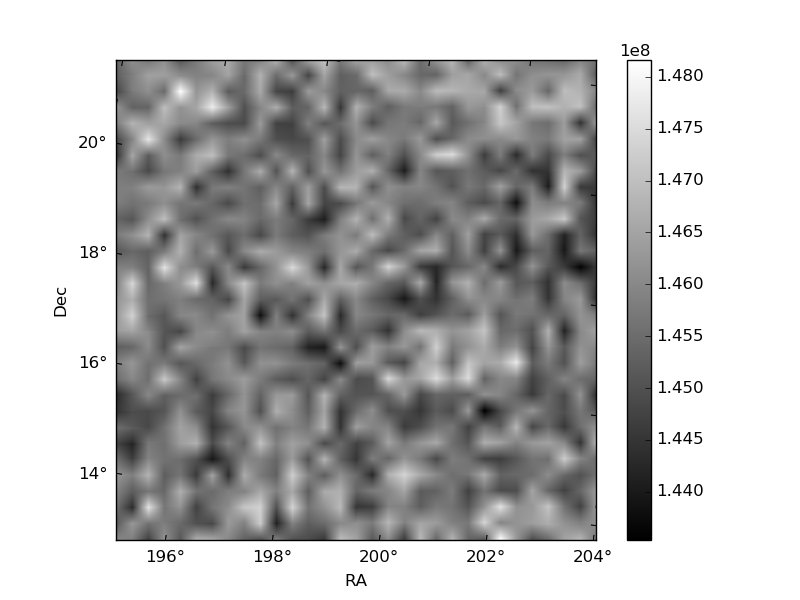
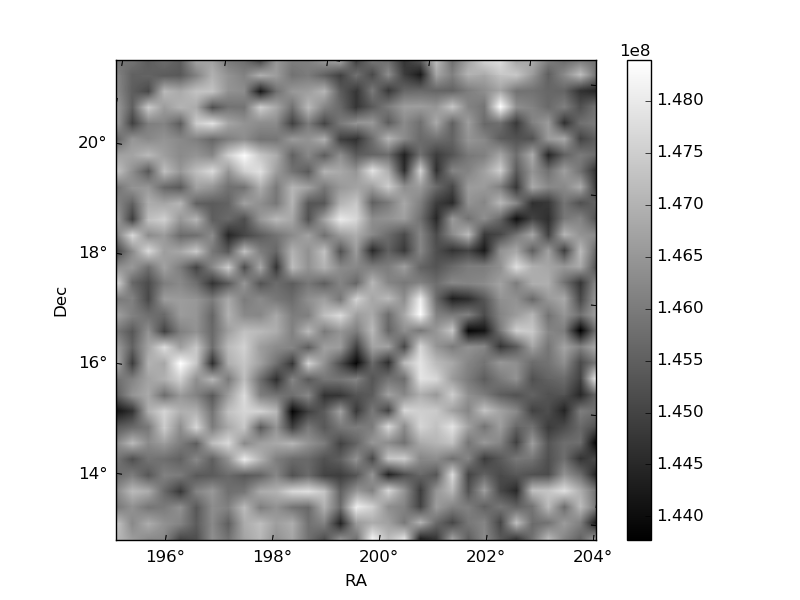
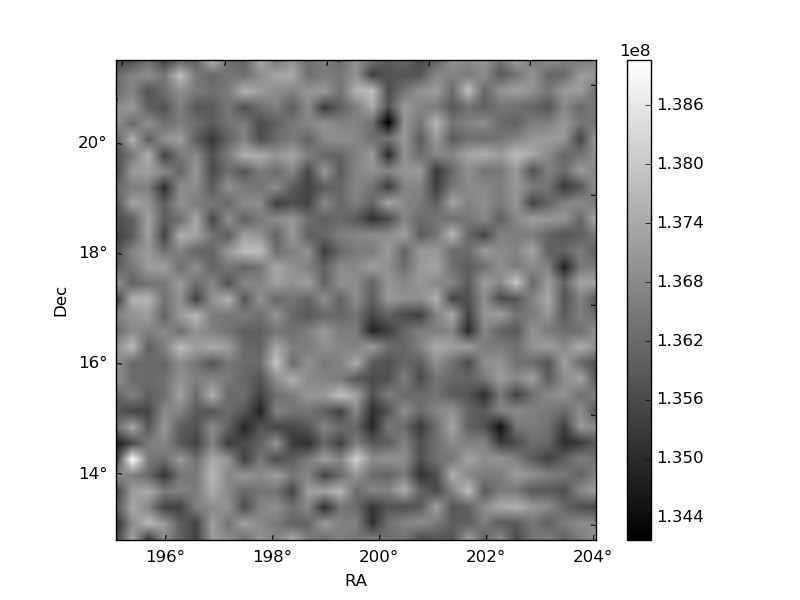
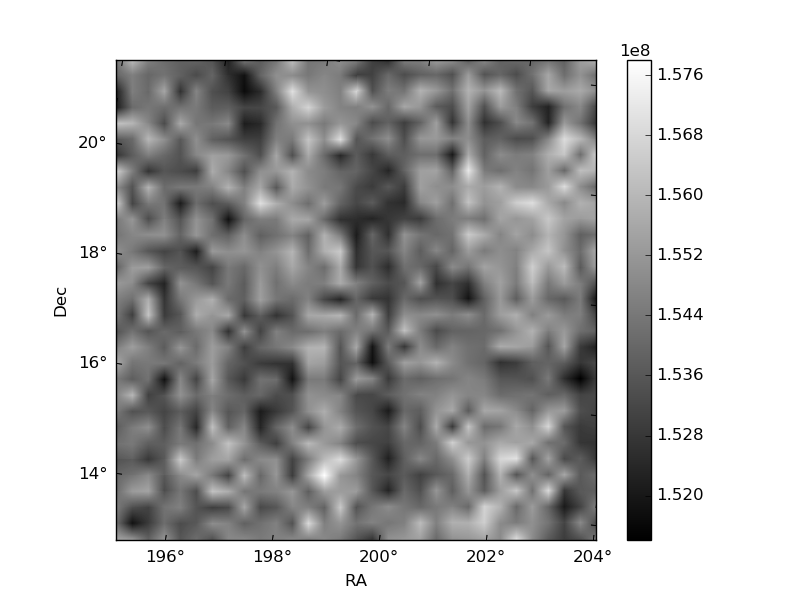
Histogram calculated using DETX and DETY for each event in the final _common_clean file
| Quadrant A | 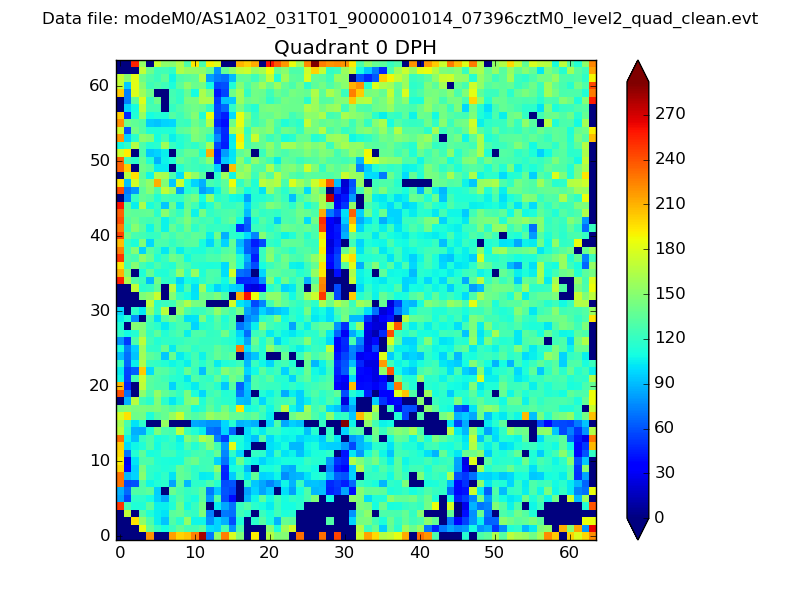 |
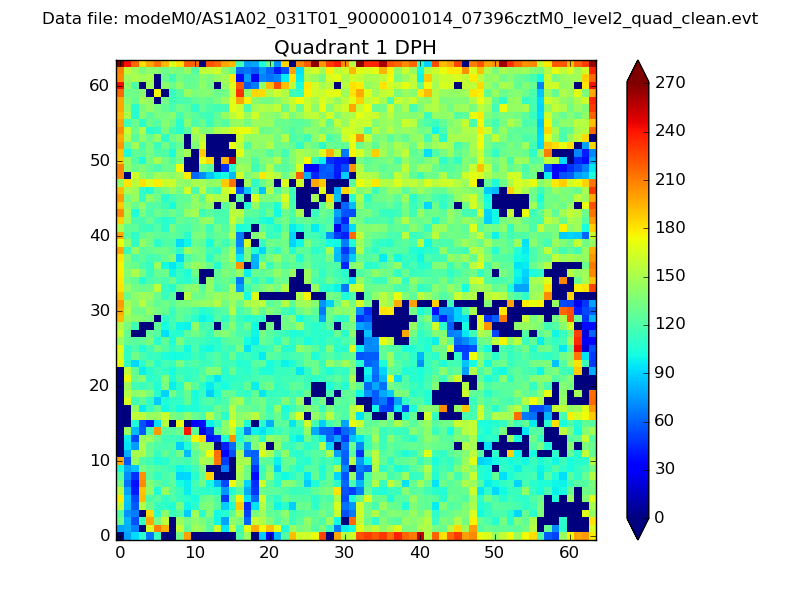 |
Quadrant B |
|---|---|---|---|
| Quadrant D |  |
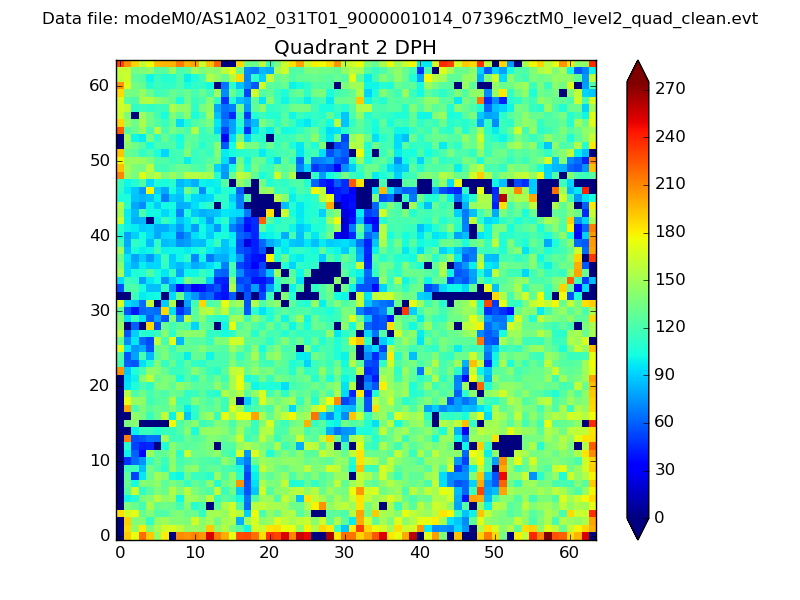 |
Quadrant C |
| Plot type | Count rate plots | Images |
|---|---|---|
| Comparison with Poisson distribution Blue bars denote a histogram of data divided into 1 sec bins. Red curve is a Poisson curve with rate = median count rate of data. |
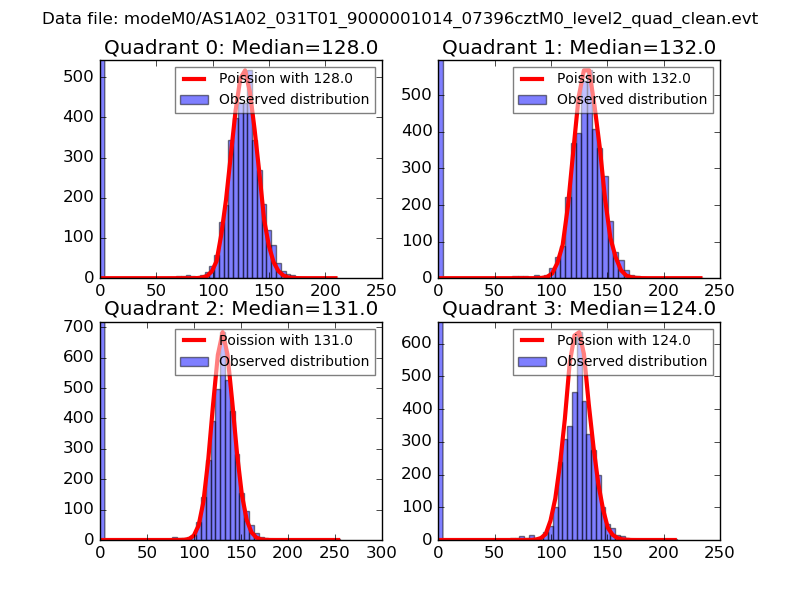 |
 |
| Quadrant-wise count rates Data is divided into 100 sec bins |
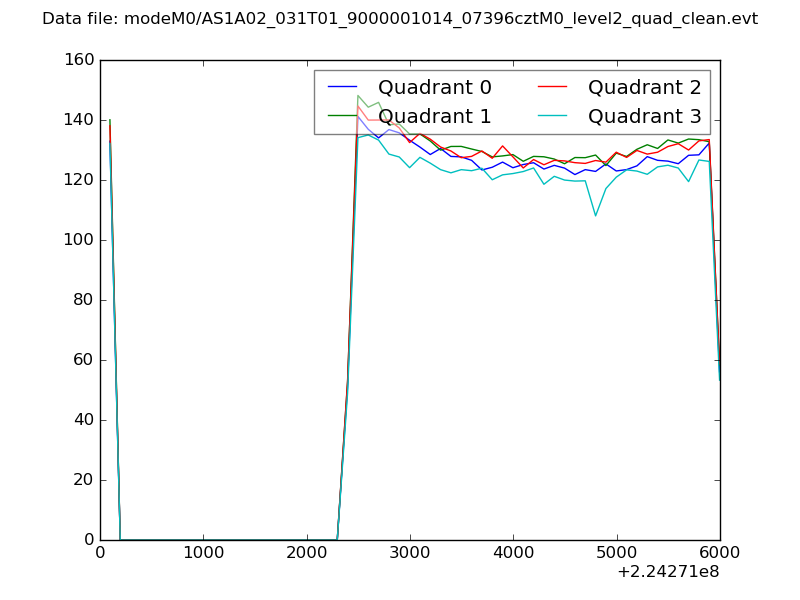 |
|
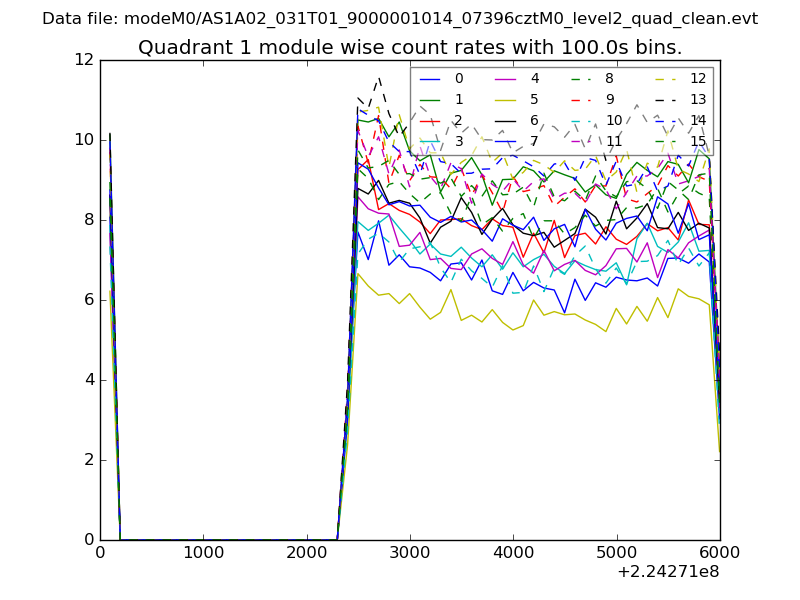
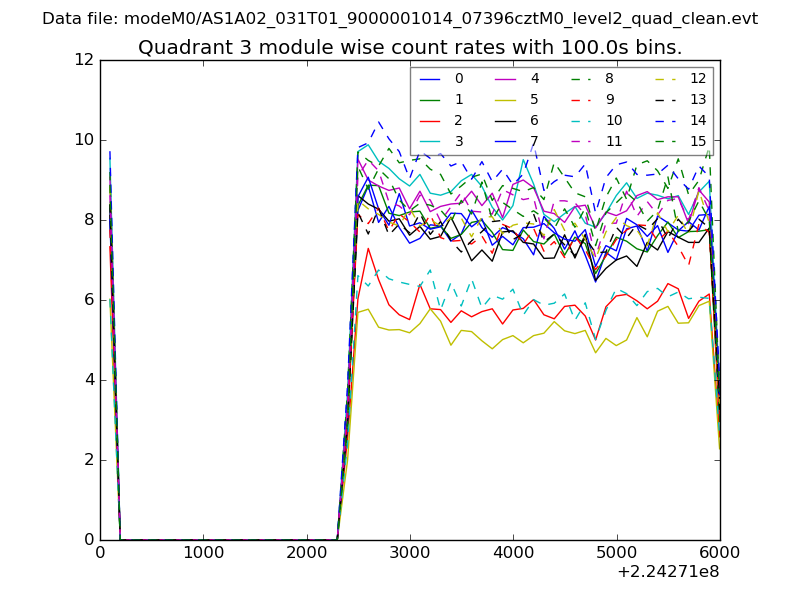
| Module-wise count rates for Quadrant A Data is divided into 100 sec bins |
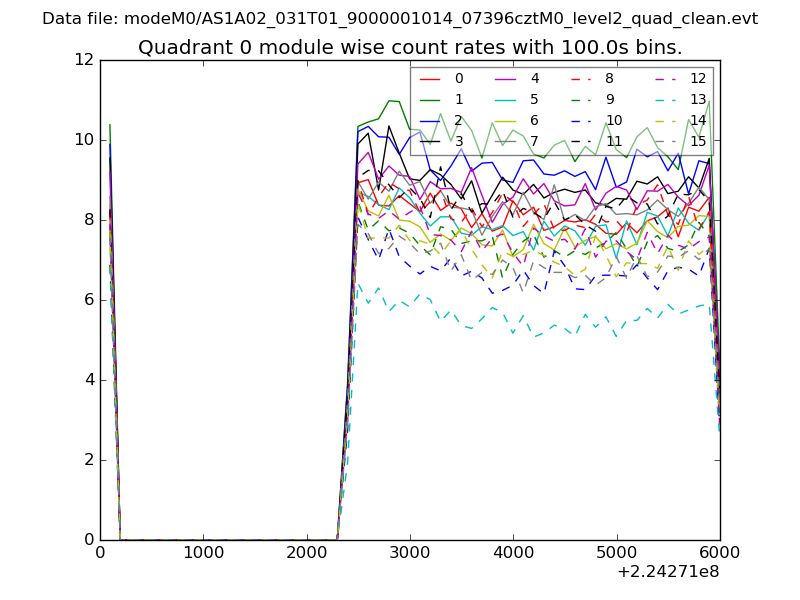 |
 |
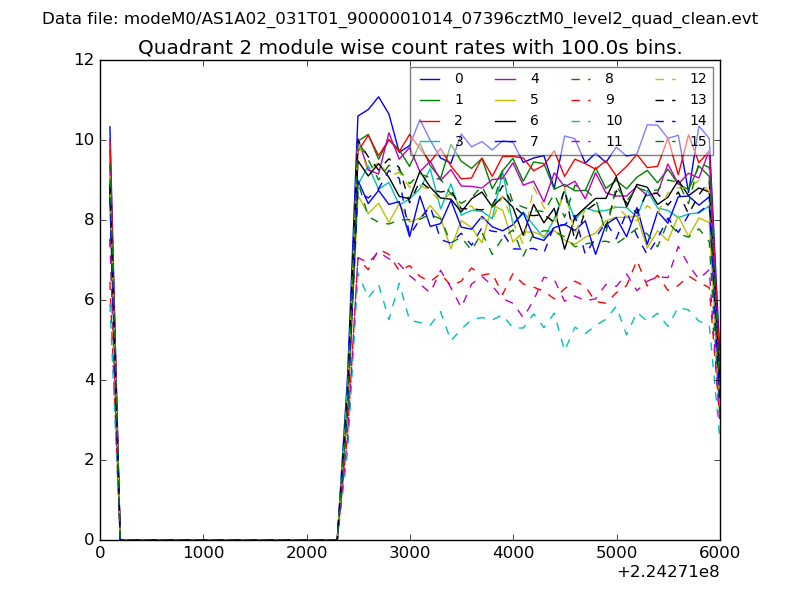
| Module-wise count rates for Quadrant B Data is divided into 100 sec bins |
 |
 |
| Module-wise count rates for Quadrant C Data is divided into 100 sec bins |
 |
 |
| Module-wise count rates for Quadrant D Data is divided into 100 sec bins |
 |
 |
| Parameter | Plot |
|---|---|
| CZT HV Monitor | 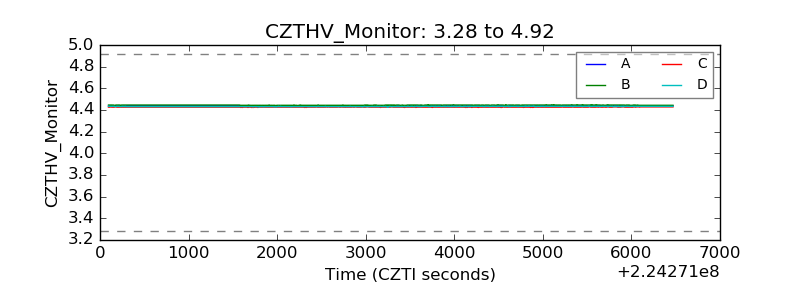 |
| D_VDD | 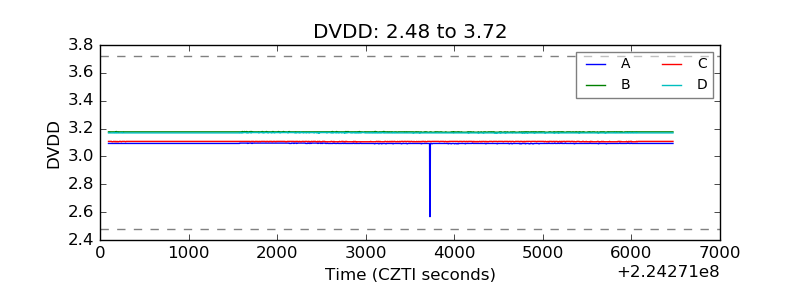 |
| Temperature 1 | 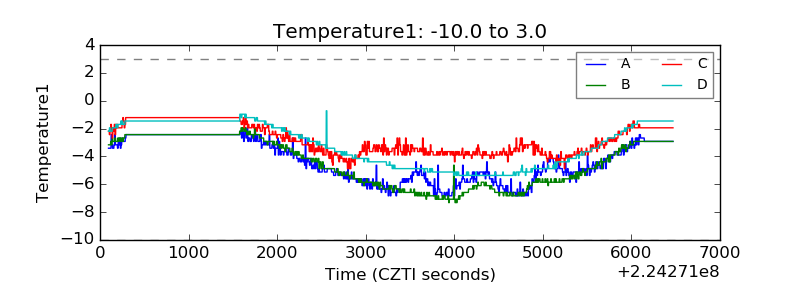 |
| Veto HV Monitor | 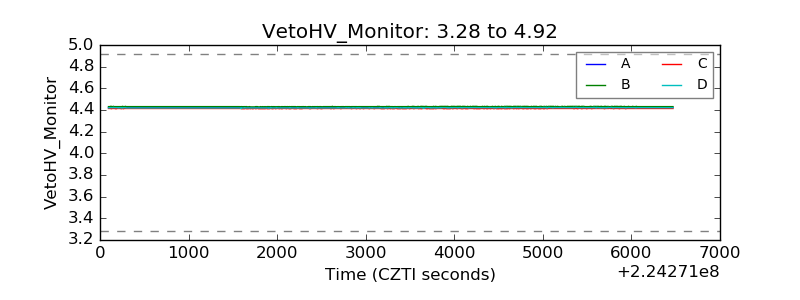 |
| Veto LLD |  |
| Alpha Counter | 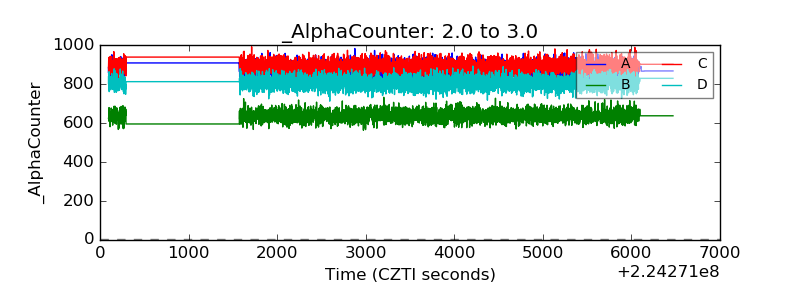 |
| _CPM_Rate | 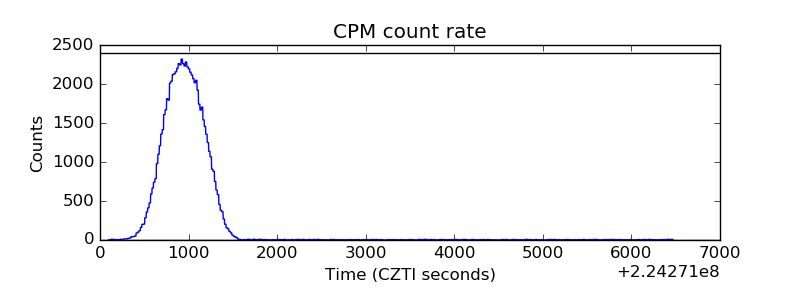 |
| CZT Counter | 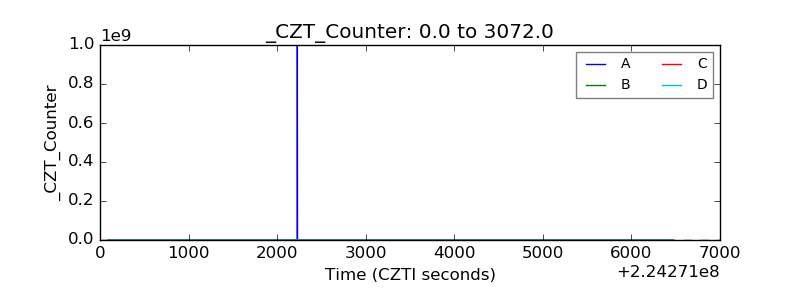 |
| +2.5 Volts monitor |  |
| +5 Volts monitor |  |
| _ROLL_ROT | 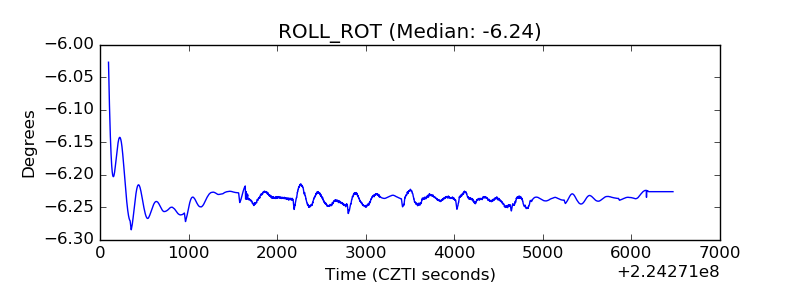 |
| _Roll_DEC | 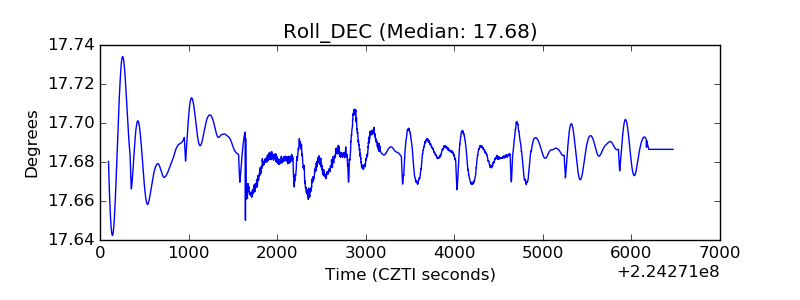 |
| _Roll_RA | 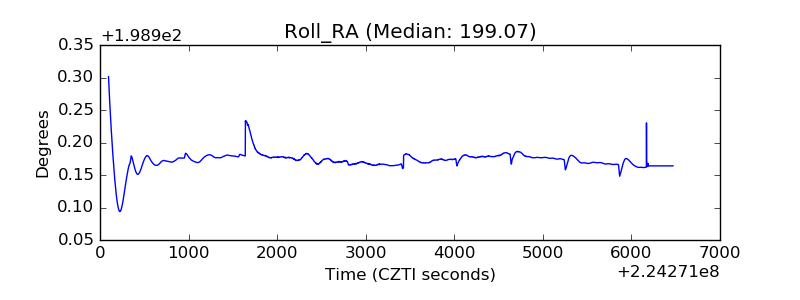 |
| Veto Counter | 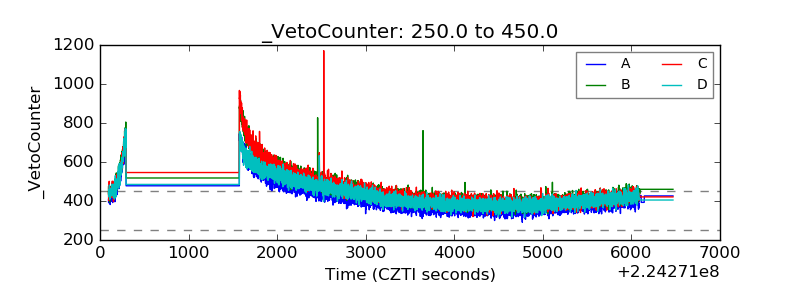 |