| Param | Original file | Final file |
|---|---|---|
| Filename | modeM0/AS1A02_031T01_9000001014_07398cztM0_level2.evt | modeM0/AS1A02_031T01_9000001014_07398cztM0_level2_quad_clean.evt |
| Size (bytes) | 430,266,240 | 85,147,200 |
| Size | 410.3 MB | 81.2 MB |
| Events in quadrant A | 2,856,422 | 535,173 |
| Events in quadrant B | 3,085,300 | 553,971 |
| Events in quadrant C | 2,896,825 | 547,562 |
| Events in quadrant D | 3,776,353 | 515,020 |
| Mode M9 | |||
|---|---|---|---|
| Quadrant | BADHDUFLAG | Total packets | Discarded packets |
| A | 0 | 22 | 6 |
| B | 0 | 22 | 4 |
| C | 0 | 24 | 10 |
| D | 0 | 22 | 8 |
| Mode SS | |||
|---|---|---|---|
| Quadrant | BADHDUFLAG | Total packets | Discarded packets |
| A | 0 | 137 | 11 |
| B | 0 | 136 | 7 |
| C | 0 | 136 | 10 |
| D | 0 | 136 | 10 |
| Mode M0 | |||
|---|---|---|---|
| Quadrant | BADHDUFLAG | Total packets | Discarded packets |
| A | 0 | 13938 | 1230 |
| B | 0 | 14800 | 1372 |
| C | 0 | 13940 | 1138 |
| D | 0 | 16749 | 1324 |
| Quadrant | Total seconds | Saturated seconds | Saturation percentage |
|---|---|---|---|
| A | 6092 | 48 | 0.787919% |
| B | 6100 | 62 | 1.016393% |
| C | 6122 | 26 | 0.424698% |
| D | 6093 | 159 | 2.609552% |
Noise dominated data is calculated using 1-second bins in cleaned event files. If a bin has >2000 counts, and if more than 50% of those come from <1% of pixels, then it is considered to be noise-dominated and hence unusable.
| Quadrant | # 1 sec bins | Bins with >0 counts | Bins with >2000 counts | High rate bins dominated by noise | Noise dominated (total time) | Noise dominated (detector-on time) | Marked lightcurve |
|---|---|---|---|---|---|---|---|
| A | 8860 | 6231 | 0 | 0 | 0.00% | 0.00% |  |
| B | 8860 | 6242 | 3 | 3 | 0.03% | 0.05% | 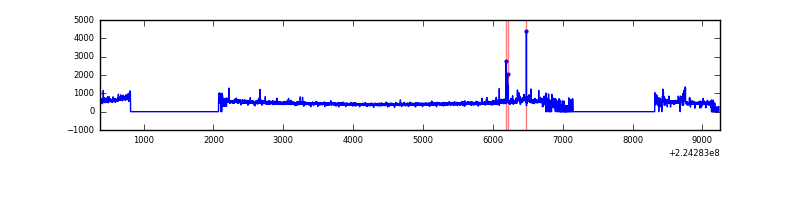 |
| C | 8876 | 6258 | 0 | 0 | 0.00% | 0.00% | 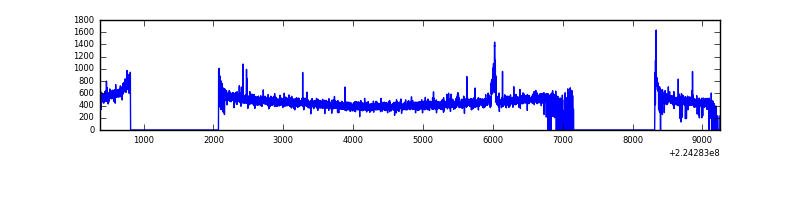 |
| D | 8815 | 6236 | 104 | 104 | 1.18% | 1.67% | 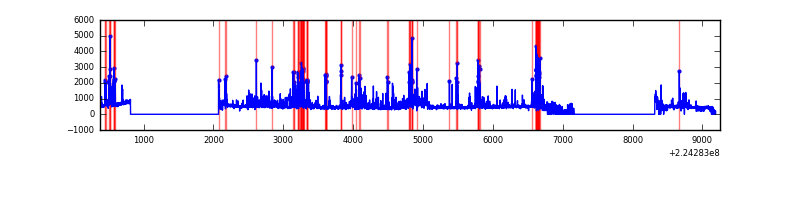 |
Top three noisy pixels from each quadrant. If the there are fewer than three noisy pixels in the level2.evt file, extra rows are filled as -1
| Pixel properties | Quadrant properties | ||||||
|---|---|---|---|---|---|---|---|
| Quadrant | DetID | PixID | Counts | Sigma | Mean | Median | Sigma |
| A | 13 | 248 | 10592 | 65.31 | 736 | 721 | 151.1 |
| A | 0 | 226 | 7228 | 43.05 | 736 | 721 | 151.1 |
| A | 12 | 194 | 6587 | 38.81 | 736 | 721 | 151.1 |
| B | 0 | 214 | 73645 | 510.09 | 748 | 731 | 142.9 |
| B | 10 | 252 | 72204 | 500.01 | 748 | 731 | 142.9 |
| B | 0 | 229 | 16575 | 110.84 | 748 | 731 | 142.9 |
| C | 10 | 22 | 37059 | 215.04 | 728 | 733 | 168.9 |
| C | 12 | 4 | 10303 | 56.65 | 728 | 733 | 168.9 |
| C | 1 | 16 | 6237 | 32.58 | 728 | 733 | 168.9 |
| D | 2 | 216 | 462401 | 2615.86 | 714 | 694 | 176.5 |
| D | 14 | 34 | 206388 | 1165.39 | 714 | 694 | 176.5 |
| D | 1 | 52 | 127451 | 718.16 | 714 | 694 | 176.5 |
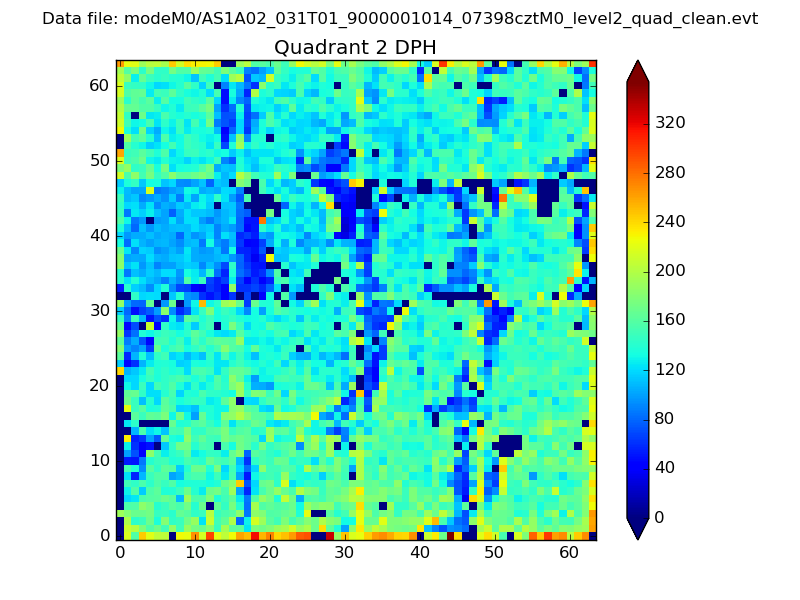
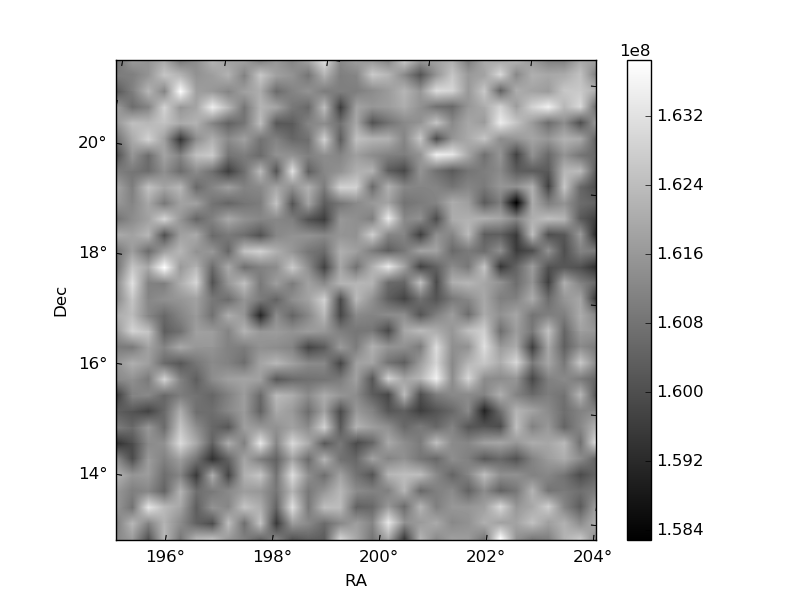
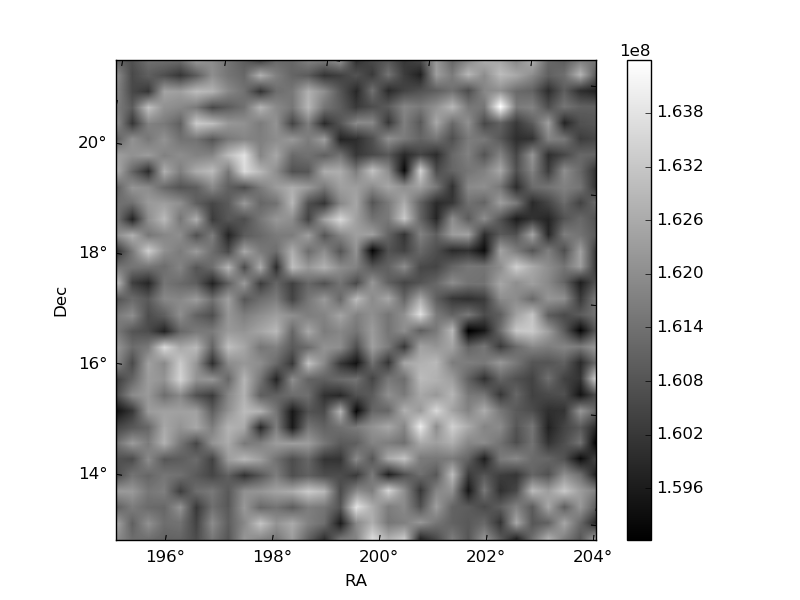
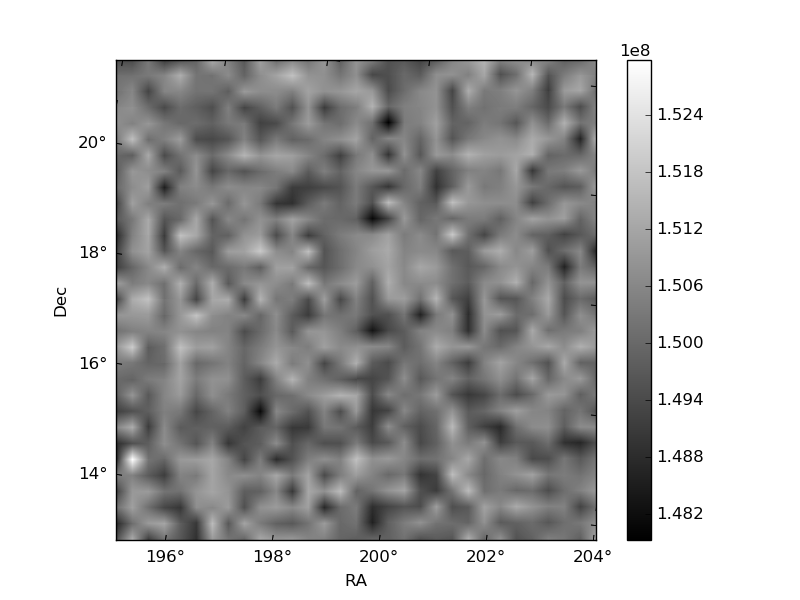
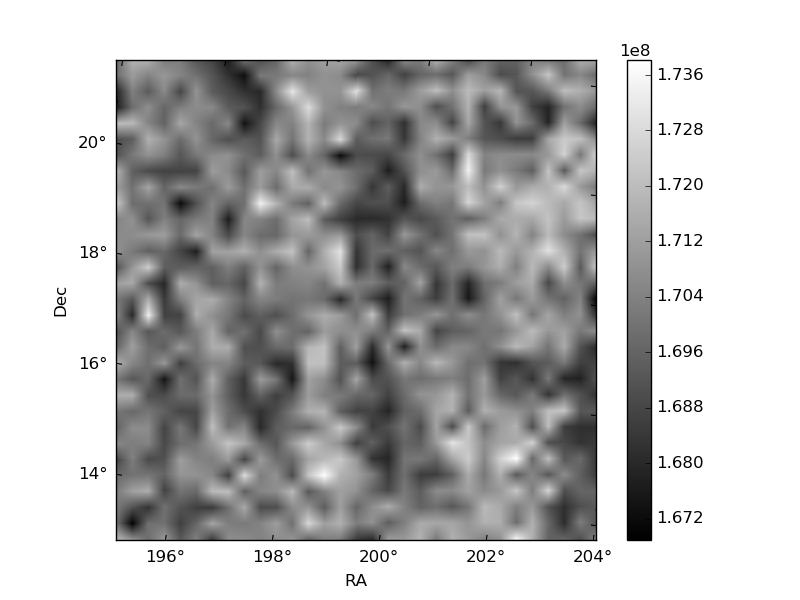
Histogram calculated using DETX and DETY for each event in the final _common_clean file
| Quadrant A |  |
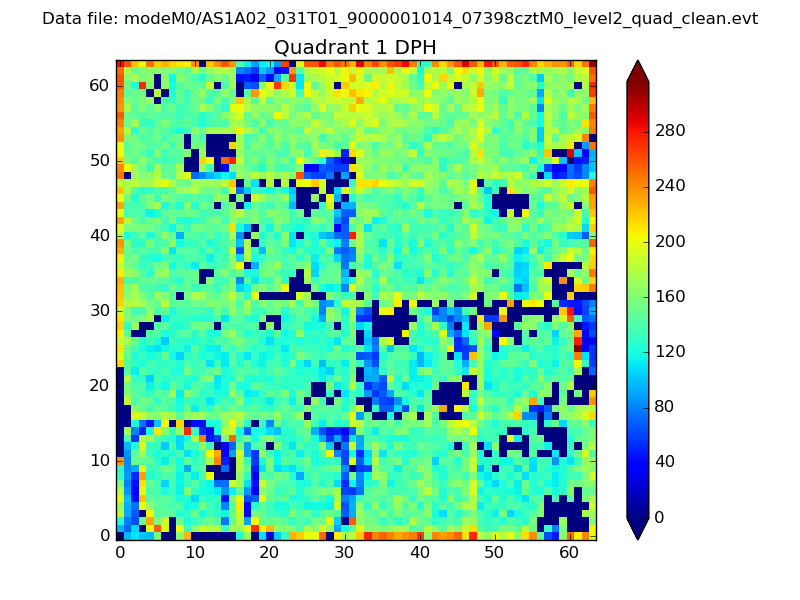 |
Quadrant B |
|---|---|---|---|
| Quadrant D | 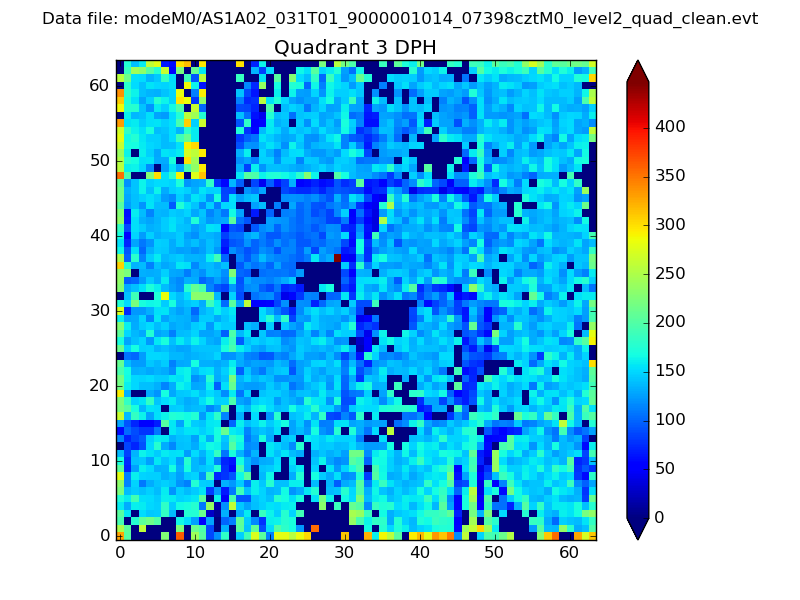 |
 |
Quadrant C |
| Plot type | Count rate plots | Images |
|---|---|---|
| Comparison with Poisson distribution Blue bars denote a histogram of data divided into 1 sec bins. Red curve is a Poisson curve with rate = median count rate of data. |
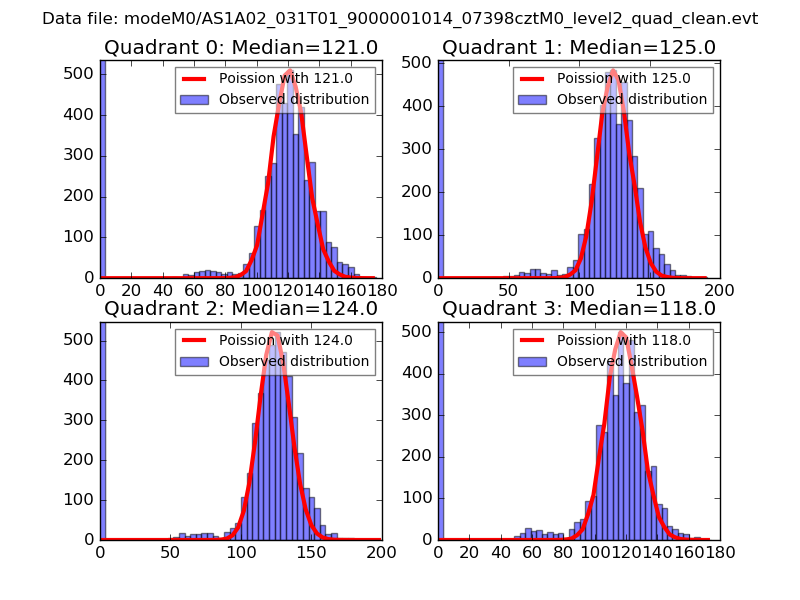 |
 |
| Quadrant-wise count rates Data is divided into 100 sec bins |
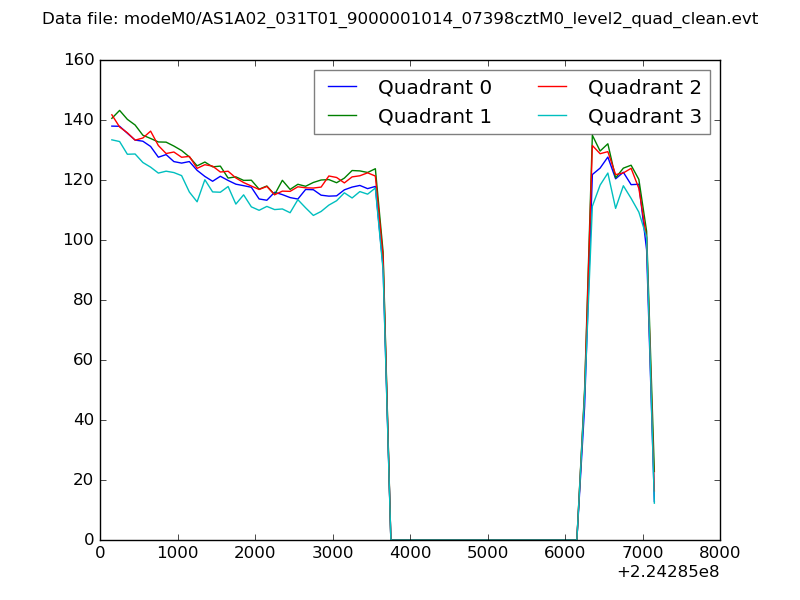 |
|
| Module-wise count rates for Quadrant A Data is divided into 100 sec bins |
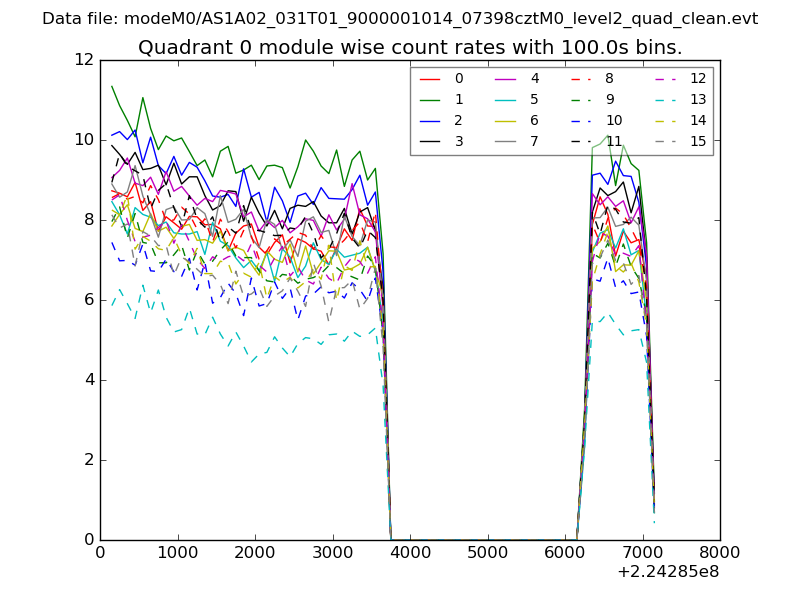 |
 |
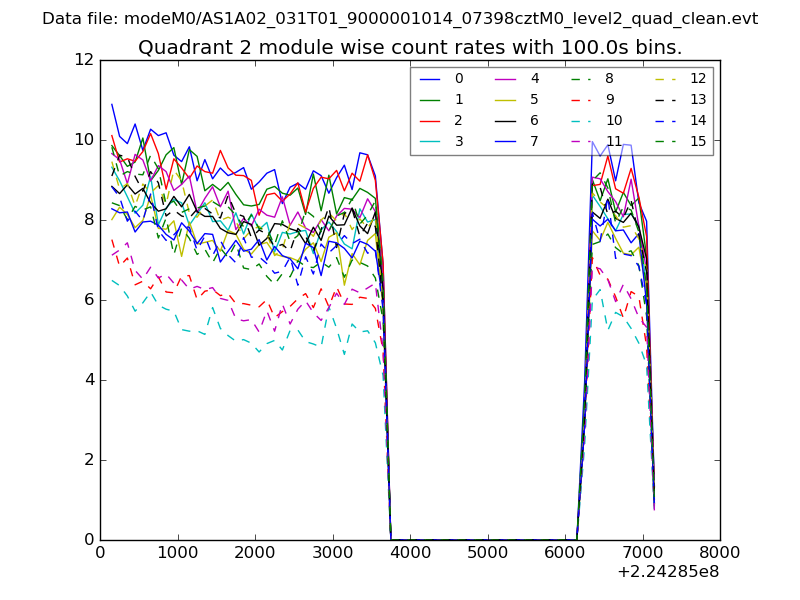
| Module-wise count rates for Quadrant B Data is divided into 100 sec bins |
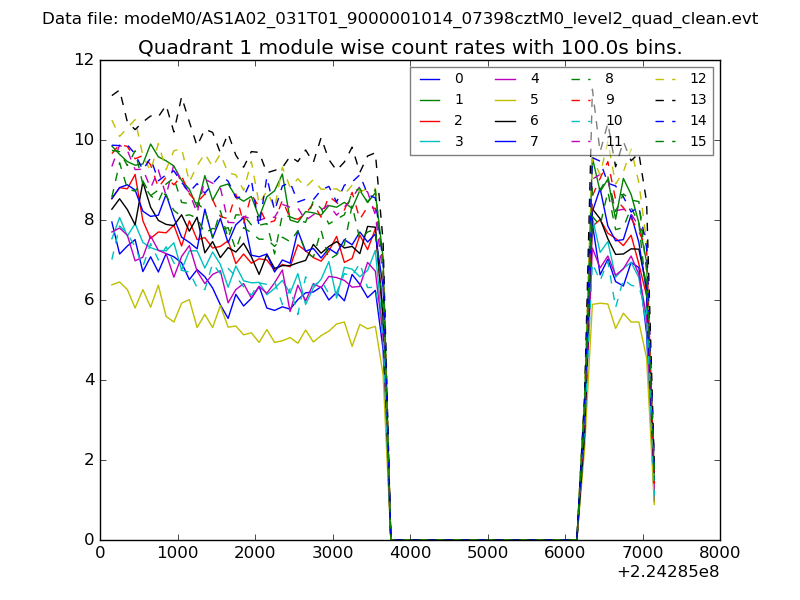 |
 |
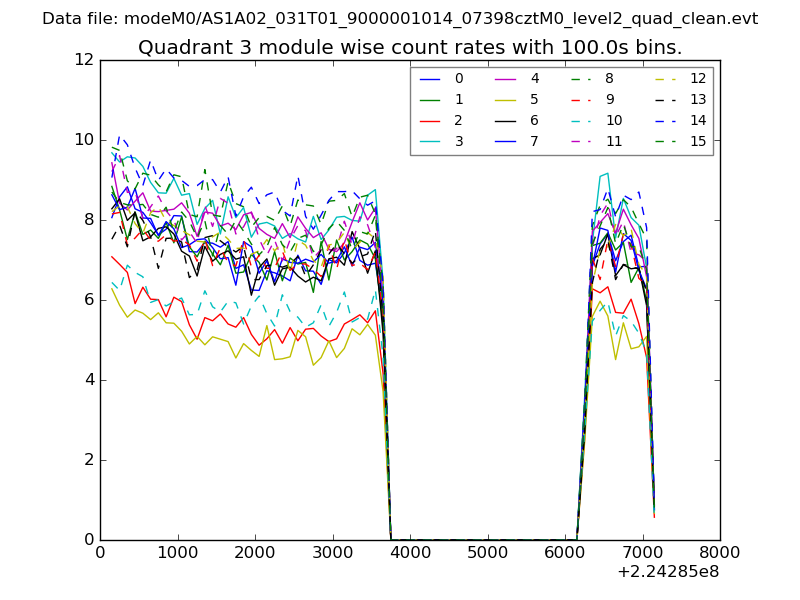
| Module-wise count rates for Quadrant C Data is divided into 100 sec bins |
 |
 |
| Module-wise count rates for Quadrant D Data is divided into 100 sec bins |
 |
 |
| Parameter | Plot |
|---|---|
| CZT HV Monitor | 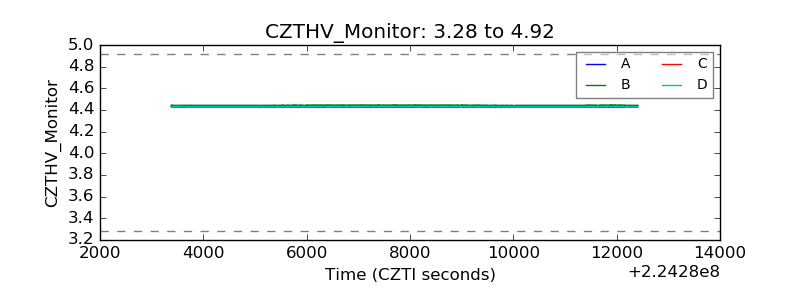 |
| D_VDD | 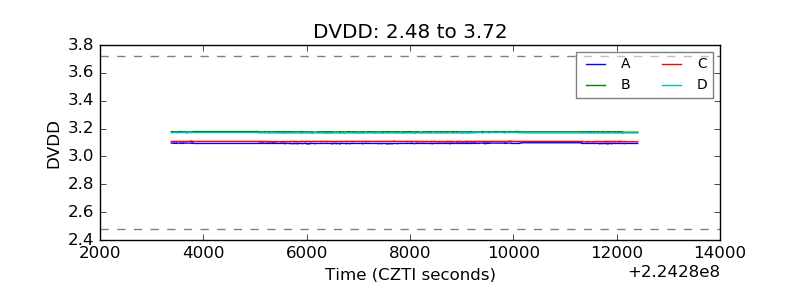 |
| Temperature 1 | 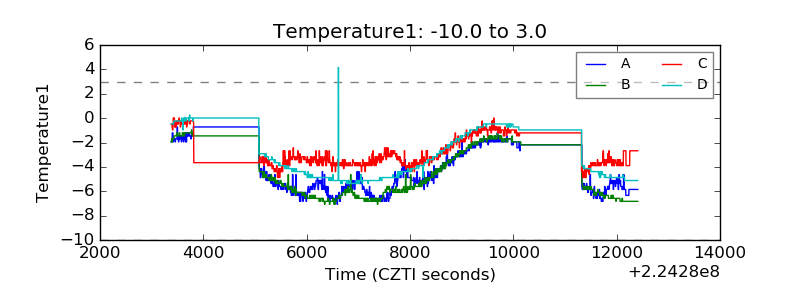 |
| Veto HV Monitor | 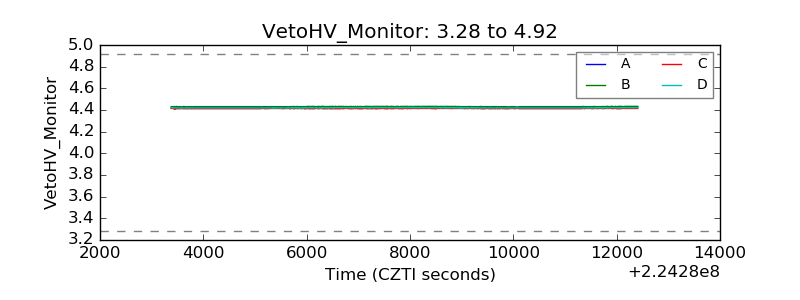 |
| Veto LLD | 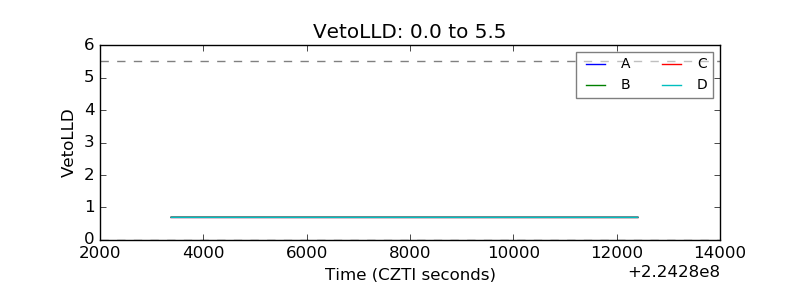 |
| Alpha Counter | 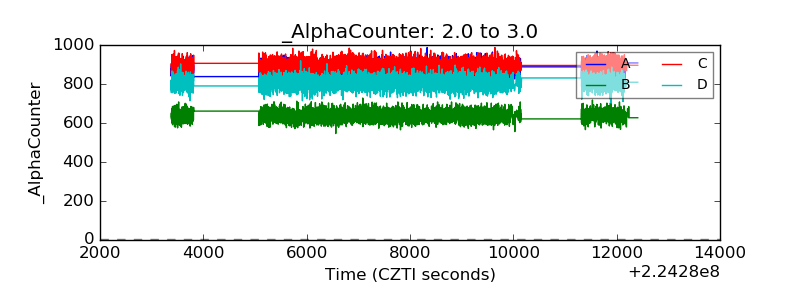 |
| _CPM_Rate | 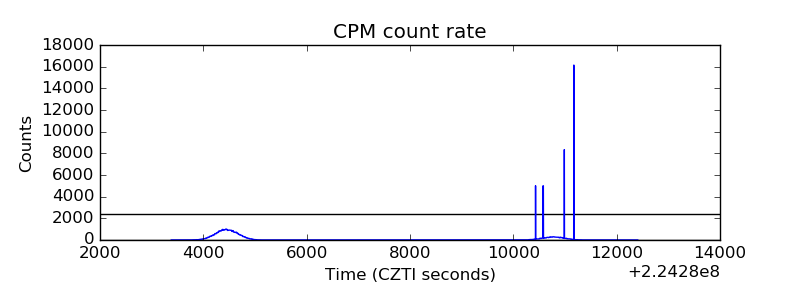 |
| CZT Counter | 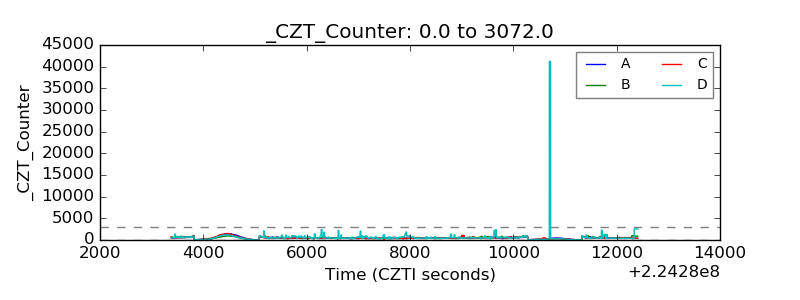 |
| +2.5 Volts monitor |  |
| +5 Volts monitor |  |
| _ROLL_ROT | 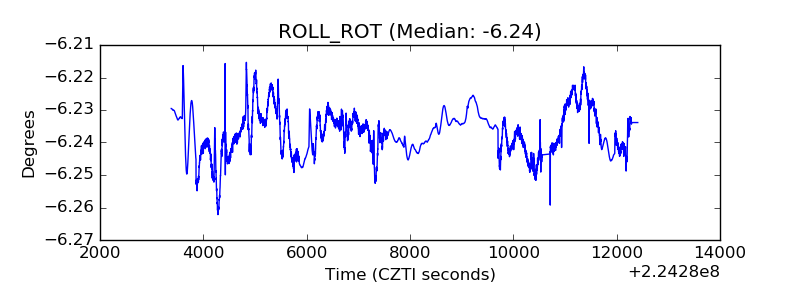 |
| _Roll_DEC | 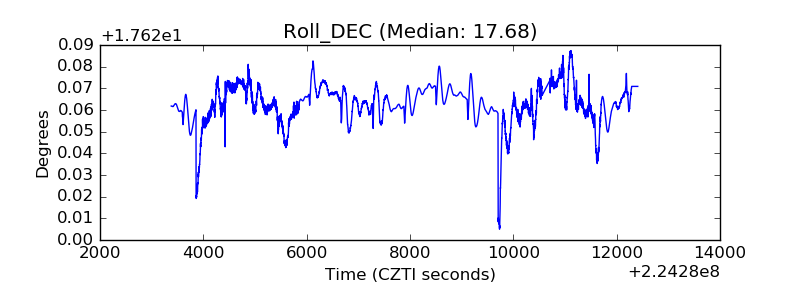 |
| _Roll_RA | 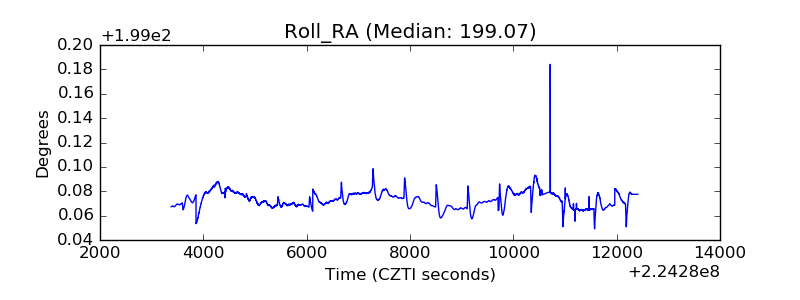 |
| Veto Counter | 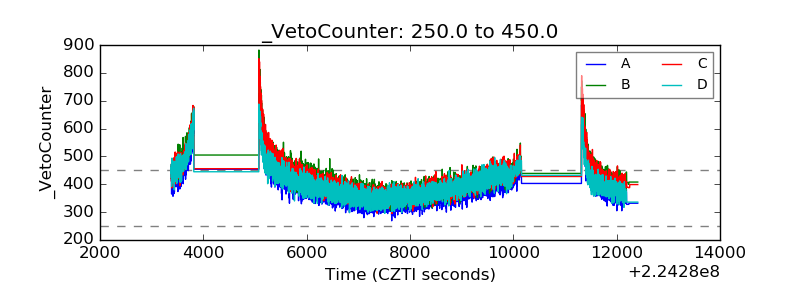 |