| Param | Original file | Final file |
|---|---|---|
| Filename | modeM0/AS1A02_031T01_9000001014_07409cztM0_level2.evt | modeM0/AS1A02_031T01_9000001014_07409cztM0_level2_quad_clean.evt |
| Size (bytes) | 88,237,440 | 24,474,240 |
| Size | 84.1 MB | 23.3 MB |
| Events in quadrant A | 557,776 | 157,365 |
| Events in quadrant B | 559,336 | 161,350 |
| Events in quadrant C | 550,448 | 161,381 |
| Events in quadrant D | 903,501 | 153,403 |
| Mode SS | |||
|---|---|---|---|
| Quadrant | BADHDUFLAG | Total packets | Discarded packets |
| A | 0 | 30 | 0 |
| B | 0 | 30 | 0 |
| C | 0 | 30 | 0 |
| D | 0 | 30 | 0 |
| Mode M0 | |||
|---|---|---|---|
| Quadrant | BADHDUFLAG | Total packets | Discarded packets |
| A | 0 | 2873 | 0 |
| B | 0 | 2869 | 0 |
| C | 0 | 2870 | 0 |
| D | 0 | 3725 | 0 |
| Quadrant | Total seconds | Saturated seconds | Saturation percentage |
|---|---|---|---|
| A | 1436 | 0 | 0.000000% |
| B | 1436 | 0 | 0.000000% |
| C | 1436 | 0 | 0.000000% |
| D | 1436 | 8 | 0.557103% |
Noise dominated data is calculated using 1-second bins in cleaned event files. If a bin has >2000 counts, and if more than 50% of those come from <1% of pixels, then it is considered to be noise-dominated and hence unusable.
| Quadrant | # 1 sec bins | Bins with >0 counts | Bins with >2000 counts | High rate bins dominated by noise | Noise dominated (total time) | Noise dominated (detector-on time) | Marked lightcurve |
|---|---|---|---|---|---|---|---|
| A | 1436 | 1436 | 0 | 0 | 0.00% | 0.00% | 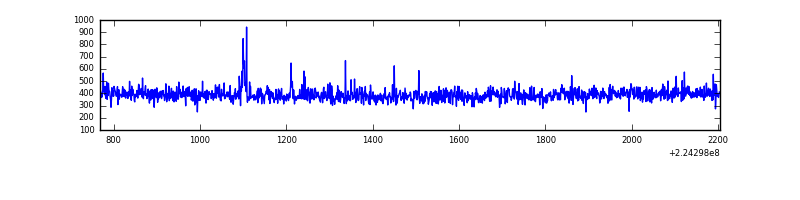 |
| B | 1436 | 1436 | 0 | 0 | 0.00% | 0.00% | 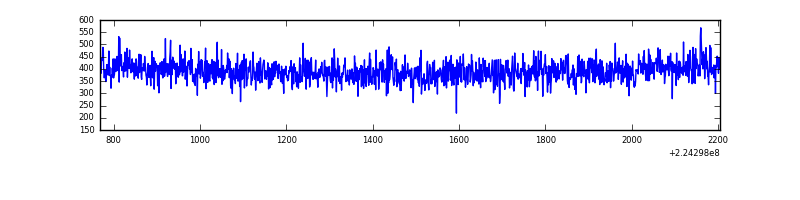 |
| C | 1436 | 1436 | 0 | 0 | 0.00% | 0.00% | 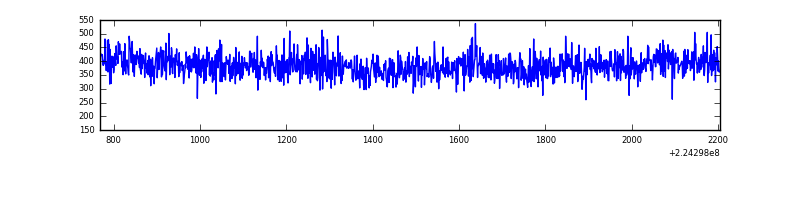 |
| D | 1436 | 1436 | 7 | 7 | 0.49% | 0.49% | 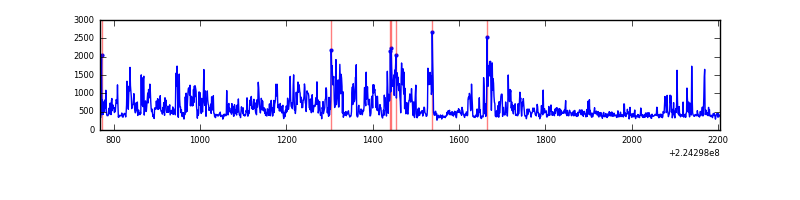 |
Top three noisy pixels from each quadrant. If the there are fewer than three noisy pixels in the level2.evt file, extra rows are filled as -1
| Pixel properties | Quadrant properties | ||||||
|---|---|---|---|---|---|---|---|
| Quadrant | DetID | PixID | Counts | Sigma | Mean | Median | Sigma |
| A | 4 | 2 | 5300 | 164.29 | 143 | 140 | 31.4 |
| A | 3 | 1 | 1421 | 40.79 | 143 | 140 | 31.4 |
| A | 0 | 226 | 1401 | 40.15 | 143 | 140 | 31.4 |
| B | 12 | 111 | 2851 | 91.36 | 144 | 140 | 29.7 |
| B | 11 | 111 | 2286 | 72.32 | 144 | 140 | 29.7 |
| B | 14 | 111 | 1613 | 49.64 | 144 | 140 | 29.7 |
| C | 8 | 128 | 1485 | 39.3 | 140 | 141 | 34.2 |
| C | 13 | 61 | 1038 | 26.23 | 140 | 141 | 34.2 |
| C | 8 | 112 | 764 | 18.22 | 140 | 141 | 34.2 |
| D | 2 | 216 | 349869 | 9790.21 | 139 | 134 | 35.7 |
| D | 5 | 233 | 15161 | 420.65 | 139 | 134 | 35.7 |
| D | 1 | 52 | 9927 | 274.14 | 139 | 134 | 35.7 |
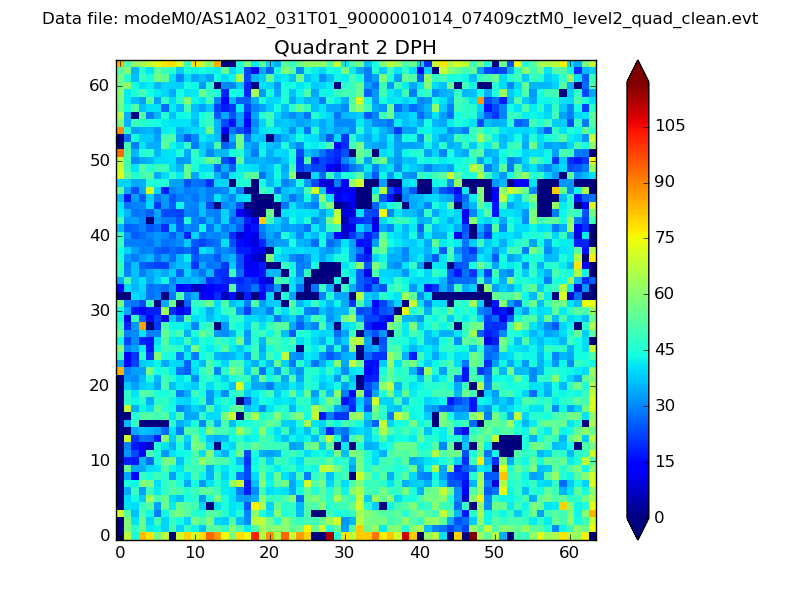
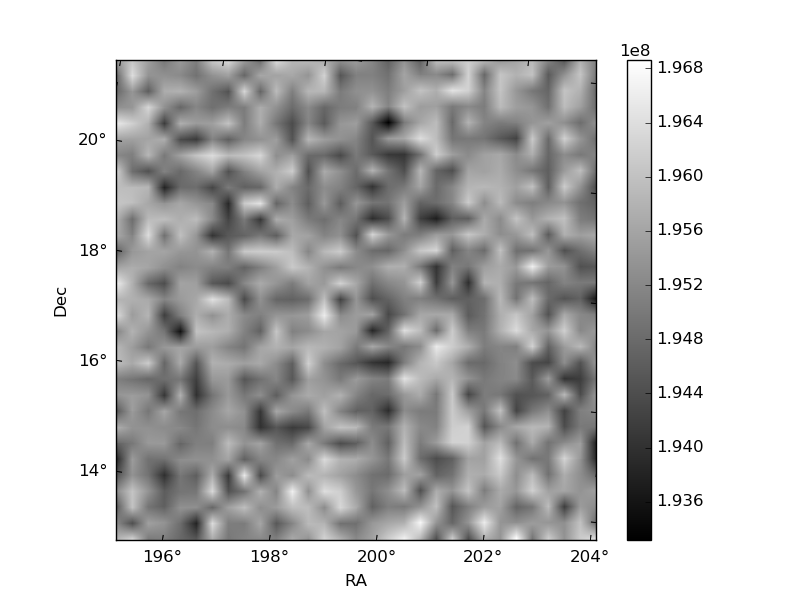
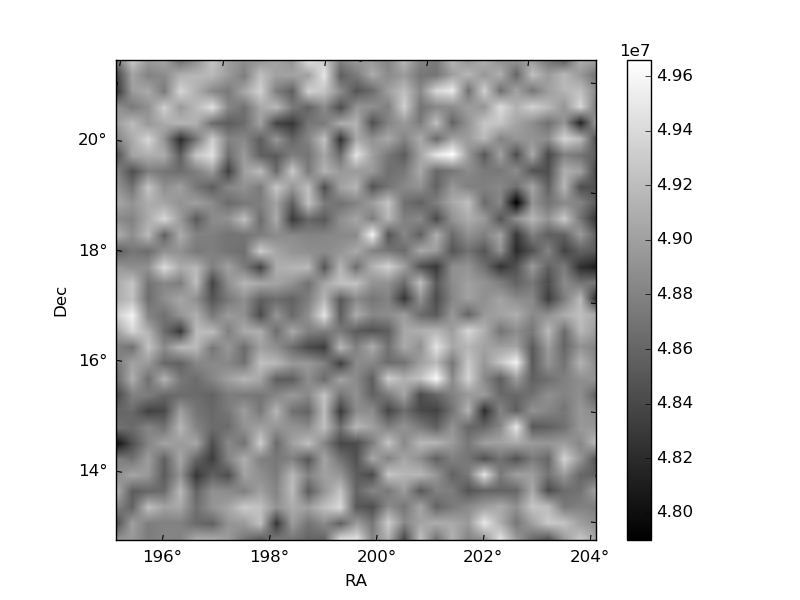
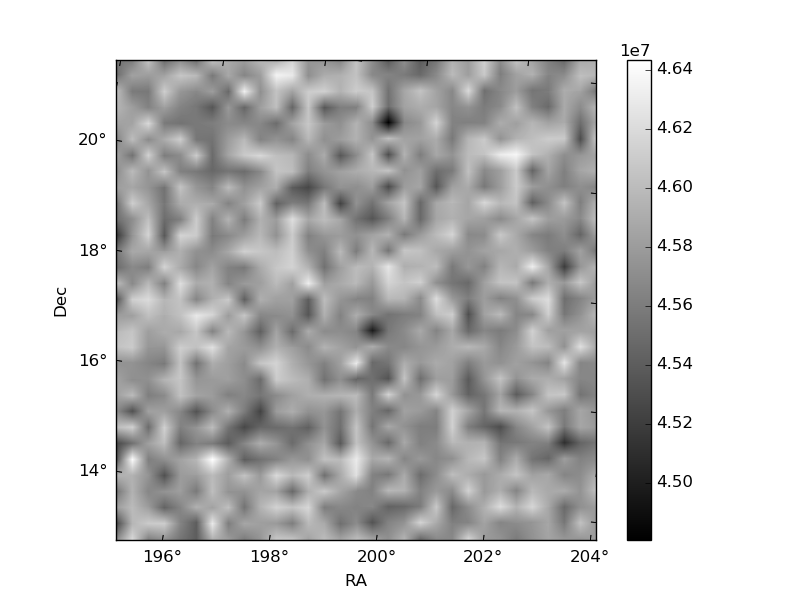
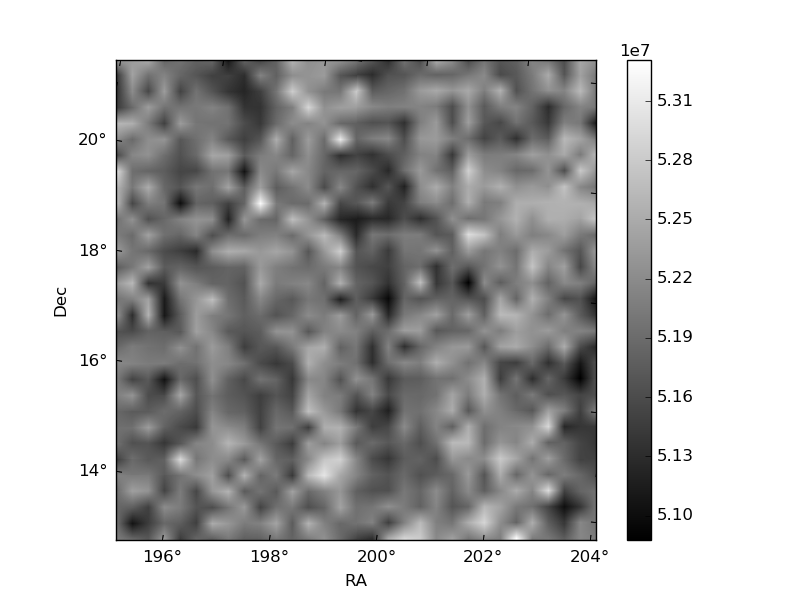
Histogram calculated using DETX and DETY for each event in the final _common_clean file
| Quadrant A | 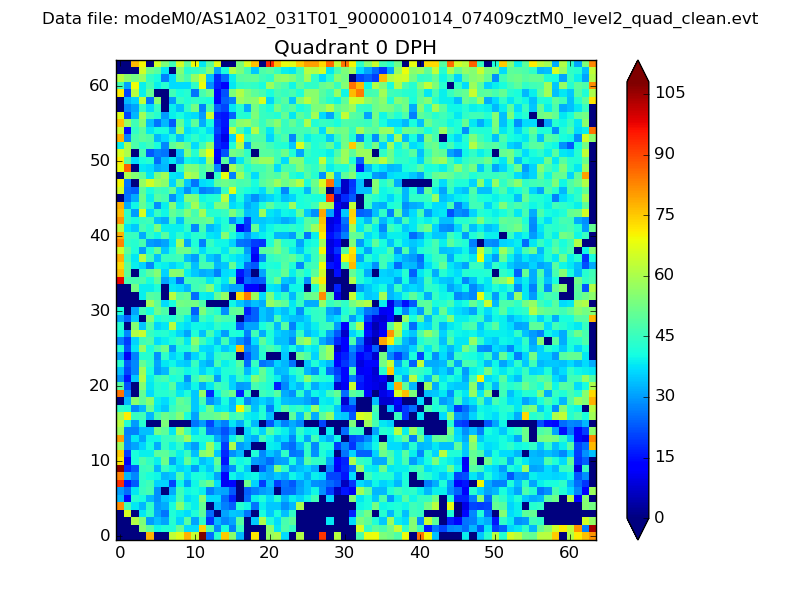 |
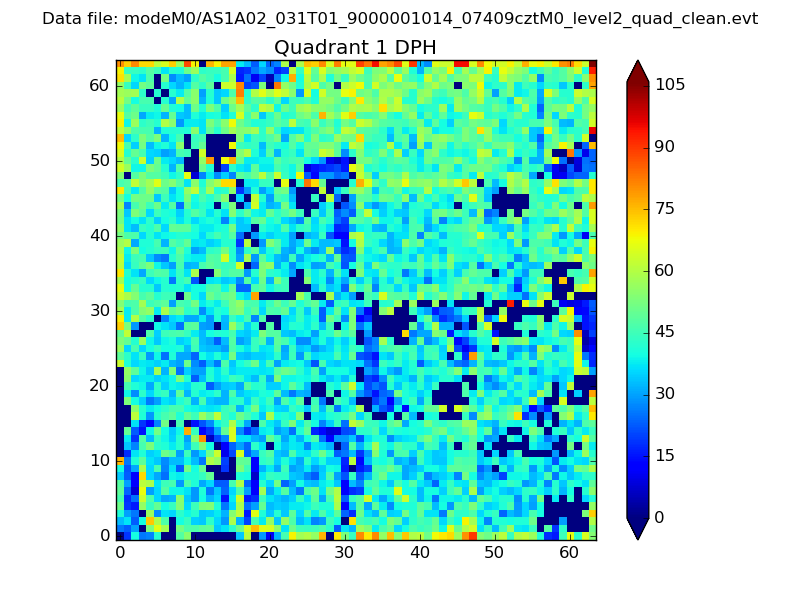 |
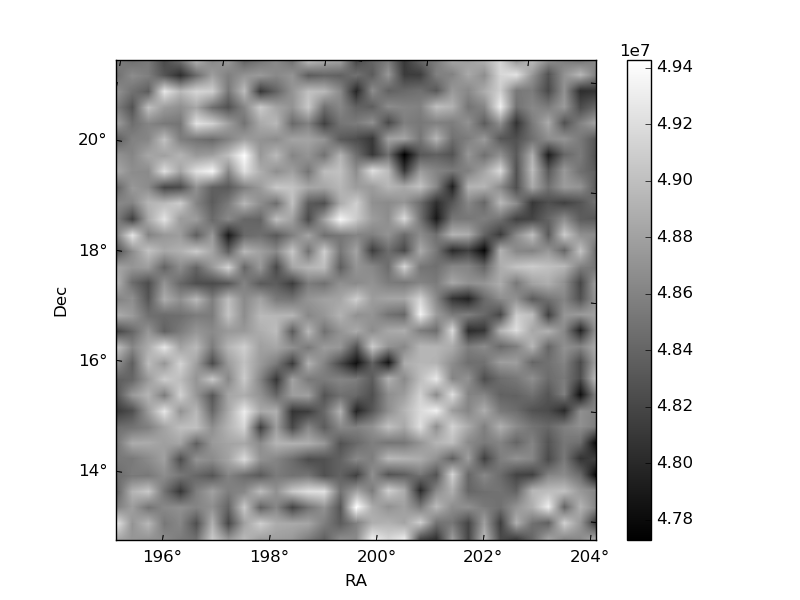
Quadrant B |
|---|---|---|---|
| Quadrant D | 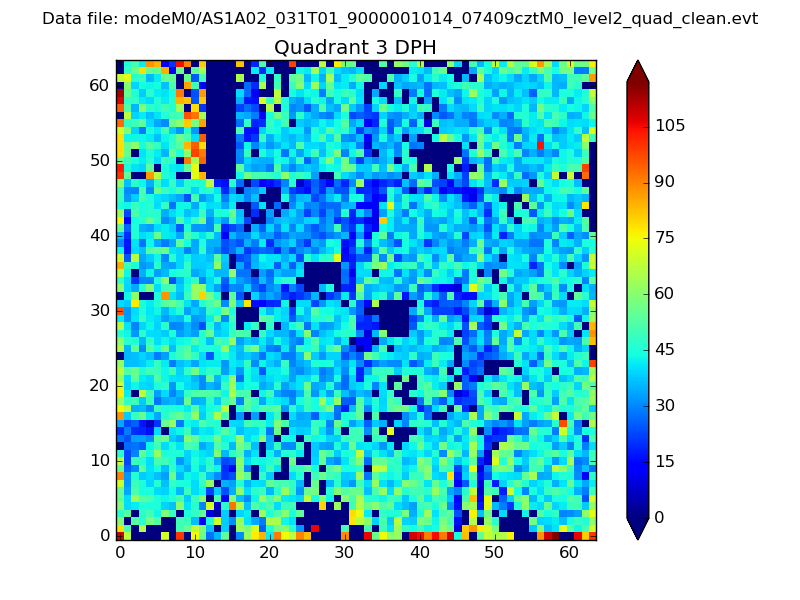 |
 |
Quadrant C |
| Plot type | Count rate plots | Images |
|---|---|---|
| Comparison with Poisson distribution Blue bars denote a histogram of data divided into 1 sec bins. Red curve is a Poisson curve with rate = median count rate of data. |
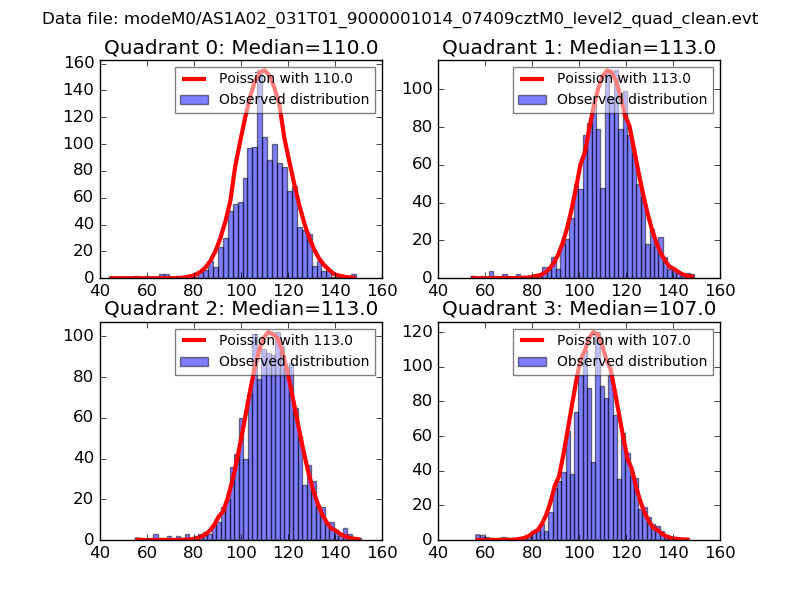 |
 |
| Quadrant-wise count rates Data is divided into 100 sec bins |
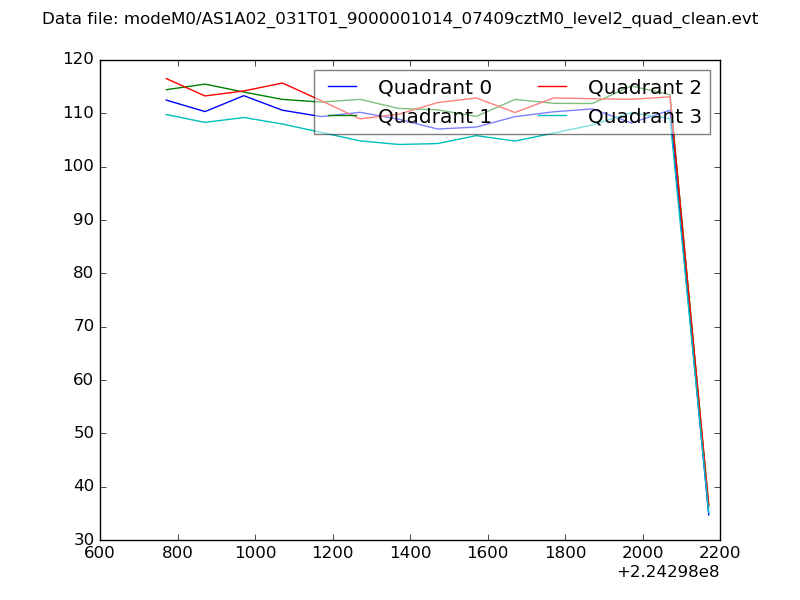 |
|
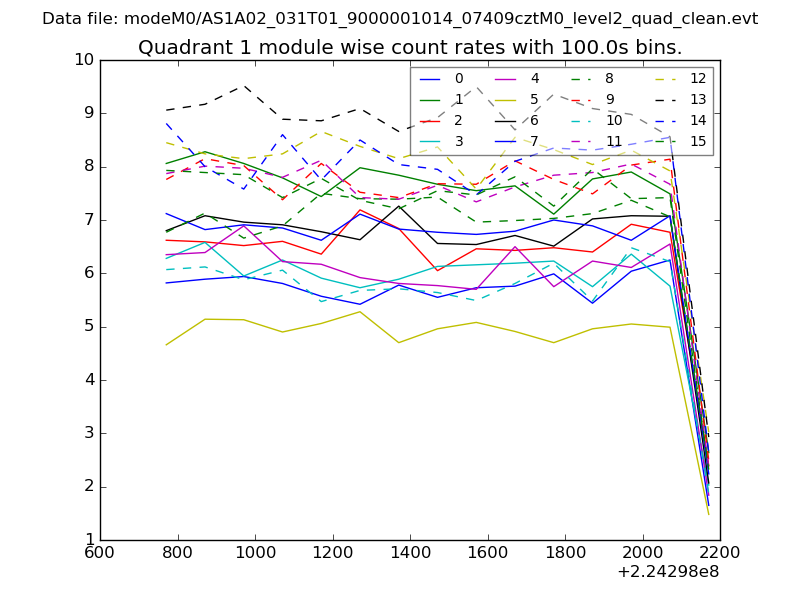
| Module-wise count rates for Quadrant A Data is divided into 100 sec bins |
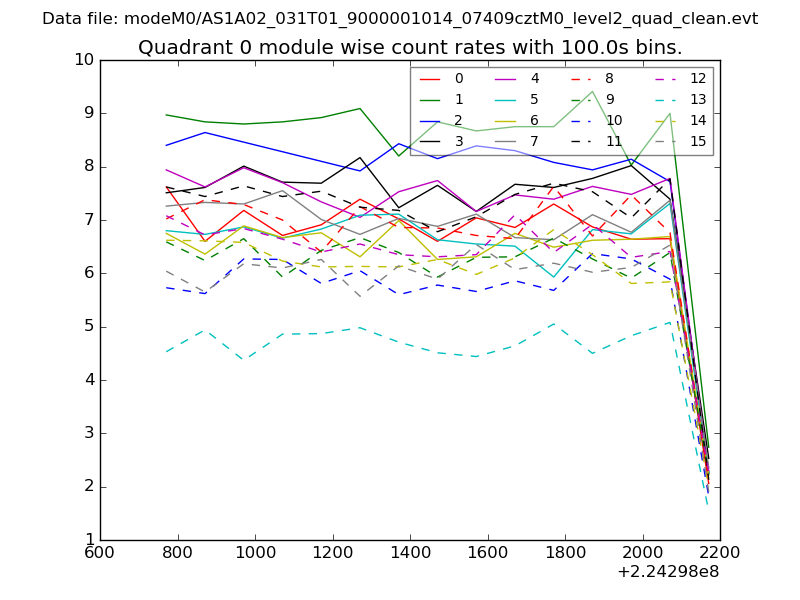 |
 |
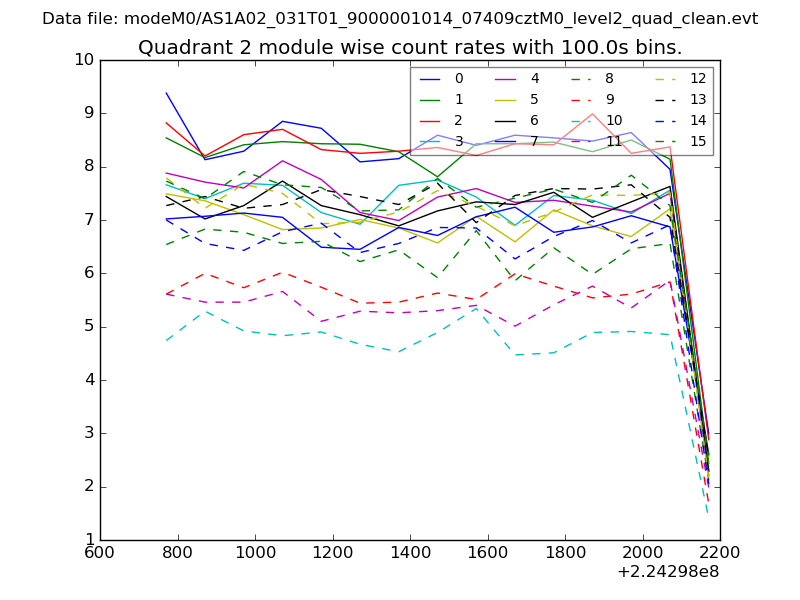
| Module-wise count rates for Quadrant B Data is divided into 100 sec bins |
 |
 |
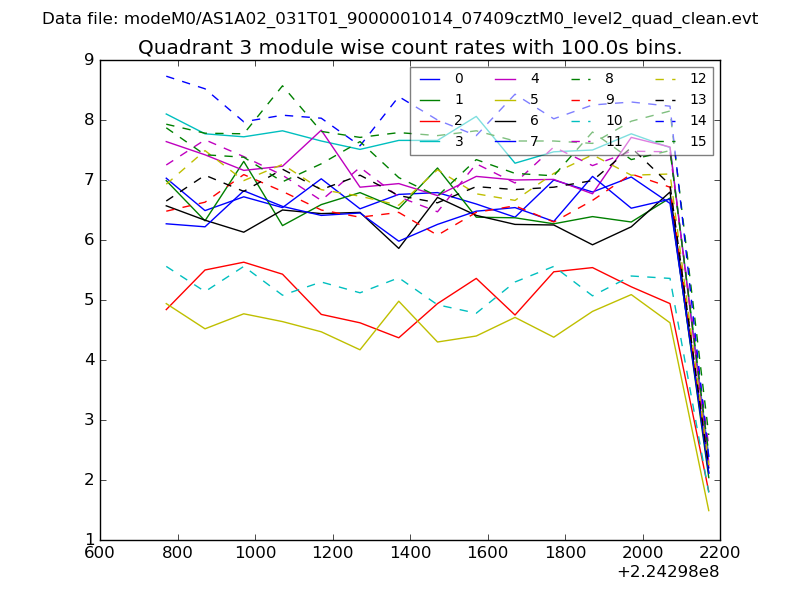
| Module-wise count rates for Quadrant C Data is divided into 100 sec bins |
 |
 |
| Module-wise count rates for Quadrant D Data is divided into 100 sec bins |
 |
 |
| Parameter | Plot |
|---|---|
| CZT HV Monitor | 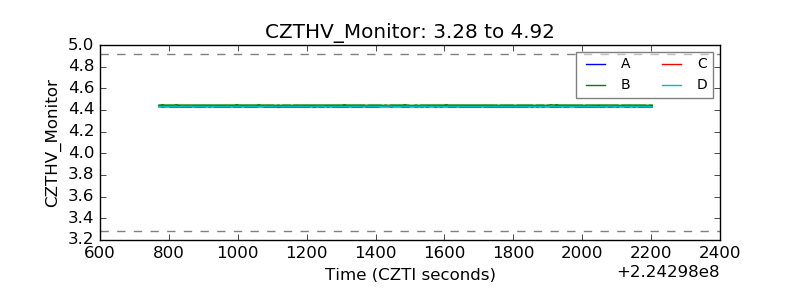 |
| D_VDD | 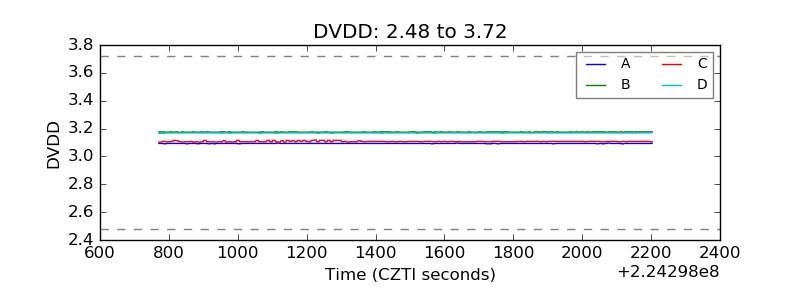 |
| Temperature 1 | 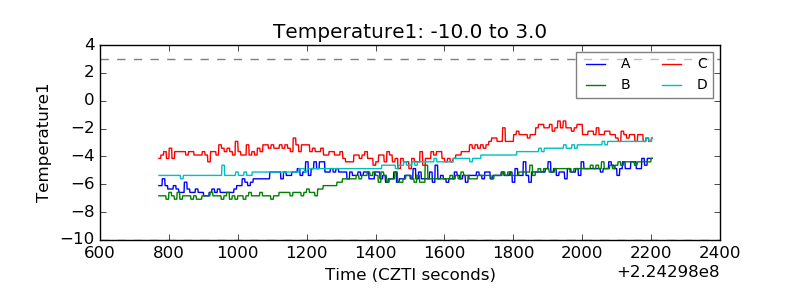 |
| Veto HV Monitor | 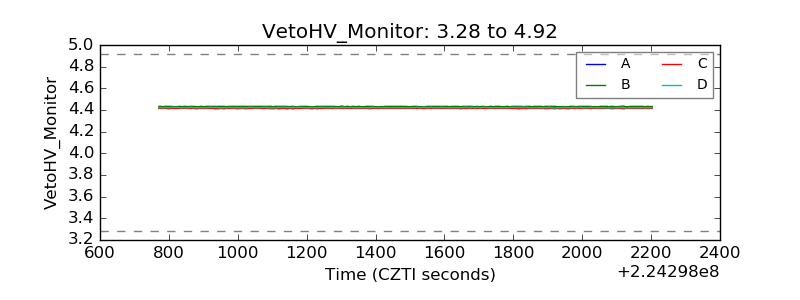 |
| Veto LLD | 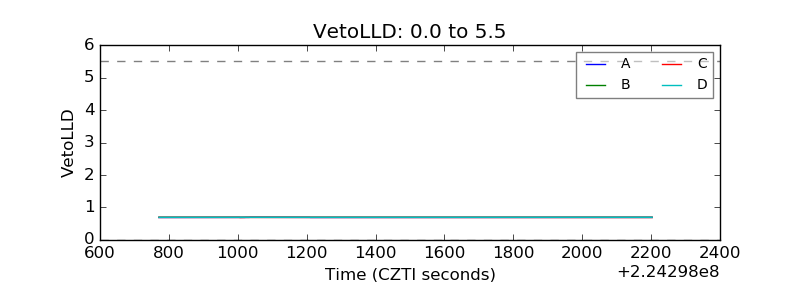 |
| Alpha Counter | 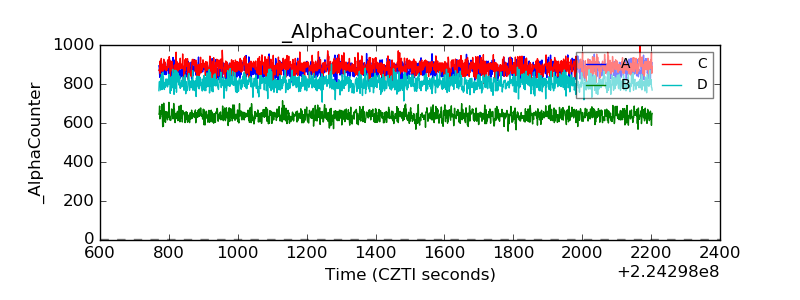 |
| _CPM_Rate | 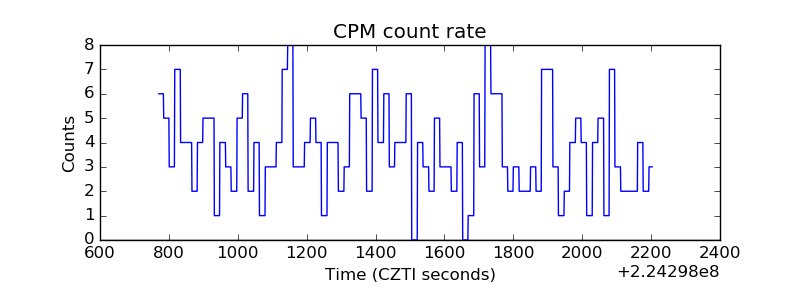 |
| CZT Counter | 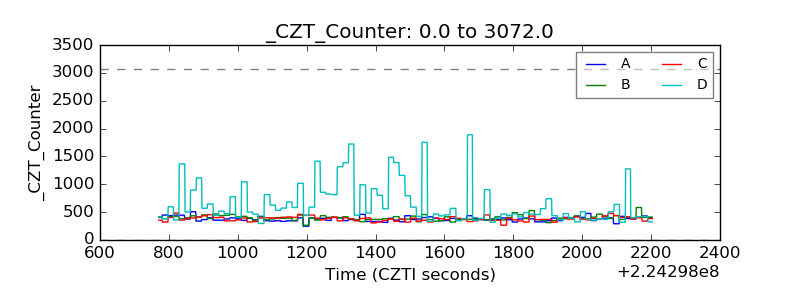 |
| +2.5 Volts monitor |  |
| +5 Volts monitor |  |
| _ROLL_ROT | 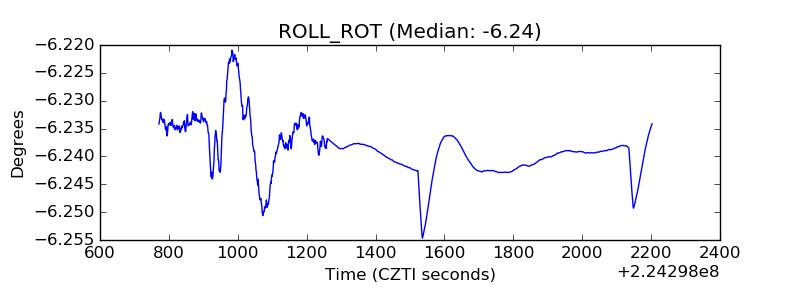 |
| _Roll_DEC | 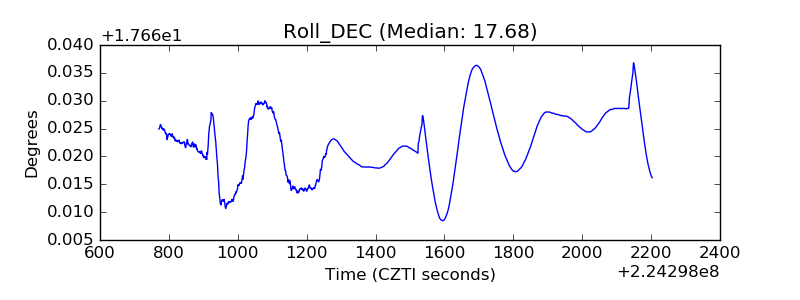 |
| _Roll_RA | 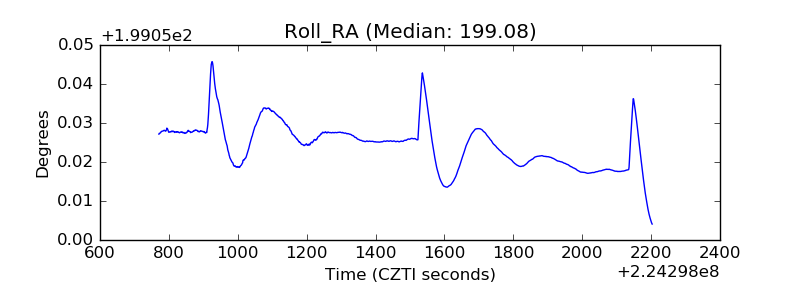 |
| Veto Counter | 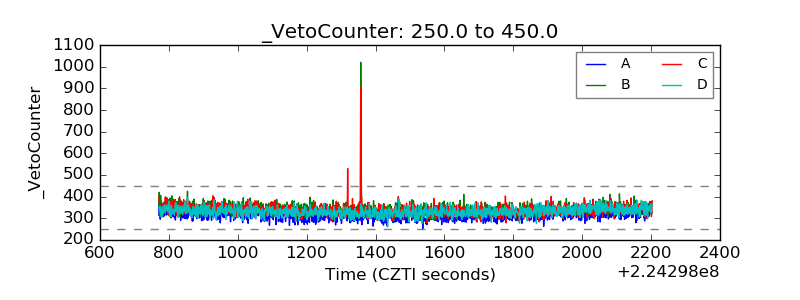 |