| Param | Original file | Final file |
|---|---|---|
| Filename | modeM0/AS1A02_150T03_9000001018_07408cztM0_level2.evt | modeM0/AS1A02_150T03_9000001018_07408cztM0_level2_quad_clean.evt |
| Size (bytes) | 191,471,040 | 50,497,920 |
| Size | 182.6 MB | 48.2 MB |
| Events in quadrant A | 1,377,741 | 327,824 |
| Events in quadrant B | 1,418,154 | 331,332 |
| Events in quadrant C | 1,363,782 | 325,612 |
| Events in quadrant D | 1,415,145 | 312,760 |
| Mode M0 | |||
|---|---|---|---|
| Quadrant | BADHDUFLAG | Total packets | Discarded packets |
| A | 0 | 6569 | 38 |
| B | 0 | 6579 | 31 |
| C | 0 | 6571 | 37 |
| D | 0 | 6784 | 38 |
| Mode SS | |||
|---|---|---|---|
| Quadrant | BADHDUFLAG | Total packets | Discarded packets |
| A | 0 | 65 | 1 |
| B | 0 | 66 | 2 |
| C | 0 | 66 | 2 |
| D | 0 | 66 | 2 |
| Mode M9 | |||
|---|---|---|---|
| Quadrant | BADHDUFLAG | Total packets | Discarded packets |
| A | 1 | 251318637792 | 0 |
| B | 1 | -1 | -1 |
| C | 1 | -1 | -1 |
| D | 1 | -1 | -1 |
| Quadrant | Total seconds | Saturated seconds | Saturation percentage |
|---|---|---|---|
| A | 3261 | 5 | 0.153327% |
| B | 3263 | 3 | 0.091940% |
| C | 3262 | 2 | 0.061312% |
| D | 3261 | 14 | 0.429316% |
Noise dominated data is calculated using 1-second bins in cleaned event files. If a bin has >2000 counts, and if more than 50% of those come from <1% of pixels, then it is considered to be noise-dominated and hence unusable.
| Quadrant | # 1 sec bins | Bins with >0 counts | Bins with >2000 counts | High rate bins dominated by noise | Noise dominated (total time) | Noise dominated (detector-on time) | Marked lightcurve |
|---|---|---|---|---|---|---|---|
| A | 3266 | 3264 | 0 | 0 | 0.00% | 0.00% | 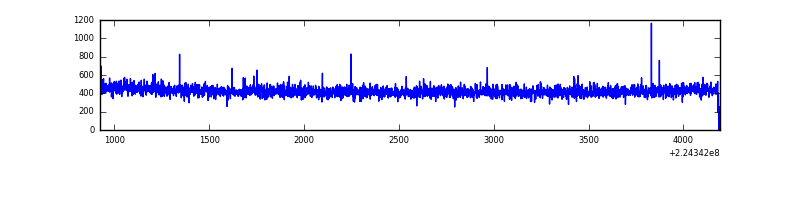 |
| B | 3268 | 3267 | 0 | 0 | 0.00% | 0.00% | 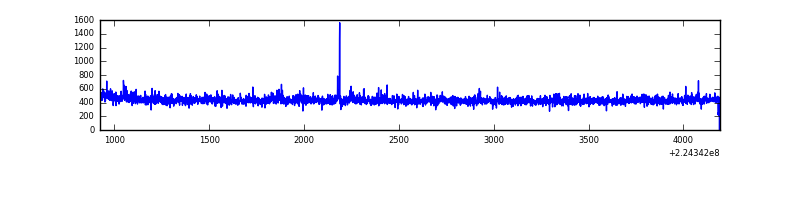 |
| C | 3265 | 3264 | 1 | 1 | 0.03% | 0.03% | 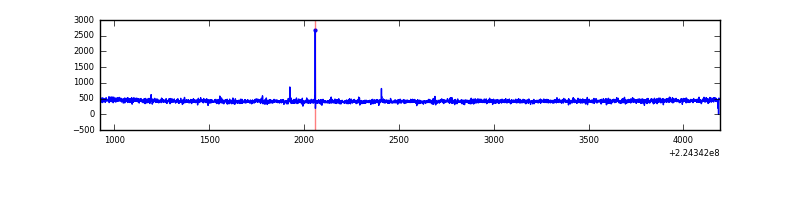 |
| D | 3266 | 3262 | 15 | 15 | 0.46% | 0.46% | 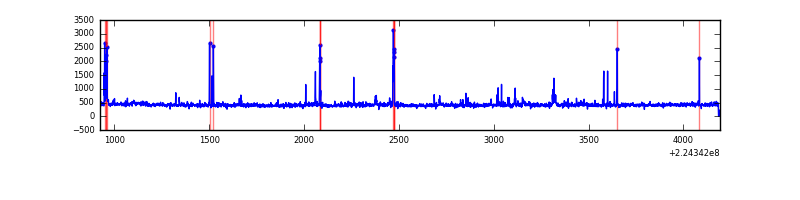 |
Top three noisy pixels from each quadrant. If the there are fewer than three noisy pixels in the level2.evt file, extra rows are filled as -1
| Pixel properties | Quadrant properties | ||||||
|---|---|---|---|---|---|---|---|
| Quadrant | DetID | PixID | Counts | Sigma | Mean | Median | Sigma |
| A | 3 | 1 | 8318 | 108.35 | 355 | 349 | 73.5 |
| A | 0 | 226 | 3357 | 40.9 | 355 | 349 | 73.5 |
| A | 12 | 194 | 3165 | 38.29 | 355 | 349 | 73.5 |
| B | 0 | 214 | 9514 | 132.78 | 360 | 352 | 69.0 |
| B | 12 | 111 | 6898 | 94.87 | 360 | 352 | 69.0 |
| B | 4 | 81 | 5909 | 80.54 | 360 | 352 | 69.0 |
| C | 12 | 4 | 4219 | 47.03 | 347 | 349 | 82.3 |
| C | 10 | 22 | 3689 | 40.59 | 347 | 349 | 82.3 |
| C | 13 | 61 | 2702 | 28.6 | 347 | 349 | 82.3 |
| D | 2 | 14 | 43573 | 502.95 | 342 | 331 | 86.0 |
| D | 2 | 216 | 33918 | 390.65 | 342 | 331 | 86.0 |
| D | 14 | 34 | 12611 | 142.83 | 342 | 331 | 86.0 |
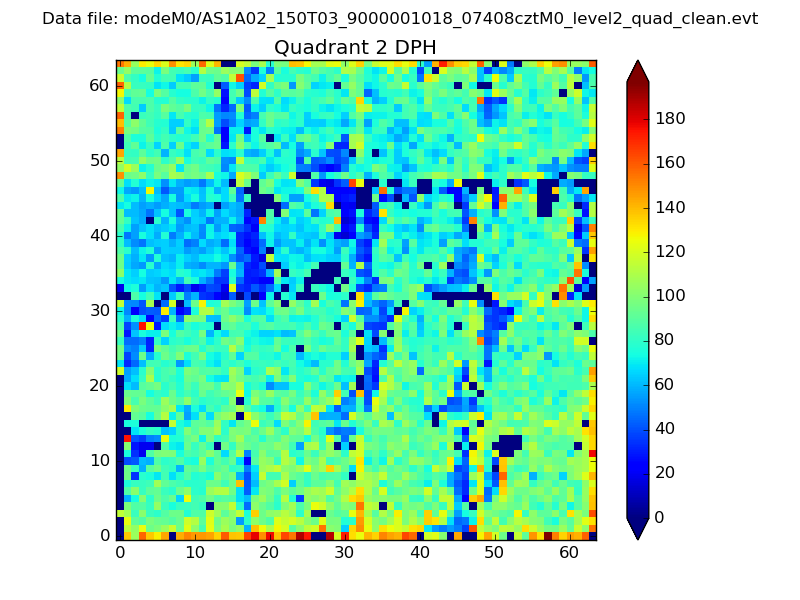
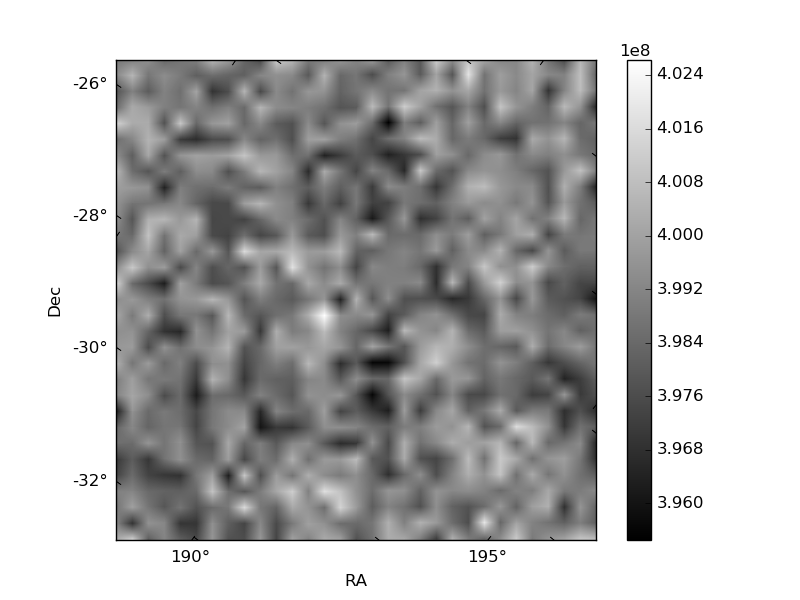
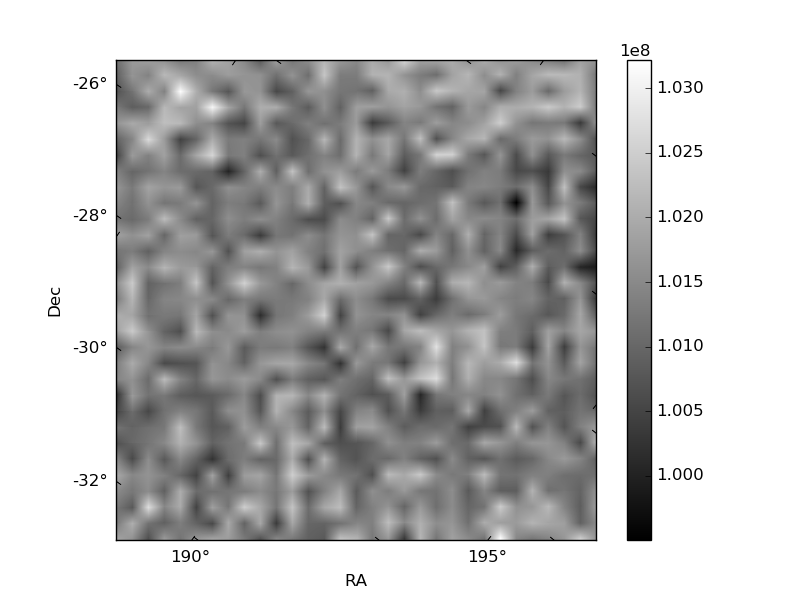
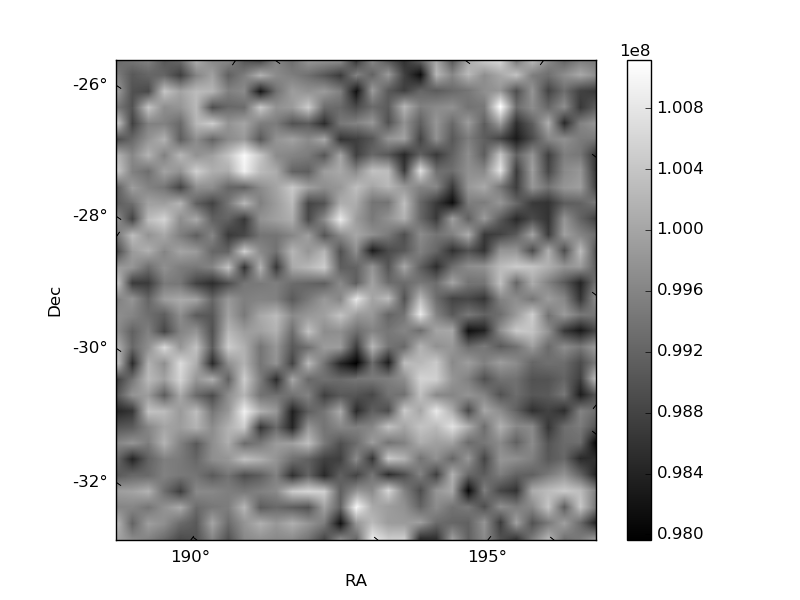
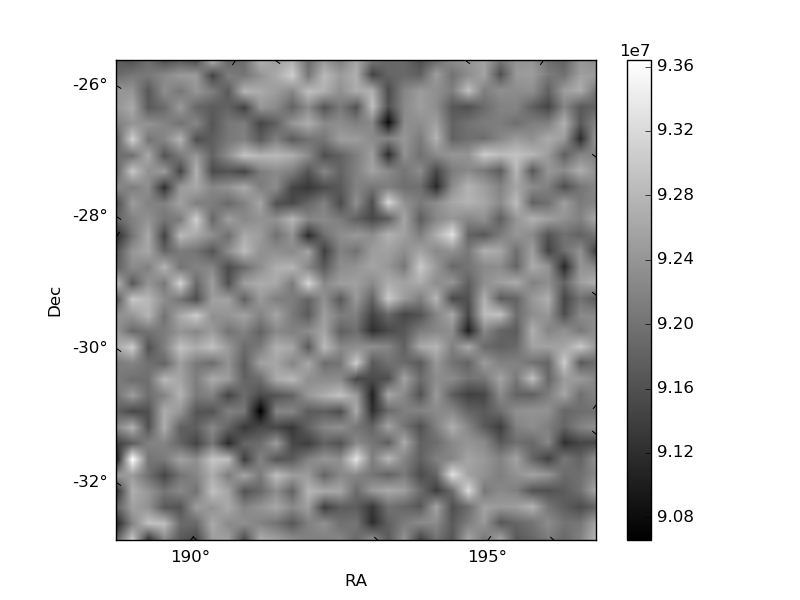
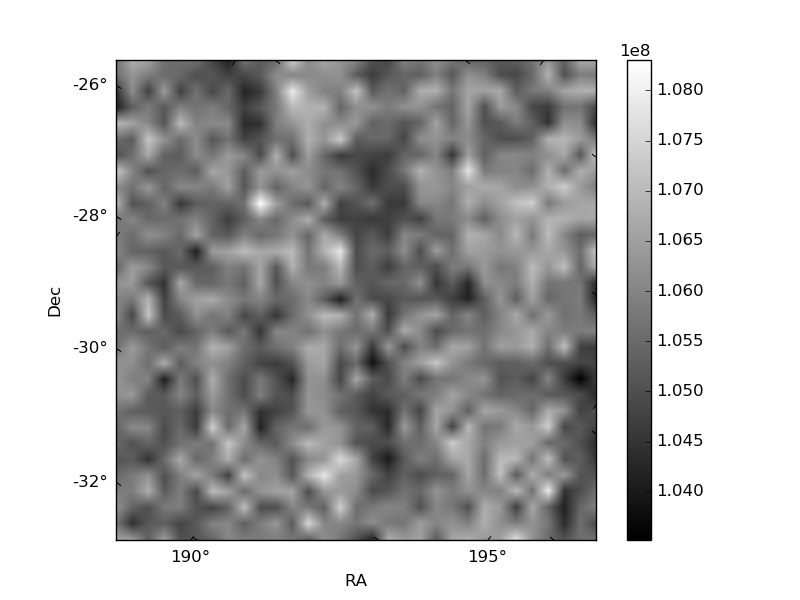
Histogram calculated using DETX and DETY for each event in the final _common_clean file
| Quadrant A | 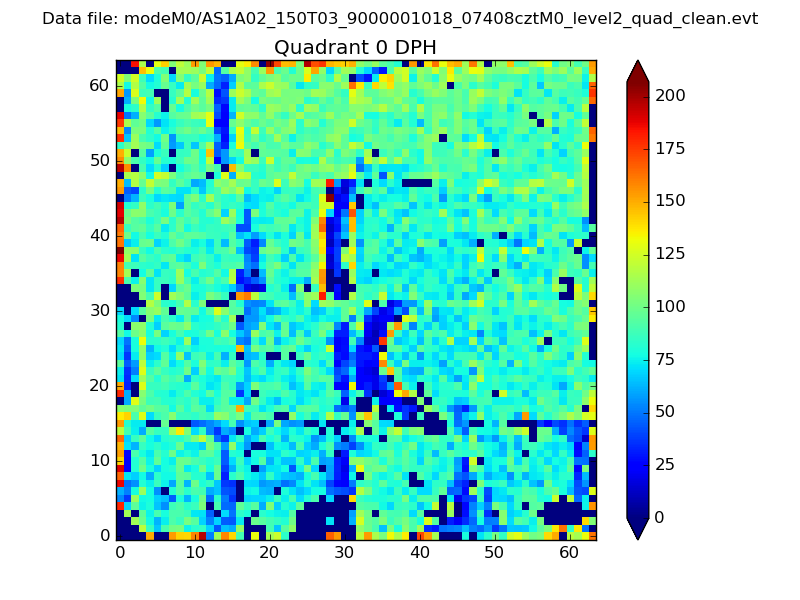 |
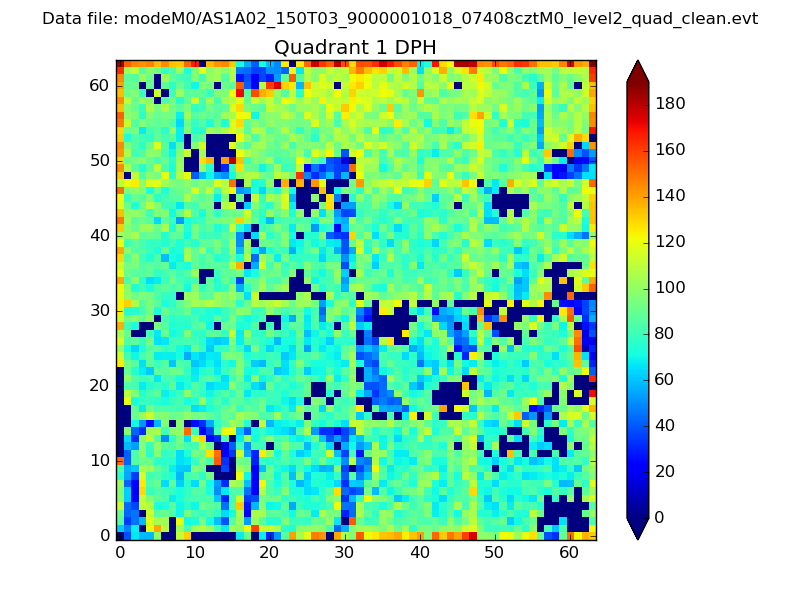 |
Quadrant B |
|---|---|---|---|
| Quadrant D | 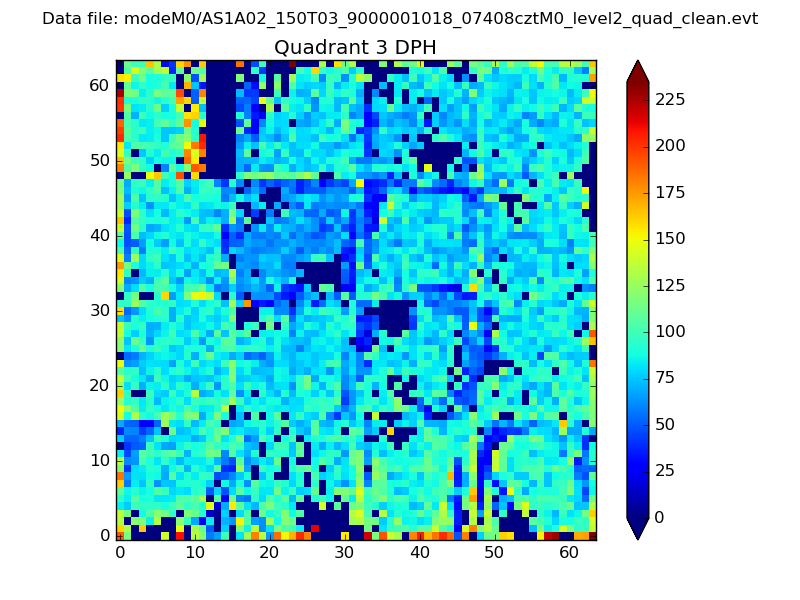 |
 |
Quadrant C |
| Plot type | Count rate plots | Images |
|---|---|---|
| Comparison with Poisson distribution Blue bars denote a histogram of data divided into 1 sec bins. Red curve is a Poisson curve with rate = median count rate of data. |
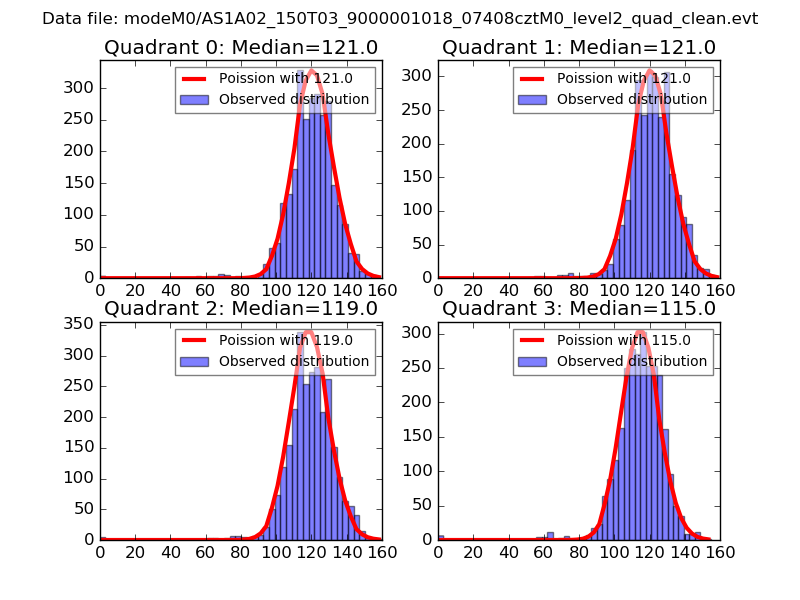 |
 |
| Quadrant-wise count rates Data is divided into 100 sec bins |
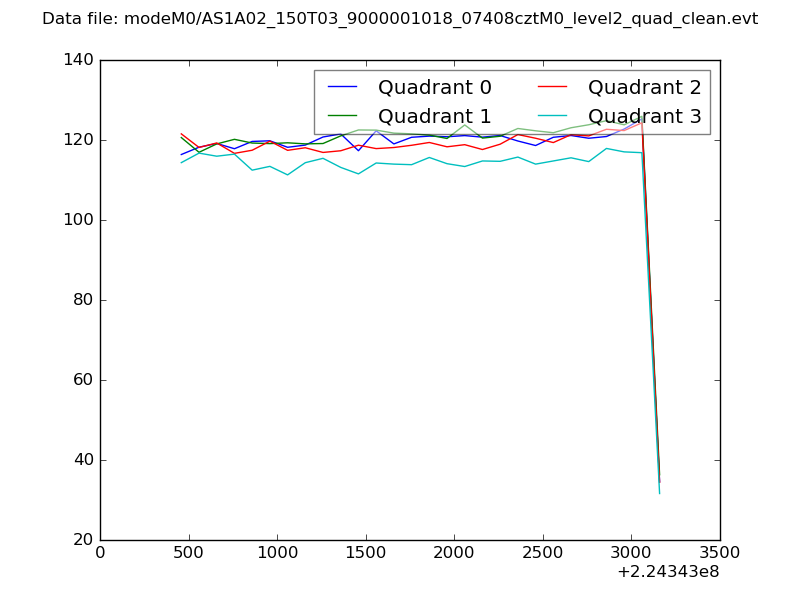 |
|
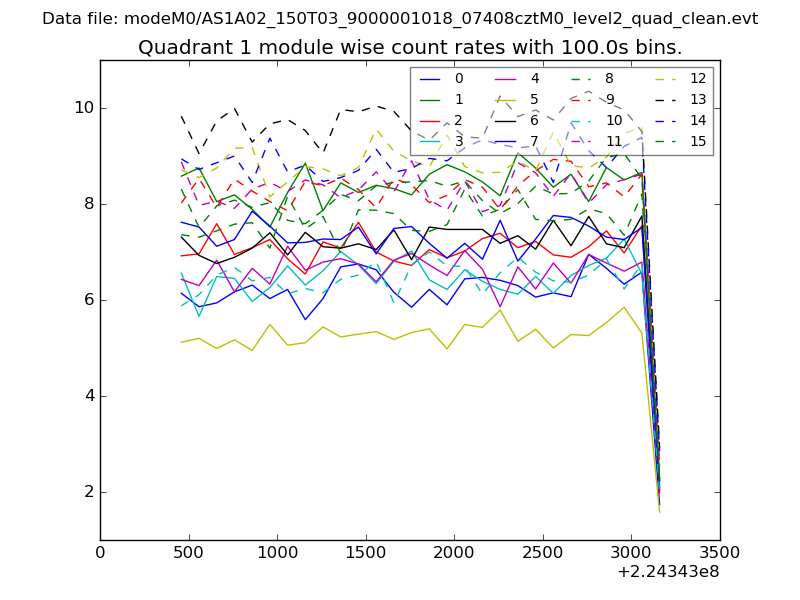
| Module-wise count rates for Quadrant A Data is divided into 100 sec bins |
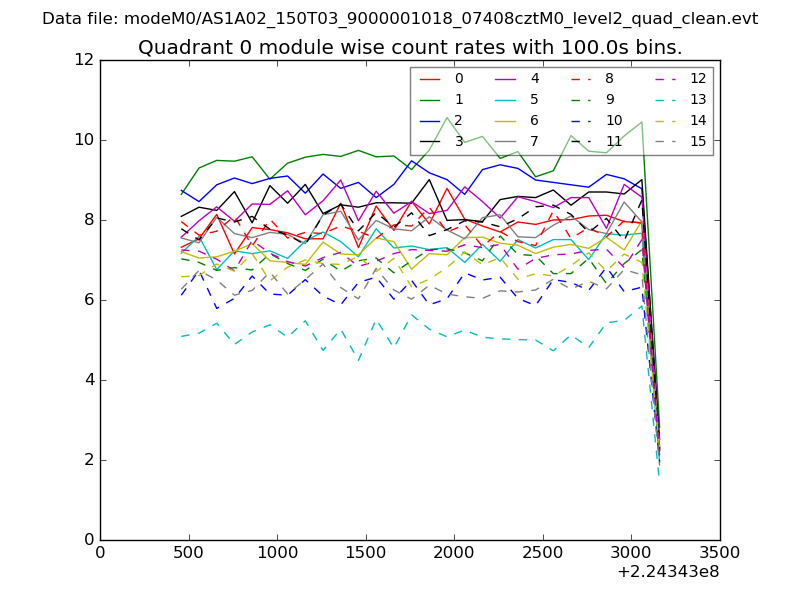 |
 |
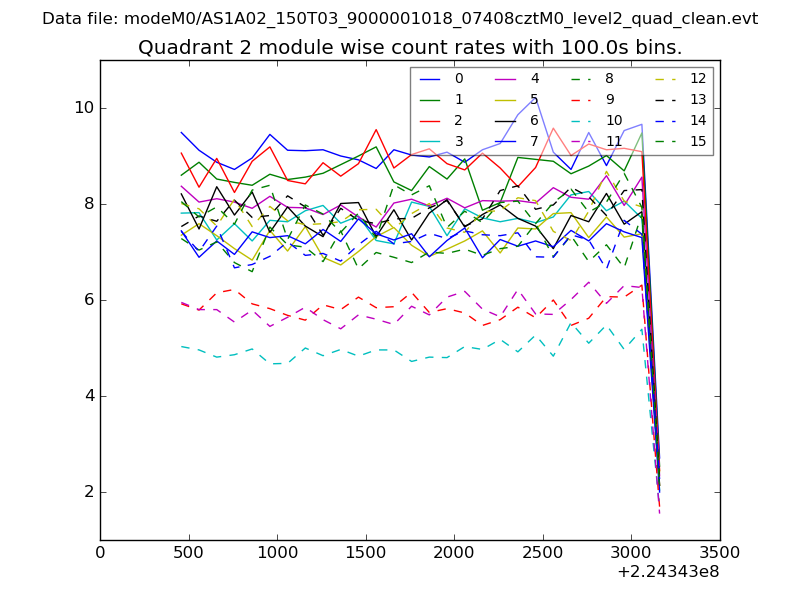
| Module-wise count rates for Quadrant B Data is divided into 100 sec bins |
 |
 |
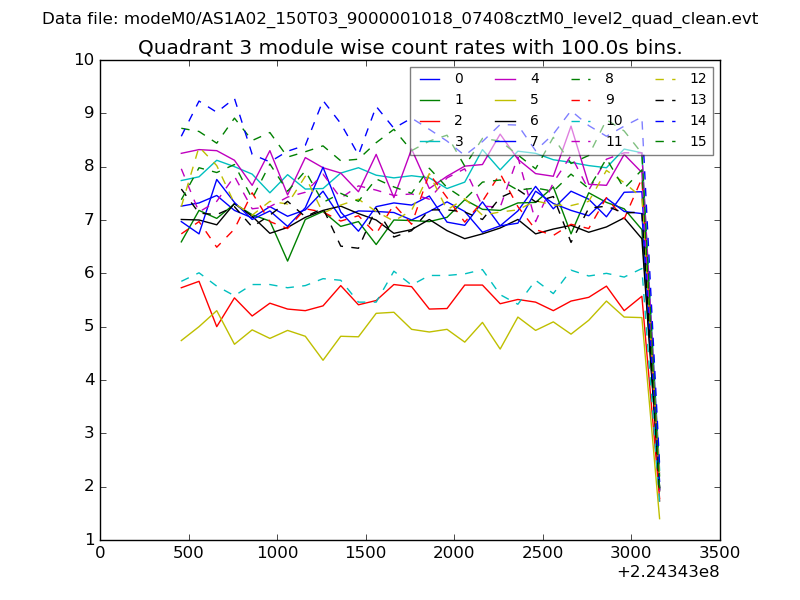
| Module-wise count rates for Quadrant C Data is divided into 100 sec bins |
 |
 |
| Module-wise count rates for Quadrant D Data is divided into 100 sec bins |
 |
 |
| Parameter | Plot |
|---|---|
| CZT HV Monitor | 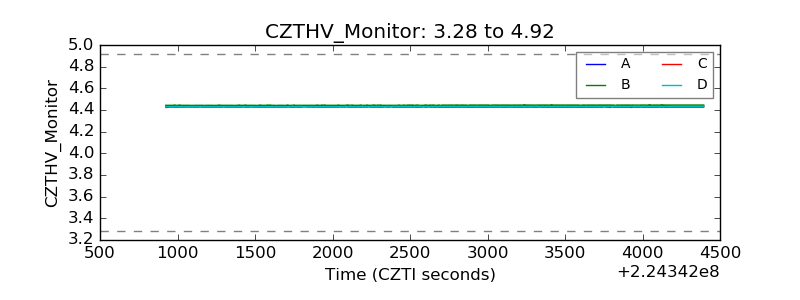 |
| D_VDD | 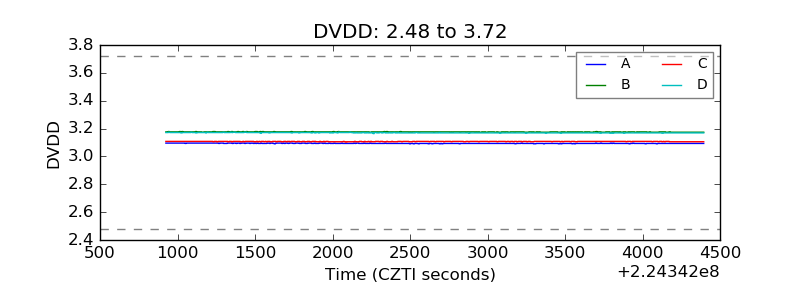 |
| Temperature 1 | 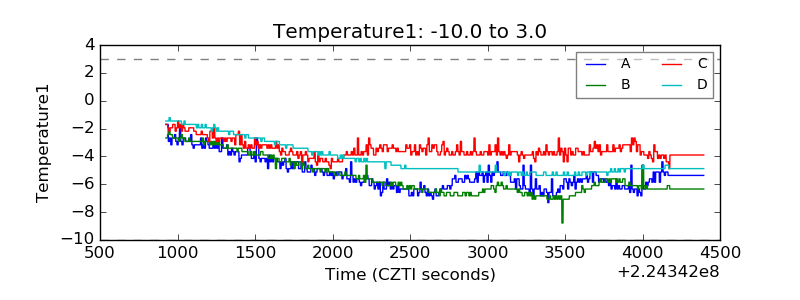 |
| Veto HV Monitor | 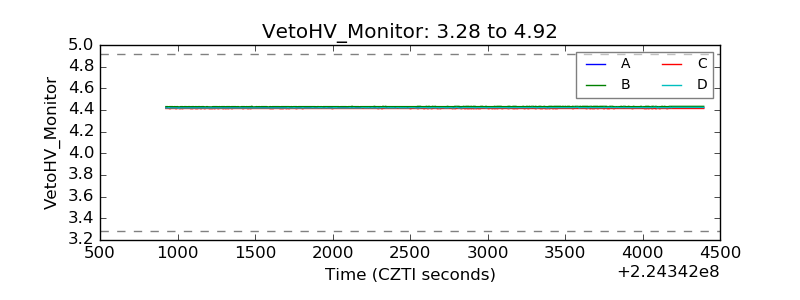 |
| Veto LLD | 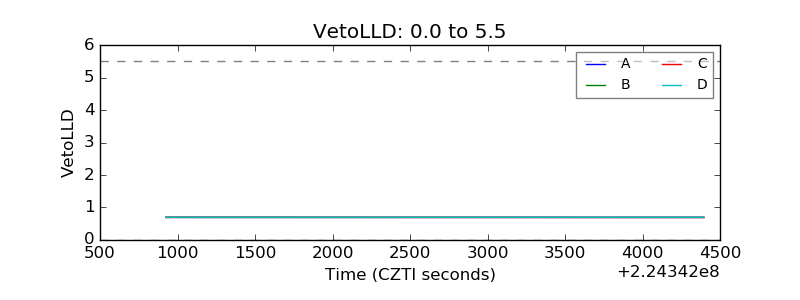 |
| Alpha Counter | 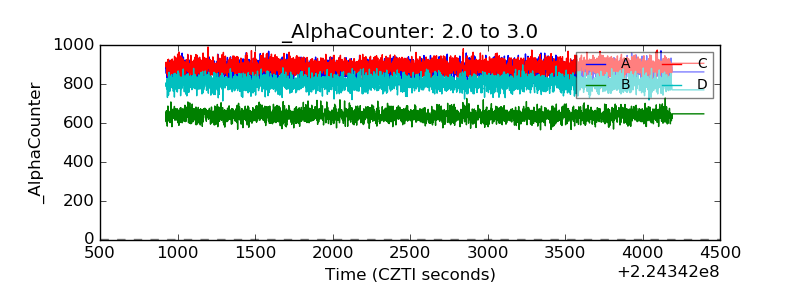 |
| _CPM_Rate | 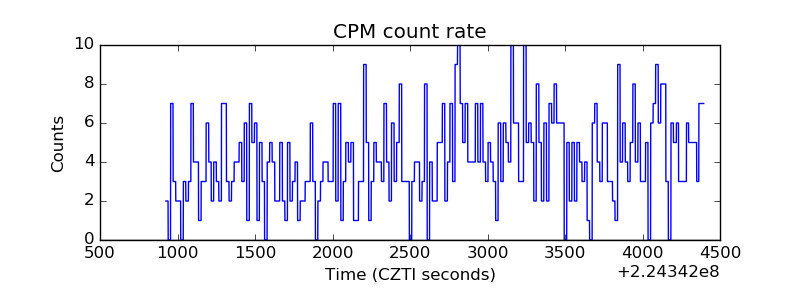 |
| CZT Counter | 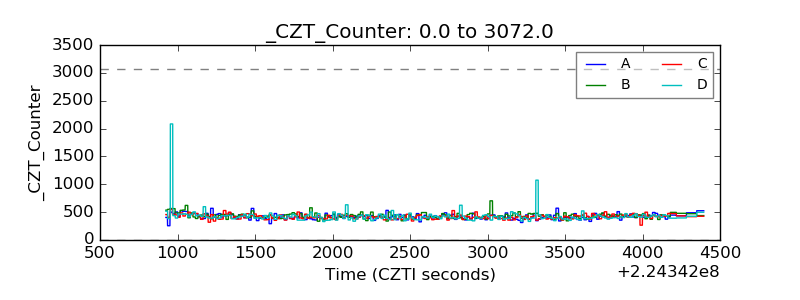 |
| +2.5 Volts monitor |  |
| +5 Volts monitor |  |
| _ROLL_ROT | 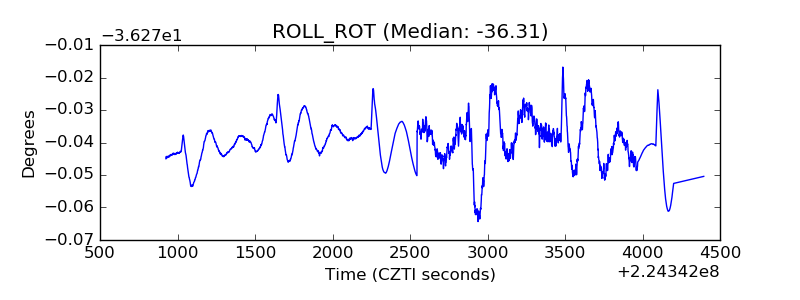 |
| _Roll_DEC | 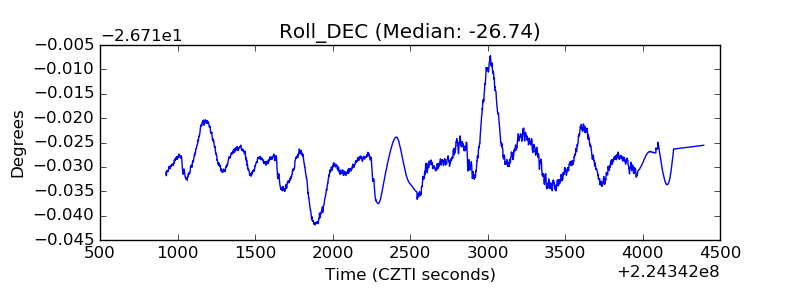 |
| _Roll_RA | 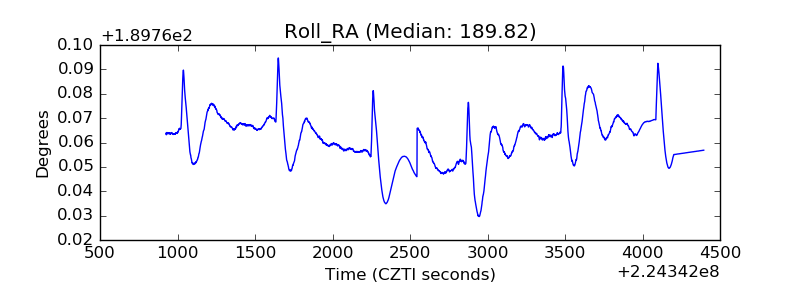 |
| Veto Counter | 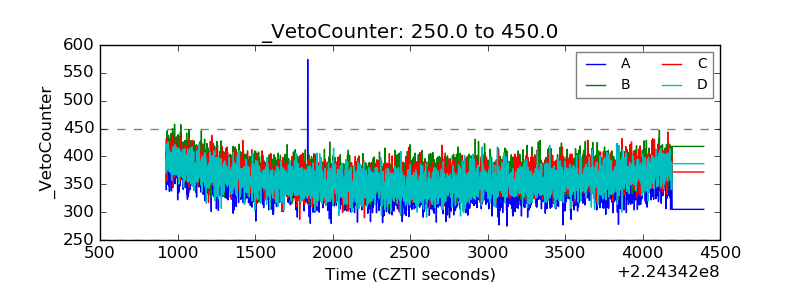 |