| Param | Original file | Final file |
|---|---|---|
| Filename | modeM0/AS1A02_150T03_9000001018_07409cztM0_level2.evt | modeM0/AS1A02_150T03_9000001018_07409cztM0_level2_quad_clean.evt |
| Size (bytes) | 415,725,120 | 81,696,960 |
| Size | 396.5 MB | 77.9 MB |
| Events in quadrant A | 2,936,629 | 517,961 |
| Events in quadrant B | 3,133,715 | 526,632 |
| Events in quadrant C | 2,857,580 | 512,959 |
| Events in quadrant D | 3,248,267 | 491,349 |
| Mode M0 | |||
|---|---|---|---|
| Quadrant | BADHDUFLAG | Total packets | Discarded packets |
| A | 0 | 12715 | 2 |
| B | 0 | 13301 | 1 |
| C | 0 | 12570 | 1 |
| D | 0 | 13862 | 1 |
| Mode SS | |||
|---|---|---|---|
| Quadrant | BADHDUFLAG | Total packets | Discarded packets |
| A | 0 | 122 | 0 |
| B | 0 | 122 | 0 |
| C | 0 | 122 | 0 |
| D | 0 | 122 | 0 |
| Mode M9 | |||
|---|---|---|---|
| Quadrant | BADHDUFLAG | Total packets | Discarded packets |
| A | 0 | 13 | 0 |
| B | 0 | 13 | 0 |
| C | 0 | 13 | 0 |
| D | 0 | 13 | 0 |
| Quadrant | Total seconds | Saturated seconds | Saturation percentage |
|---|---|---|---|
| A | 6093 | 64 | 1.050386% |
| B | 6093 | 95 | 1.559166% |
| C | 6093 | 43 | 0.705728% |
| D | 6093 | 161 | 2.642376% |
Noise dominated data is calculated using 1-second bins in cleaned event files. If a bin has >2000 counts, and if more than 50% of those come from <1% of pixels, then it is considered to be noise-dominated and hence unusable.
| Quadrant | # 1 sec bins | Bins with >0 counts | Bins with >2000 counts | High rate bins dominated by noise | Noise dominated (total time) | Noise dominated (detector-on time) | Marked lightcurve |
|---|---|---|---|---|---|---|---|
| A | 7343 | 6094 | 0 | 0 | 0.00% | 0.00% | 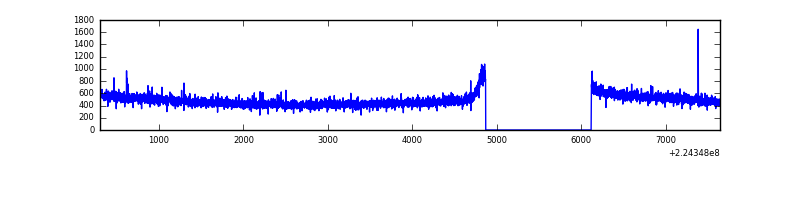 |
| B | 7343 | 6094 | 2 | 2 | 0.03% | 0.03% | 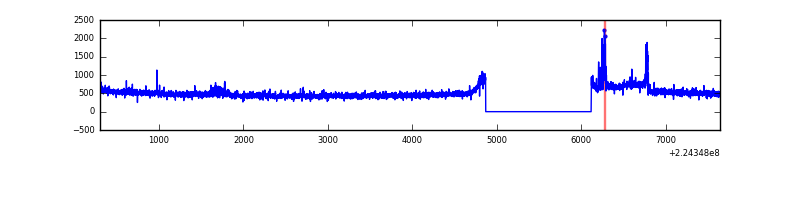 |
| C | 7343 | 6094 | 0 | 0 | 0.00% | 0.00% | 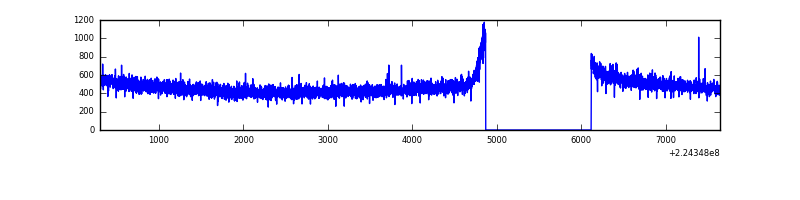 |
| D | 7343 | 6094 | 85 | 85 | 1.16% | 1.39% | 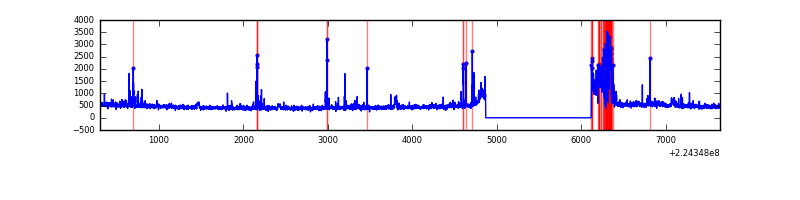 |
Top three noisy pixels from each quadrant. If the there are fewer than three noisy pixels in the level2.evt file, extra rows are filled as -1
| Pixel properties | Quadrant properties | ||||||
|---|---|---|---|---|---|---|---|
| Quadrant | DetID | PixID | Counts | Sigma | Mean | Median | Sigma |
| A | 3 | 1 | 13088 | 80.73 | 757 | 743 | 152.9 |
| A | 0 | 226 | 7557 | 44.56 | 757 | 743 | 152.9 |
| A | 12 | 194 | 6770 | 39.41 | 757 | 743 | 152.9 |
| B | 11 | 51 | 124981 | 858.64 | 764 | 748 | 144.7 |
| B | 0 | 214 | 21341 | 142.33 | 764 | 748 | 144.7 |
| B | 4 | 81 | 19251 | 127.88 | 764 | 748 | 144.7 |
| C | 13 | 61 | 5793 | 29.88 | 731 | 735 | 169.3 |
| C | 1 | 16 | 4920 | 24.72 | 731 | 735 | 169.3 |
| C | 12 | 4 | 2182 | 8.55 | 731 | 735 | 169.3 |
| D | 10 | 15 | 166195 | 939.44 | 721 | 698 | 176.2 |
| D | 13 | 105 | 143988 | 813.38 | 721 | 698 | 176.2 |
| D | 14 | 34 | 58434 | 327.74 | 721 | 698 | 176.2 |
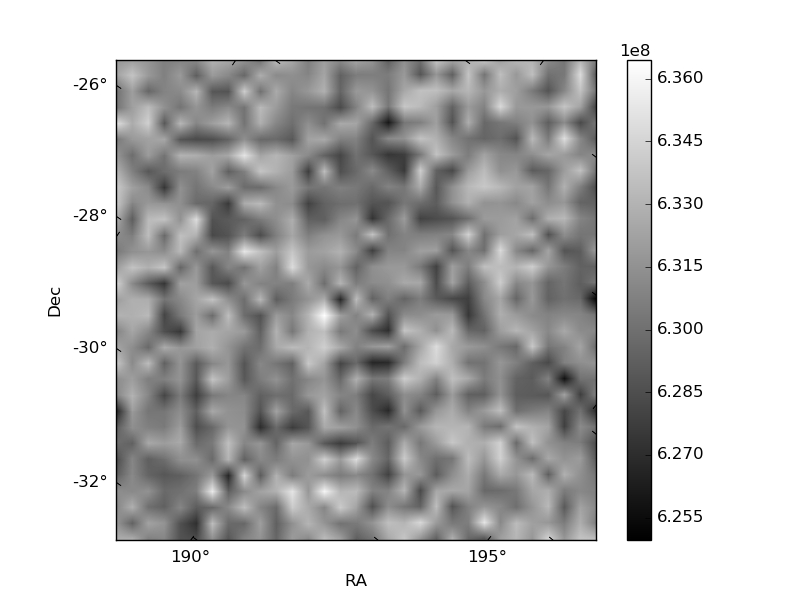
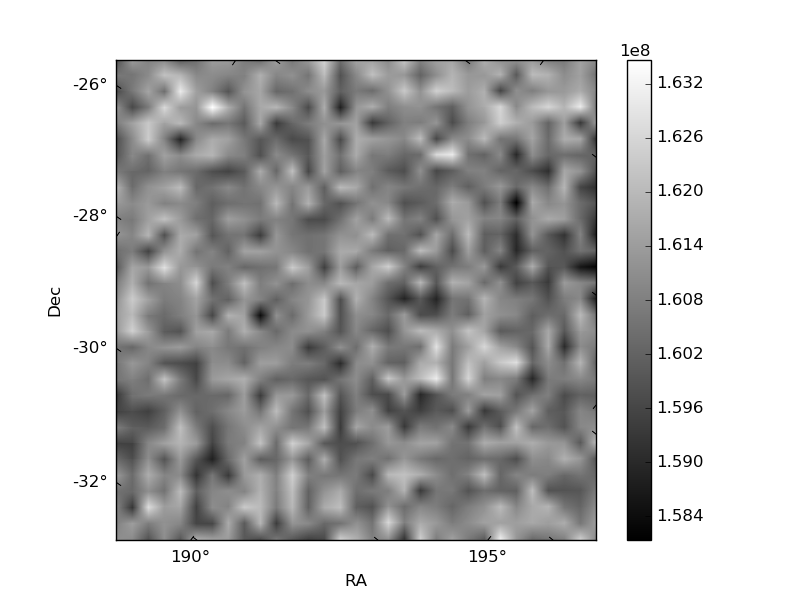
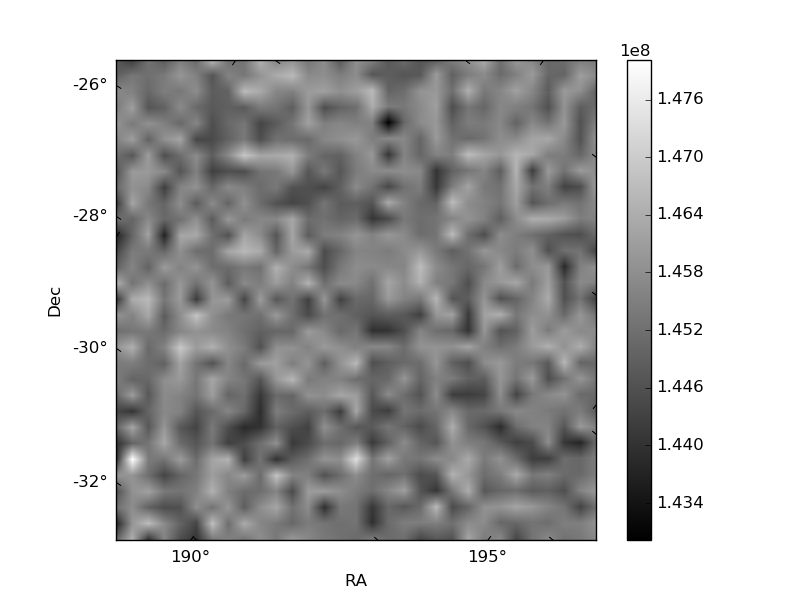
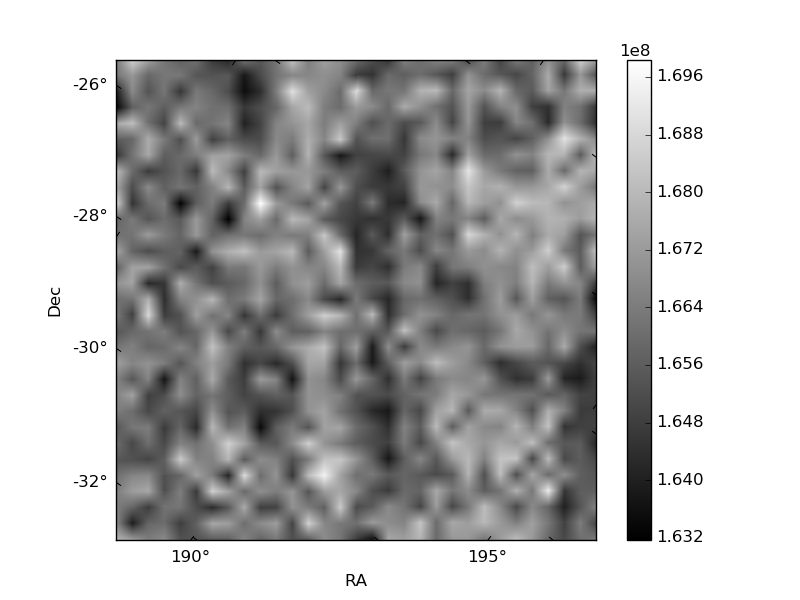
Histogram calculated using DETX and DETY for each event in the final _common_clean file
| Quadrant A | 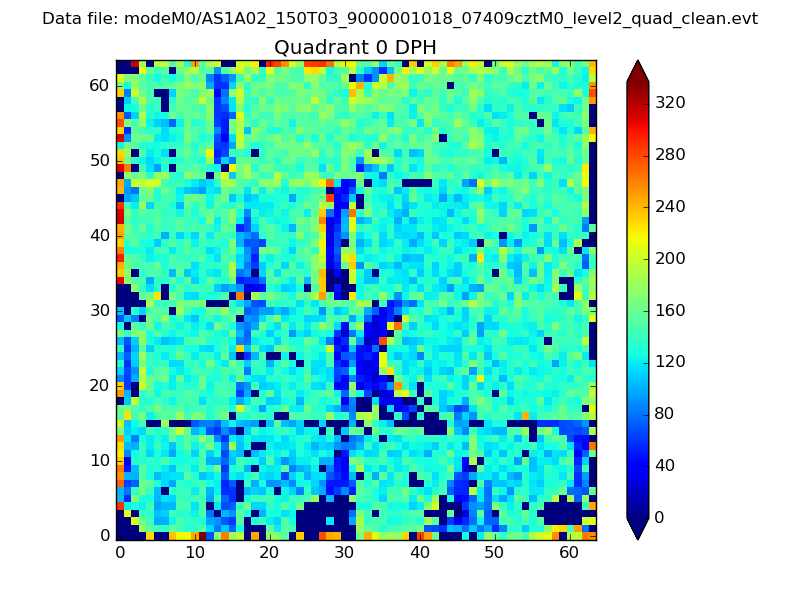 |
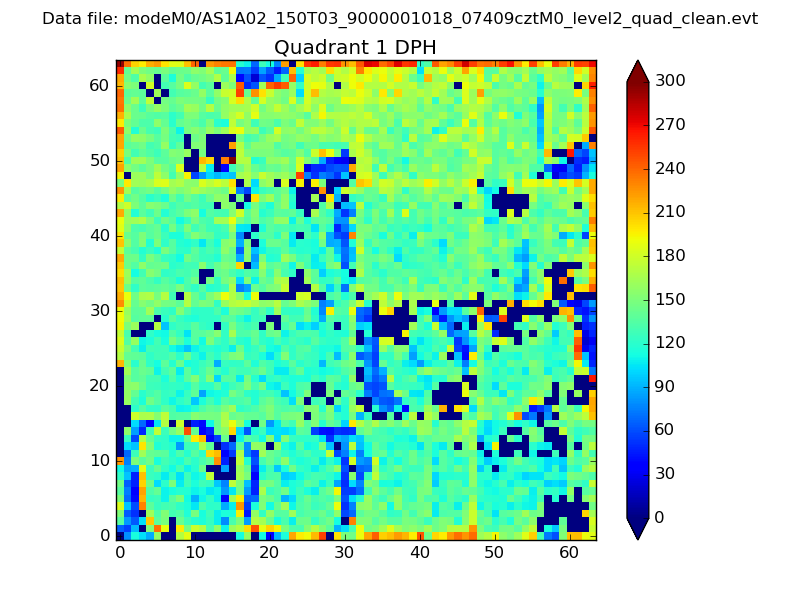 |
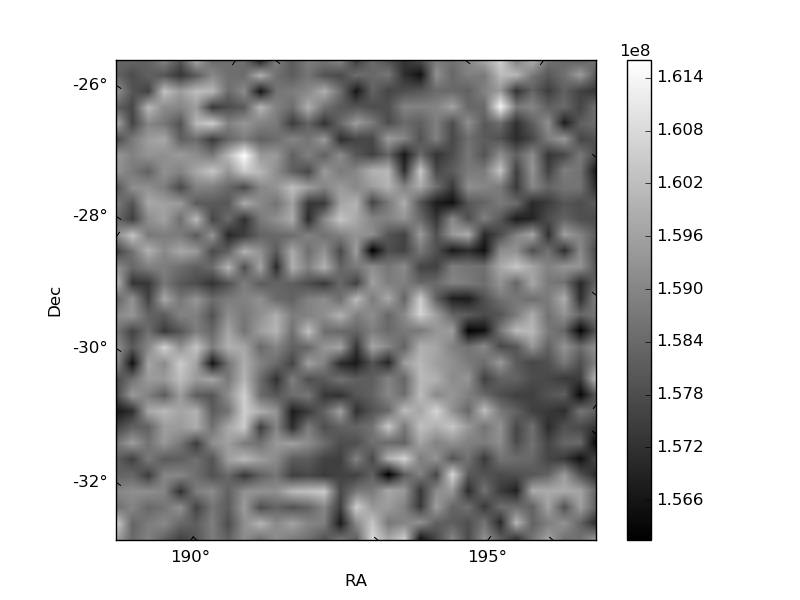
Quadrant B |
|---|---|---|---|
| Quadrant D | 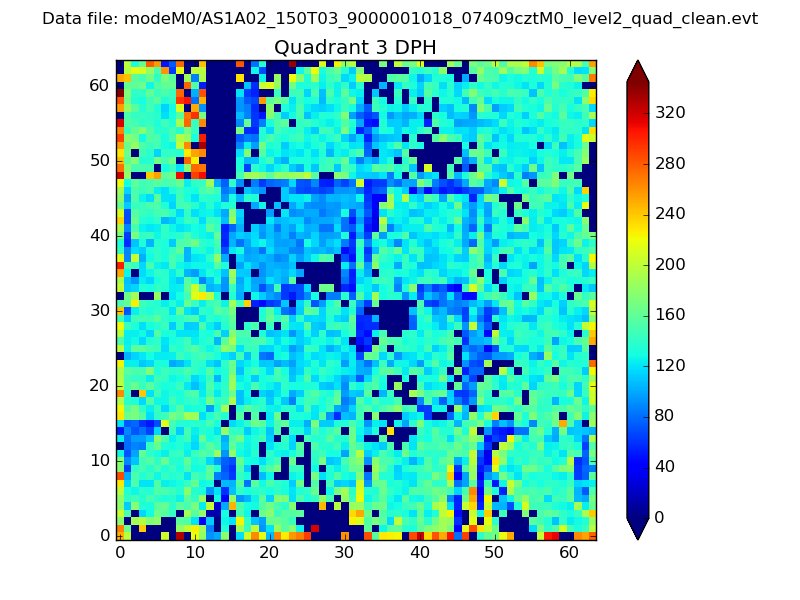 |
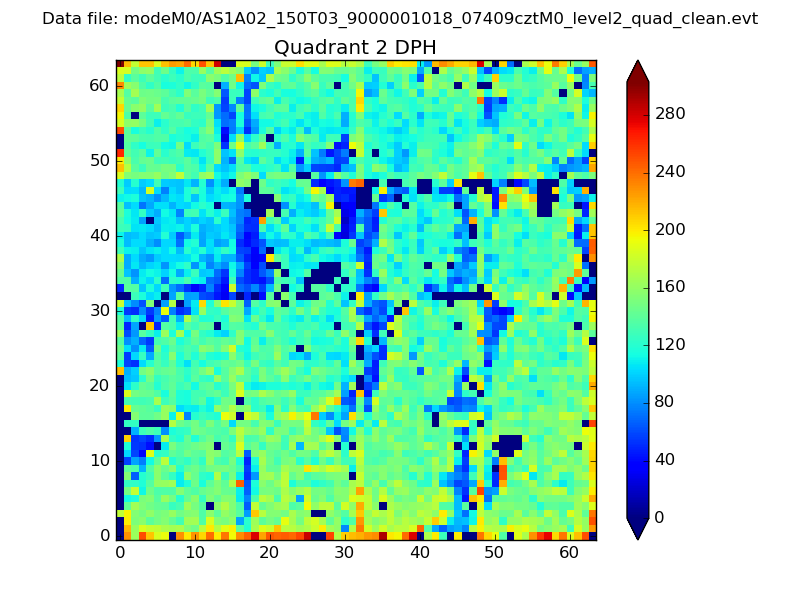 |
Quadrant C |
| Plot type | Count rate plots | Images |
|---|---|---|
| Comparison with Poisson distribution Blue bars denote a histogram of data divided into 1 sec bins. Red curve is a Poisson curve with rate = median count rate of data. |
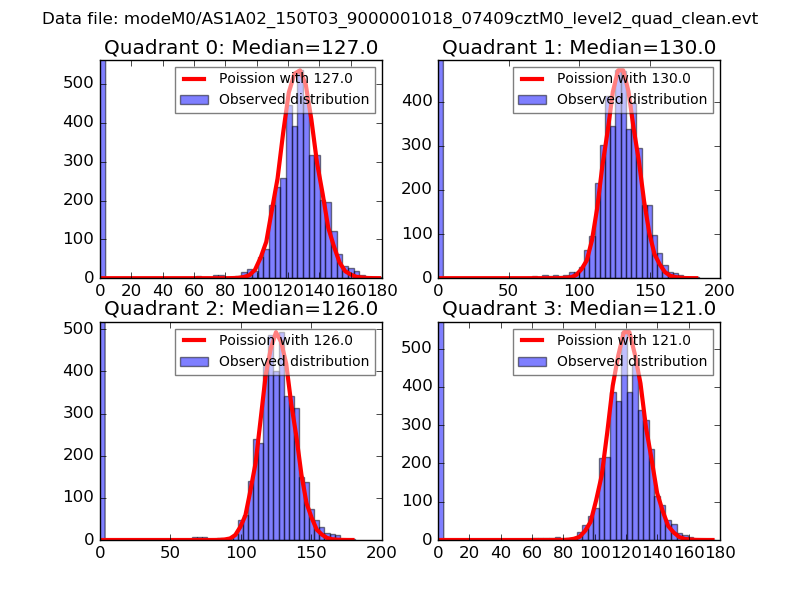 |
 |
| Quadrant-wise count rates Data is divided into 100 sec bins |
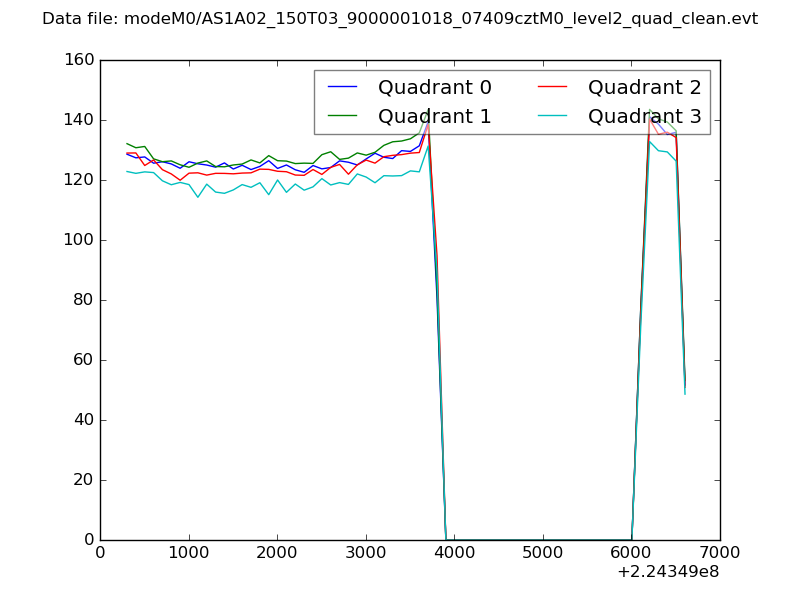 |
|
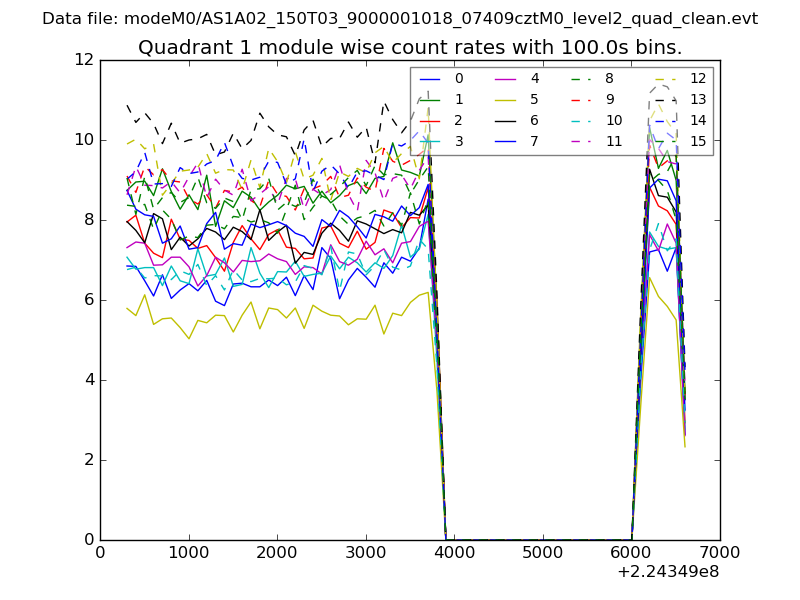
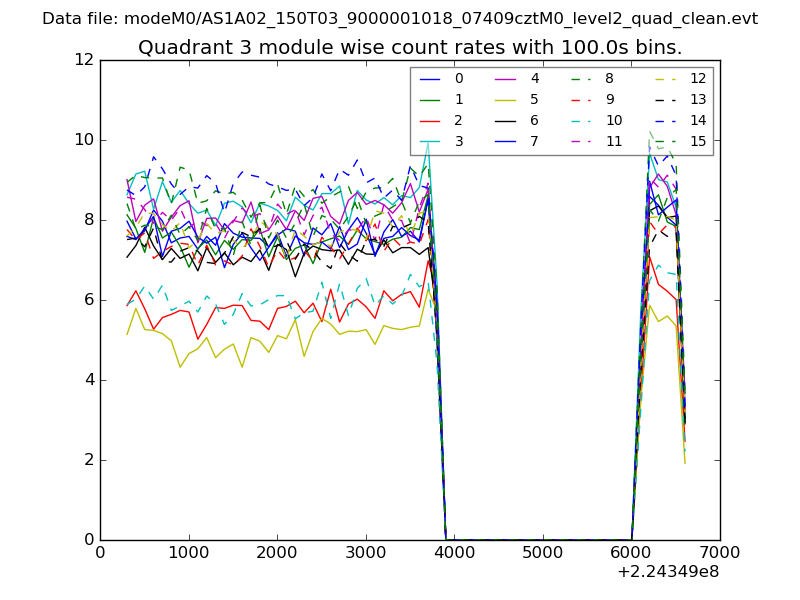
| Module-wise count rates for Quadrant A Data is divided into 100 sec bins |
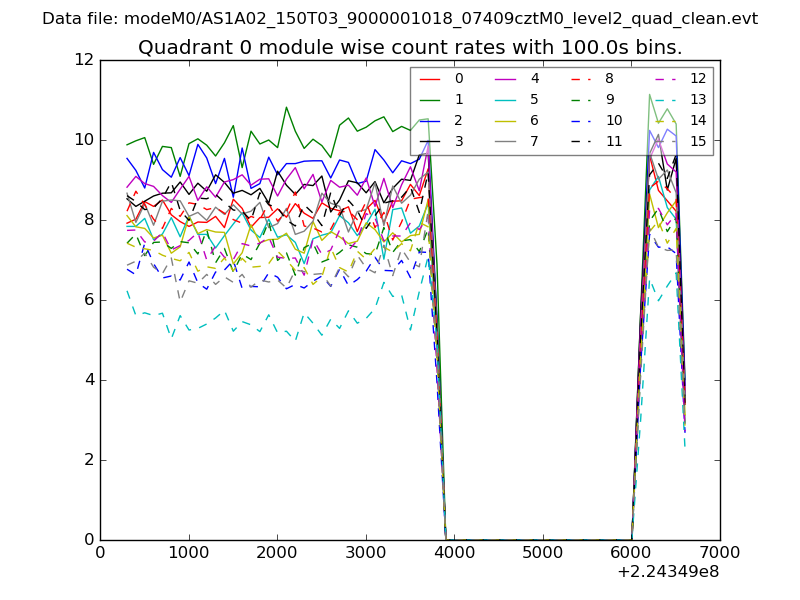 |
 |
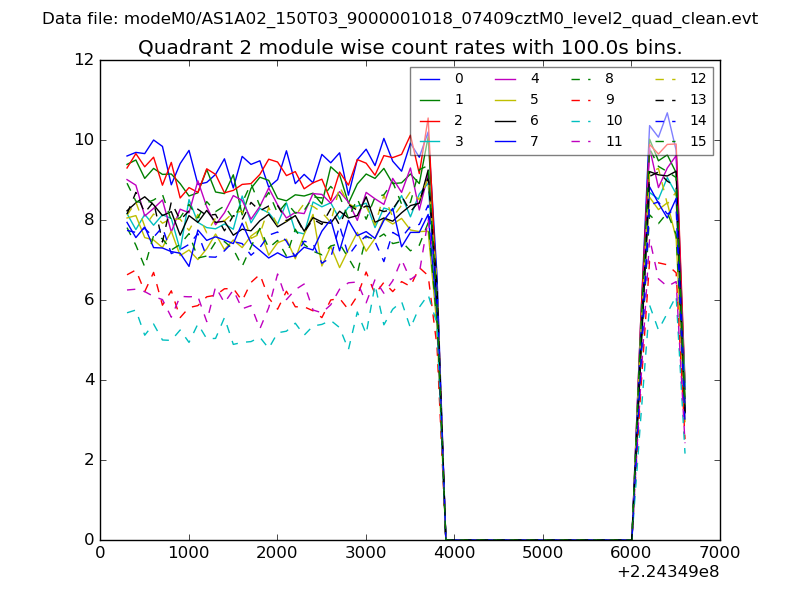
| Module-wise count rates for Quadrant B Data is divided into 100 sec bins |
 |
 |
| Module-wise count rates for Quadrant C Data is divided into 100 sec bins |
 |
 |
| Module-wise count rates for Quadrant D Data is divided into 100 sec bins |
 |
 |
| Parameter | Plot |
|---|---|
| CZT HV Monitor | 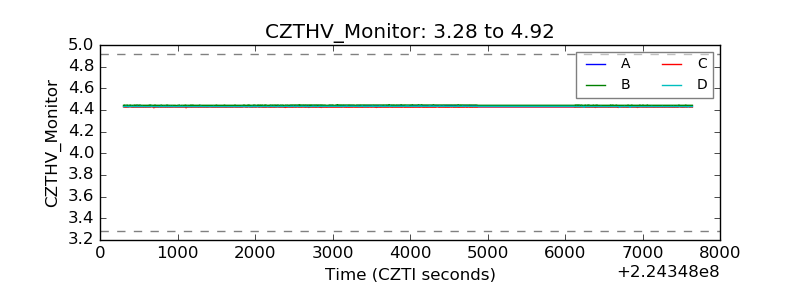 |
| D_VDD | 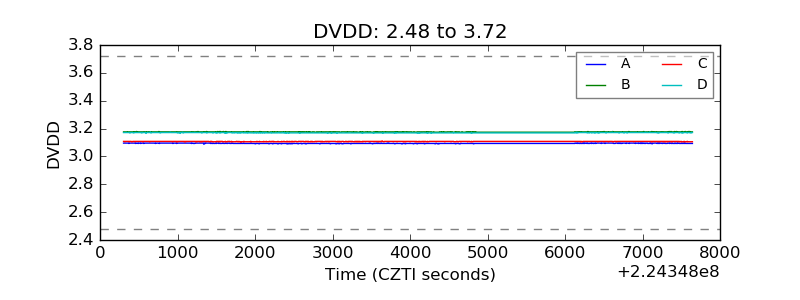 |
| Temperature 1 | 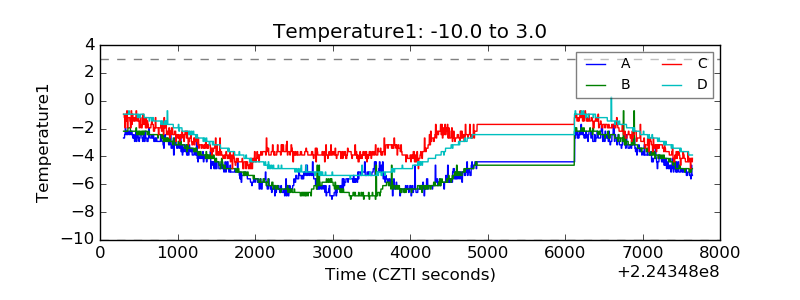 |
| Veto HV Monitor | 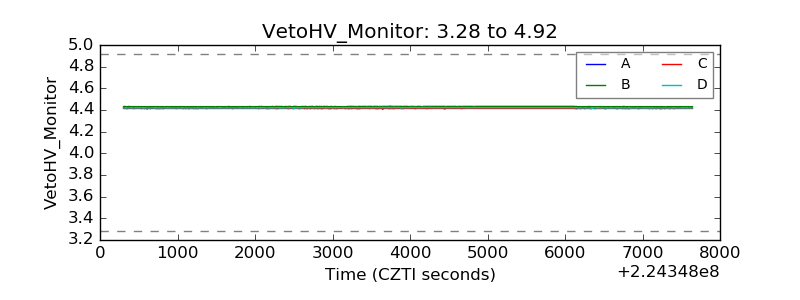 |
| Veto LLD | 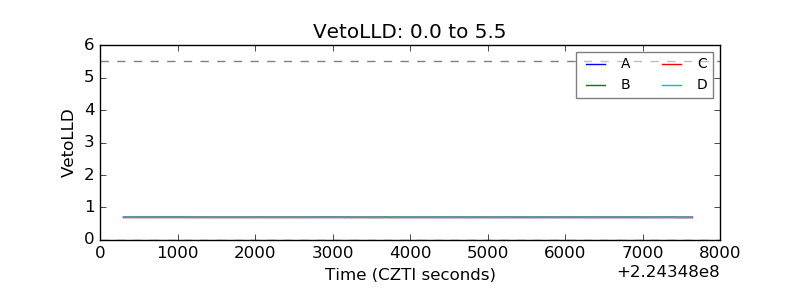 |
| Alpha Counter | 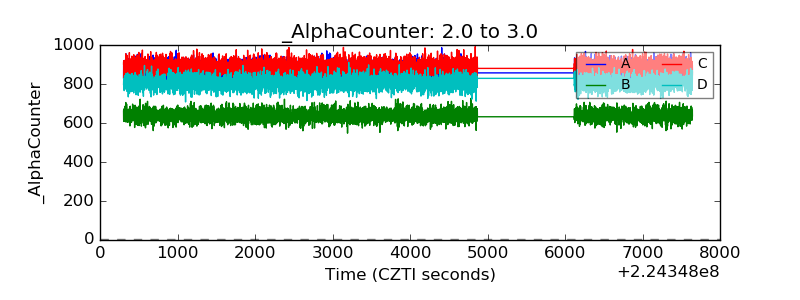 |
| _CPM_Rate | 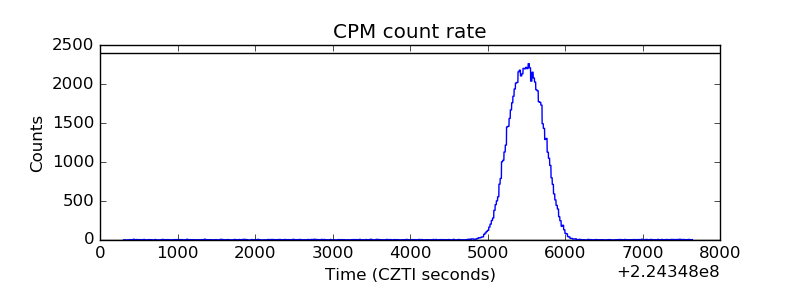 |
| CZT Counter | 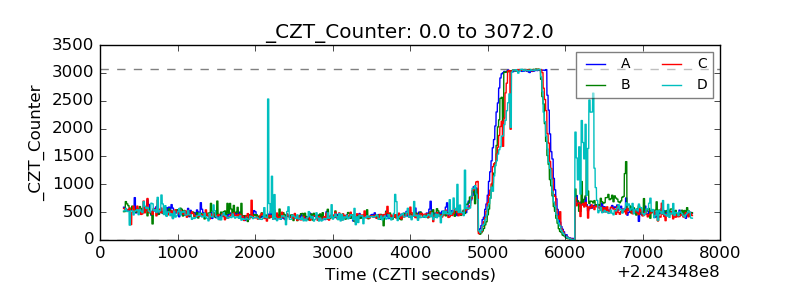 |
| +2.5 Volts monitor |  |
| +5 Volts monitor |  |
| _ROLL_ROT | 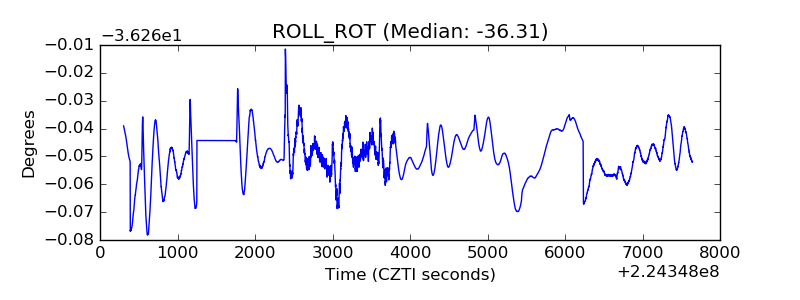 |
| _Roll_DEC | 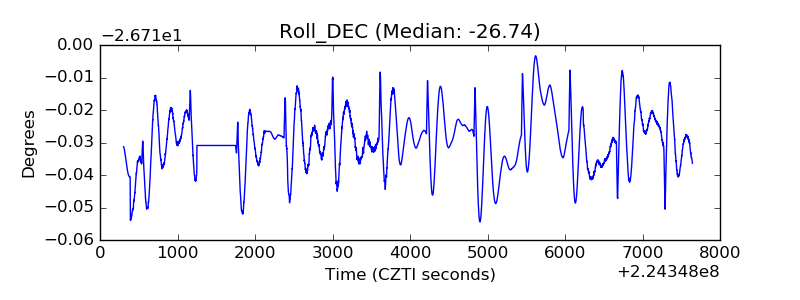 |
| _Roll_RA | 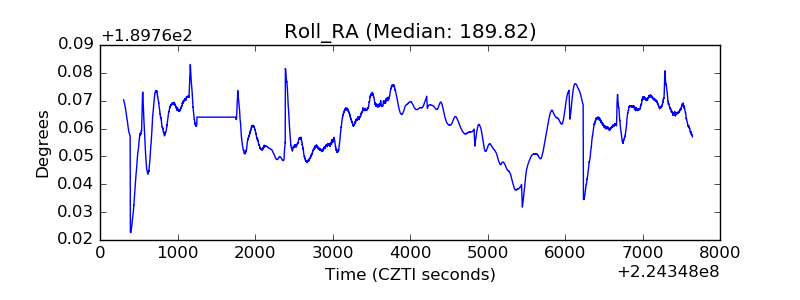 |
| Veto Counter | 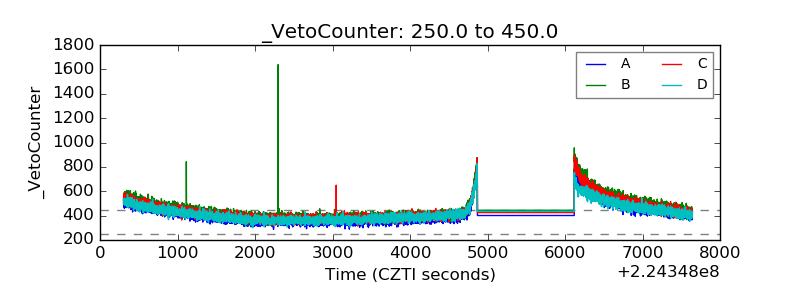 |