| Param | Original file | Final file |
|---|---|---|
| Filename | modeM0/AS1A02_150T03_9000001018_07414cztM0_level2.evt | modeM0/AS1A02_150T03_9000001018_07414cztM0_level2_quad_clean.evt |
| Size (bytes) | 65,494,080 | 13,875,840 |
| Size | 62.5 MB | 13.2 MB |
| Events in quadrant A | 442,271 | 88,967 |
| Events in quadrant B | 473,360 | 90,362 |
| Events in quadrant C | 432,971 | 89,637 |
| Events in quadrant D | 573,995 | 84,030 |
| Mode M0 | |||
|---|---|---|---|
| Quadrant | BADHDUFLAG | Total packets | Discarded packets |
| A | 0 | 1921 | 22 |
| B | 0 | 1985 | 24 |
| C | 0 | 1904 | 28 |
| D | 0 | 2338 | 38 |
| Mode SS | |||
|---|---|---|---|
| Quadrant | BADHDUFLAG | Total packets | Discarded packets |
| A | 0 | 20 | 0 |
| B | 0 | 20 | 0 |
| C | 0 | 20 | 0 |
| D | 0 | 20 | 0 |
| Mode M9 | |||
|---|---|---|---|
| Quadrant | BADHDUFLAG | Total packets | Discarded packets |
| A | 0 | 8 | 1 |
| B | 0 | 8 | 1 |
| C | 0 | 8 | 1 |
| D | 0 | 8 | 1 |
| Quadrant | Total seconds | Saturated seconds | Saturation percentage |
|---|---|---|---|
| A | 846 | 15 | 1.773050% |
| B | 845 | 24 | 2.840237% |
| C | 841 | 12 | 1.426873% |
| D | 843 | 36 | 4.270463% |
Noise dominated data is calculated using 1-second bins in cleaned event files. If a bin has >2000 counts, and if more than 50% of those come from <1% of pixels, then it is considered to be noise-dominated and hence unusable.
| Quadrant | # 1 sec bins | Bins with >0 counts | Bins with >2000 counts | High rate bins dominated by noise | Noise dominated (total time) | Noise dominated (detector-on time) | Marked lightcurve |
|---|---|---|---|---|---|---|---|
| A | 1728 | 853 | 0 | 0 | 0.00% | 0.00% | 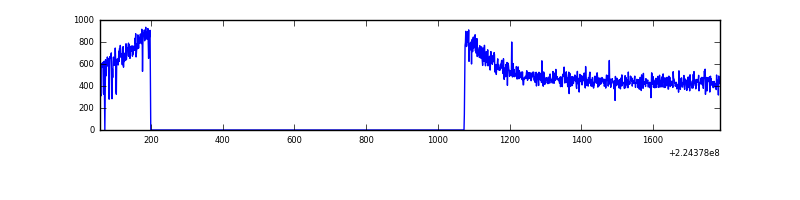 |
| B | 1728 | 853 | 0 | 0 | 0.00% | 0.00% |  |
| C | 1726 | 849 | 0 | 0 | 0.00% | 0.00% | 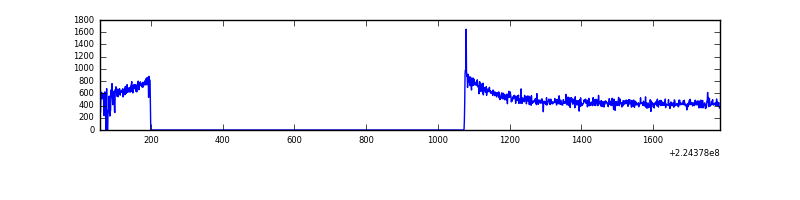 |
| D | 1728 | 849 | 16 | 16 | 0.93% | 1.88% | 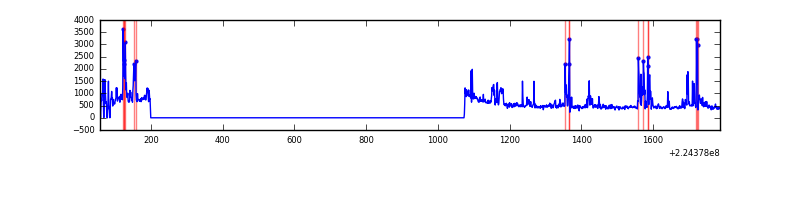 |
Top three noisy pixels from each quadrant. If the there are fewer than three noisy pixels in the level2.evt file, extra rows are filled as -1
| Pixel properties | Quadrant properties | ||||||
|---|---|---|---|---|---|---|---|
| Quadrant | DetID | PixID | Counts | Sigma | Mean | Median | Sigma |
| A | 0 | 226 | 1130 | 39.12 | 114 | 111 | 26.0 |
| A | 12 | 194 | 948 | 32.13 | 114 | 111 | 26.0 |
| A | 13 | 14 | 490 | 14.55 | 114 | 111 | 26.0 |
| B | 0 | 214 | 8986 | 345.65 | 117 | 114 | 25.7 |
| B | 4 | 81 | 4607 | 175.05 | 117 | 114 | 25.7 |
| B | 0 | 229 | 3507 | 132.19 | 117 | 114 | 25.7 |
| C | 12 | 4 | 1249 | 39.94 | 110 | 110 | 28.5 |
| C | 1 | 16 | 923 | 28.51 | 110 | 110 | 28.5 |
| C | 13 | 61 | 841 | 25.63 | 110 | 110 | 28.5 |
| D | 13 | 105 | 41743 | 1439.89 | 107 | 103 | 28.9 |
| D | 2 | 14 | 38256 | 1319.31 | 107 | 103 | 28.9 |
| D | 2 | 216 | 30786 | 1061.0 | 107 | 103 | 28.9 |
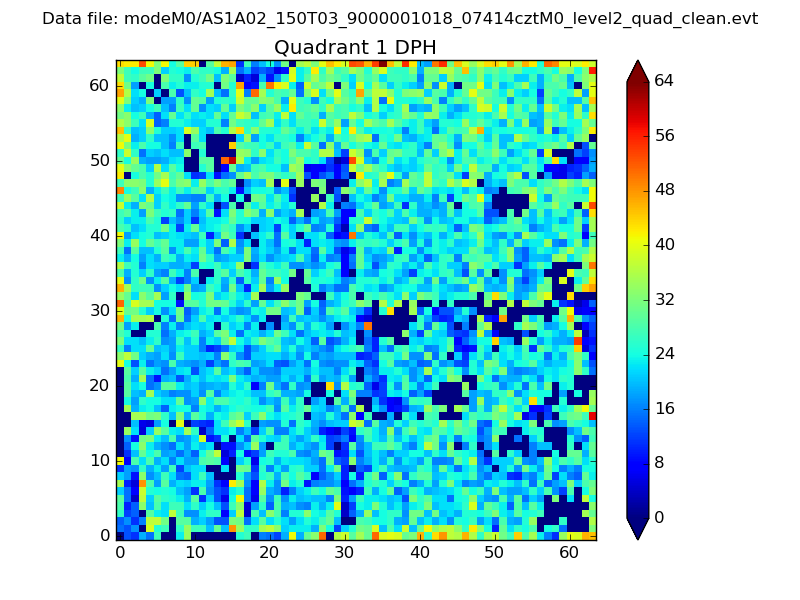
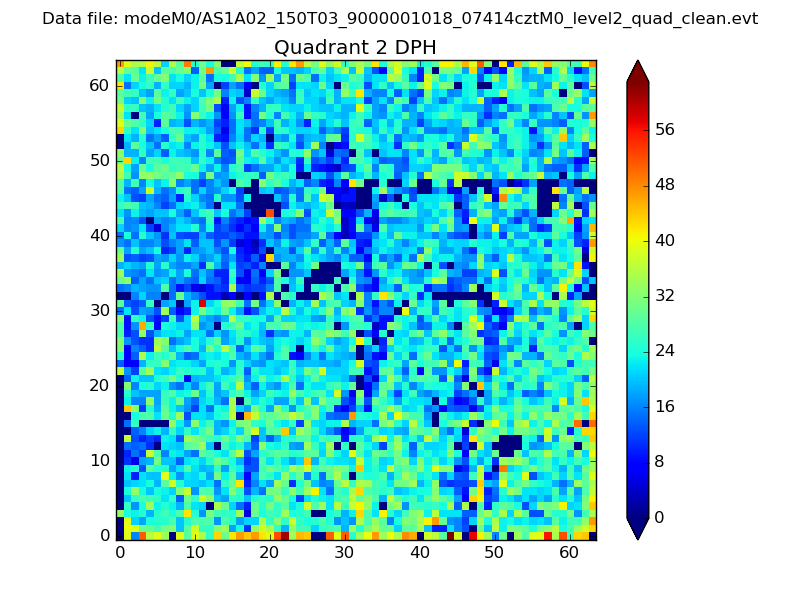
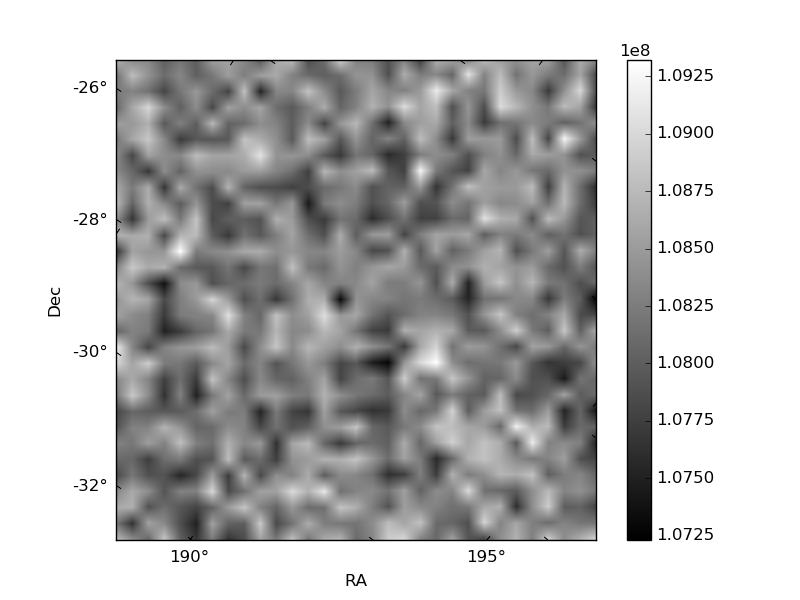
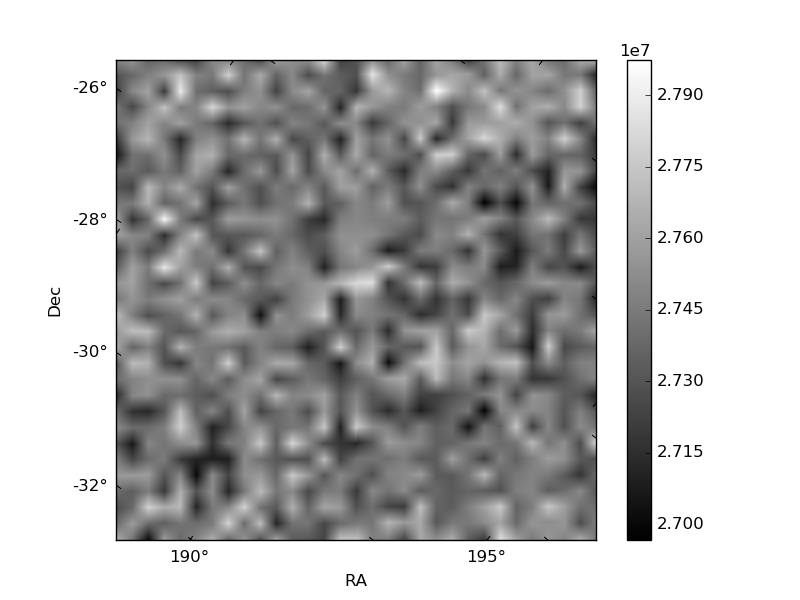
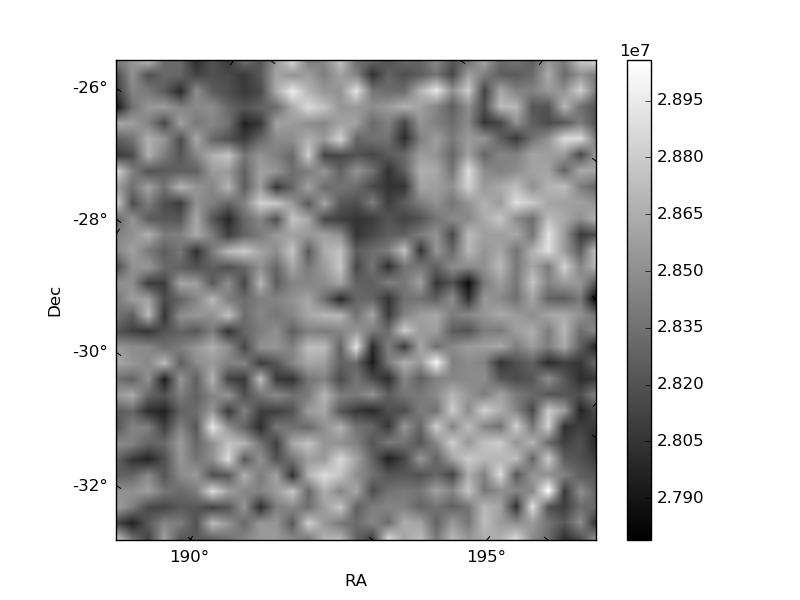
Histogram calculated using DETX and DETY for each event in the final _common_clean file
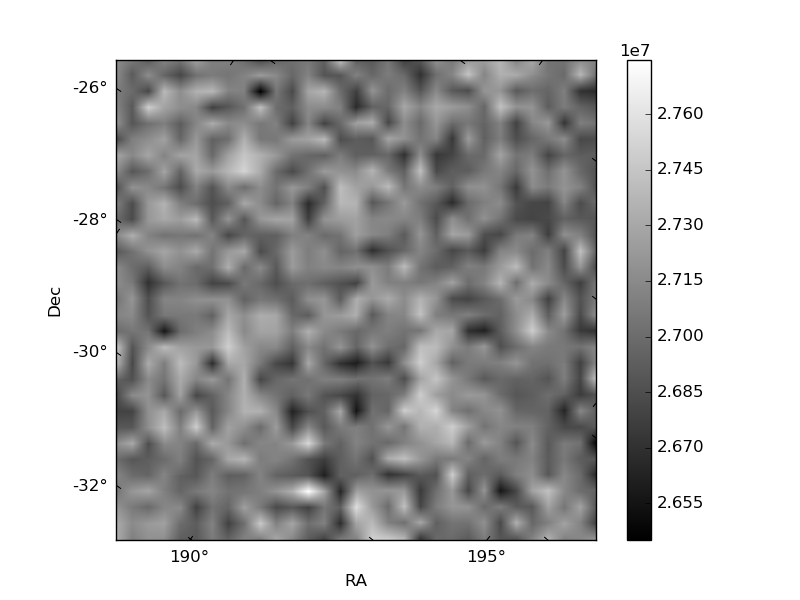
| Quadrant A | 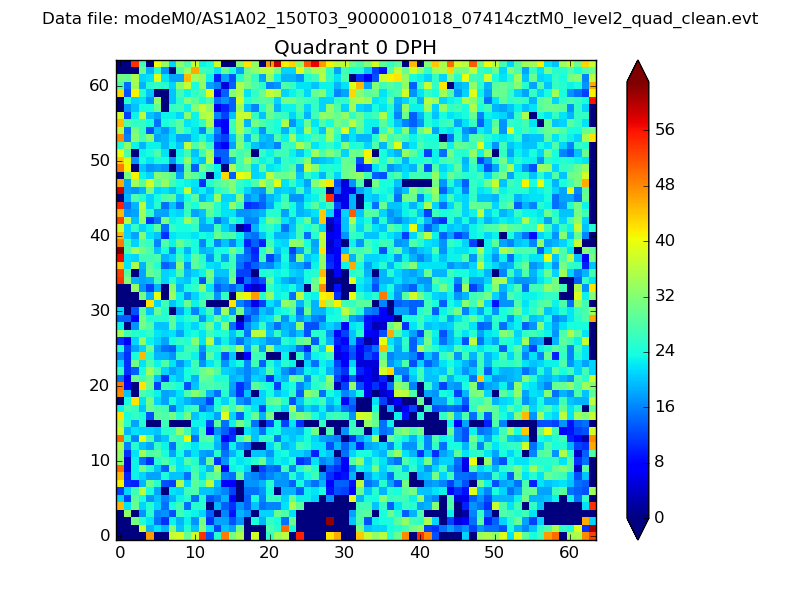 |
 |
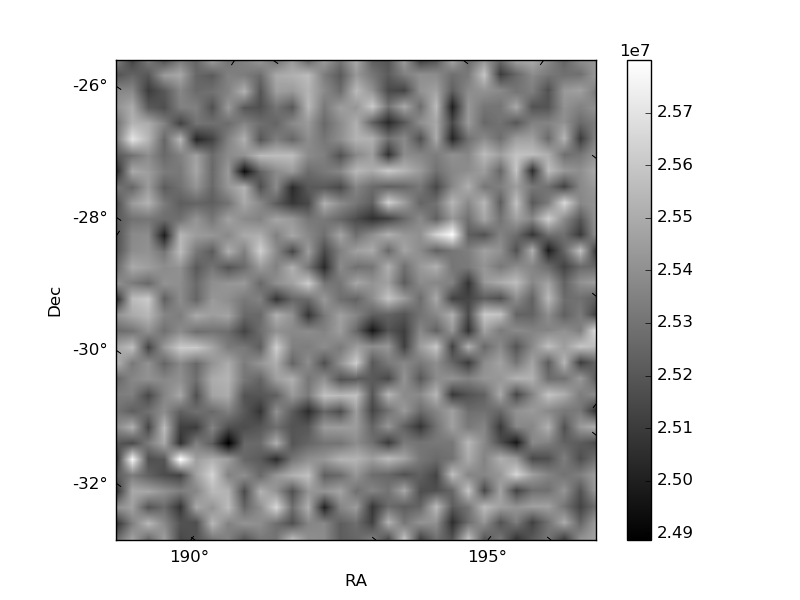
Quadrant B |
|---|---|---|---|
| Quadrant D | 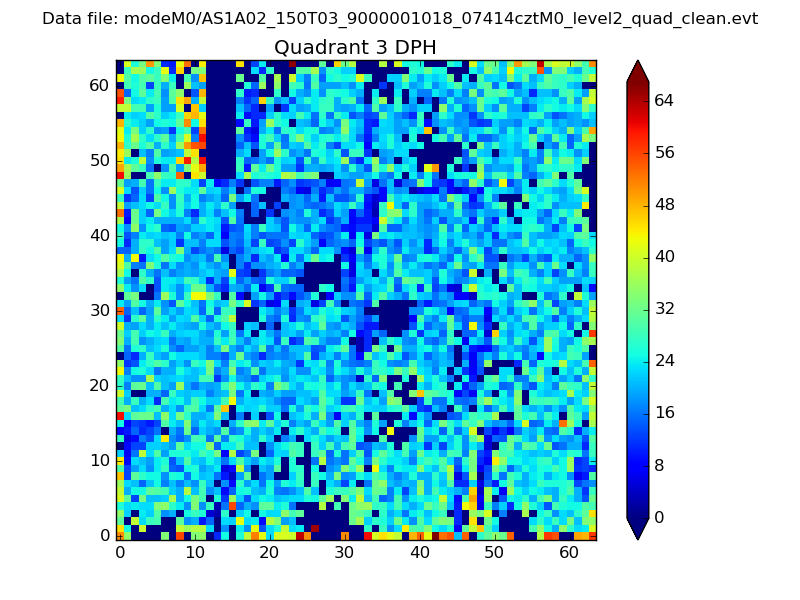 |
 |
Quadrant C |
| Plot type | Count rate plots | Images |
|---|---|---|
| Comparison with Poisson distribution Blue bars denote a histogram of data divided into 1 sec bins. Red curve is a Poisson curve with rate = median count rate of data. |
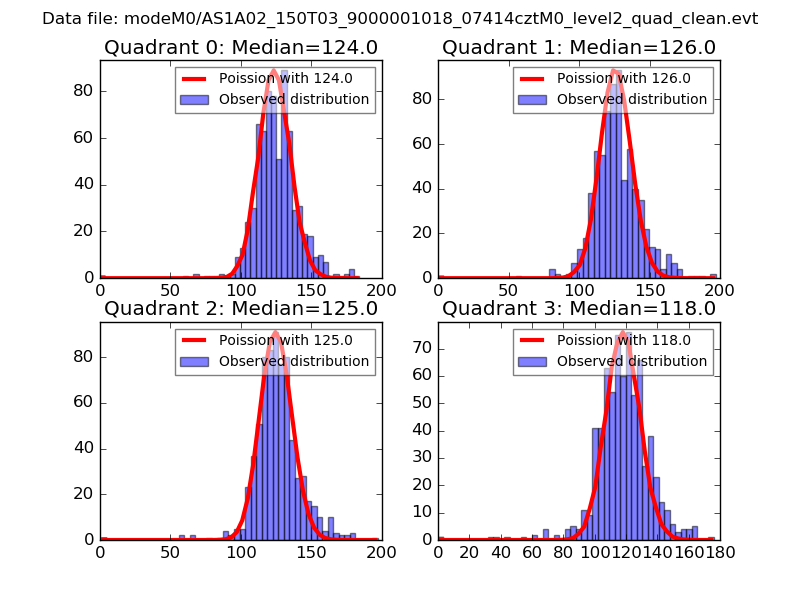 |
 |
| Quadrant-wise count rates Data is divided into 100 sec bins |
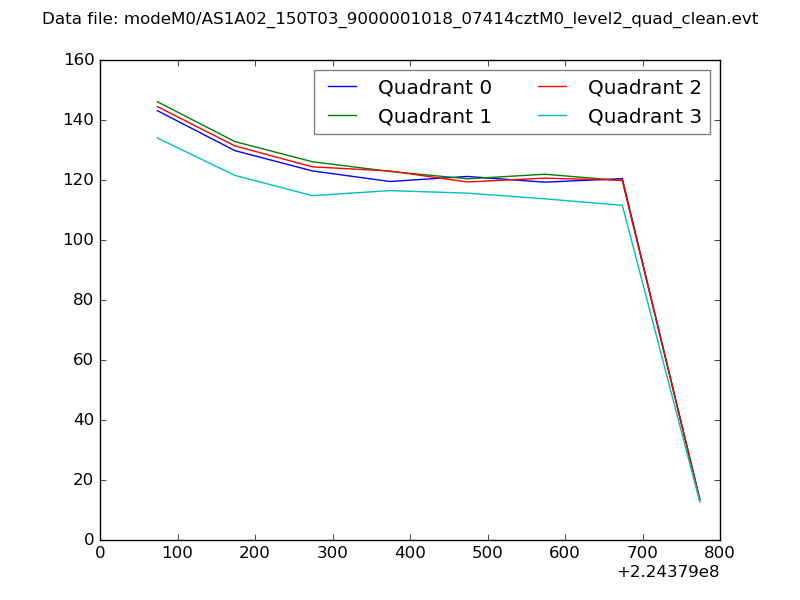 |
|
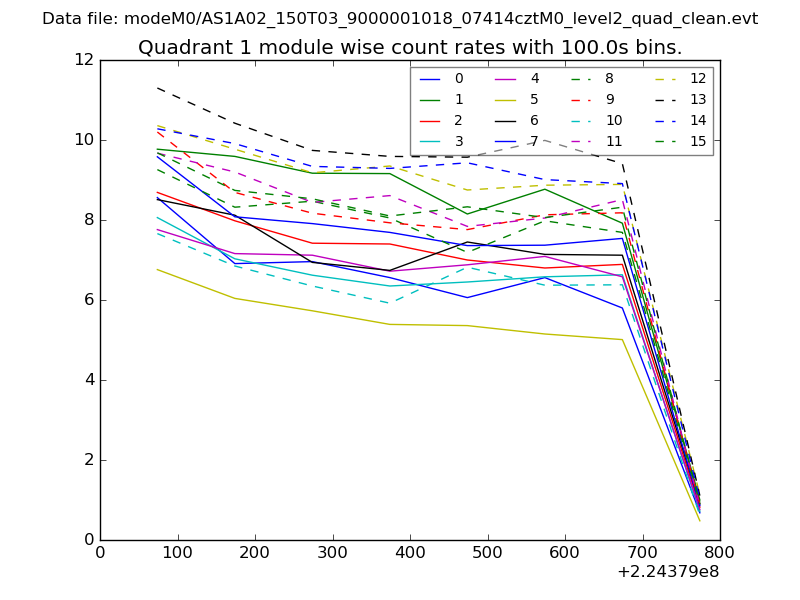
| Module-wise count rates for Quadrant A Data is divided into 100 sec bins |
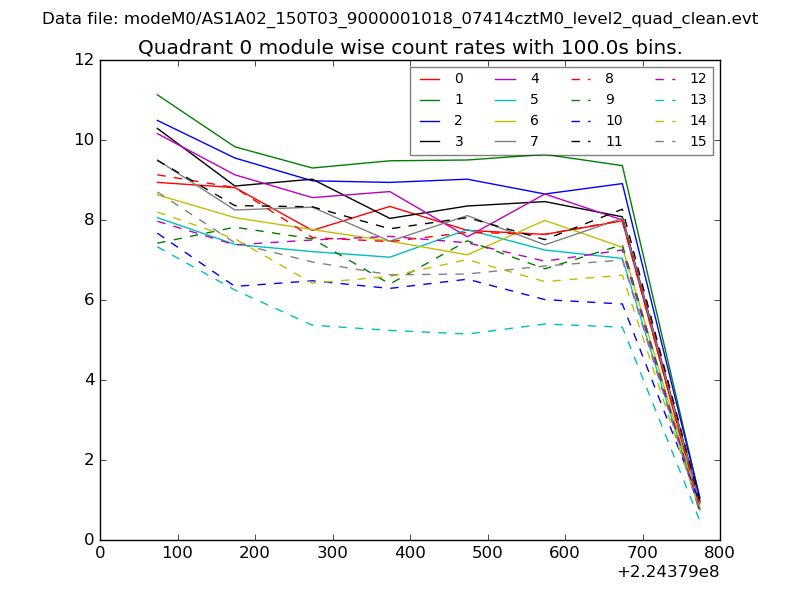 |
 |
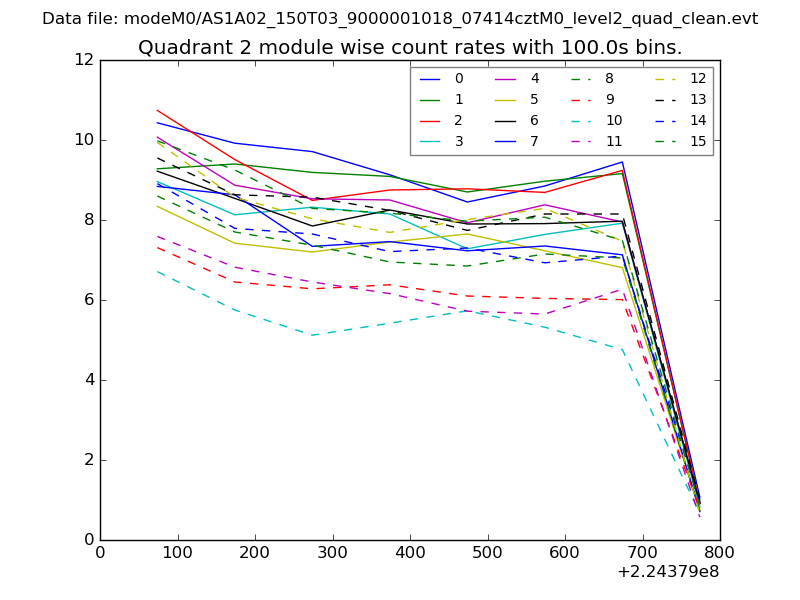
| Module-wise count rates for Quadrant B Data is divided into 100 sec bins |
 |
 |
| Module-wise count rates for Quadrant C Data is divided into 100 sec bins |
 |
 |
| Module-wise count rates for Quadrant D Data is divided into 100 sec bins |
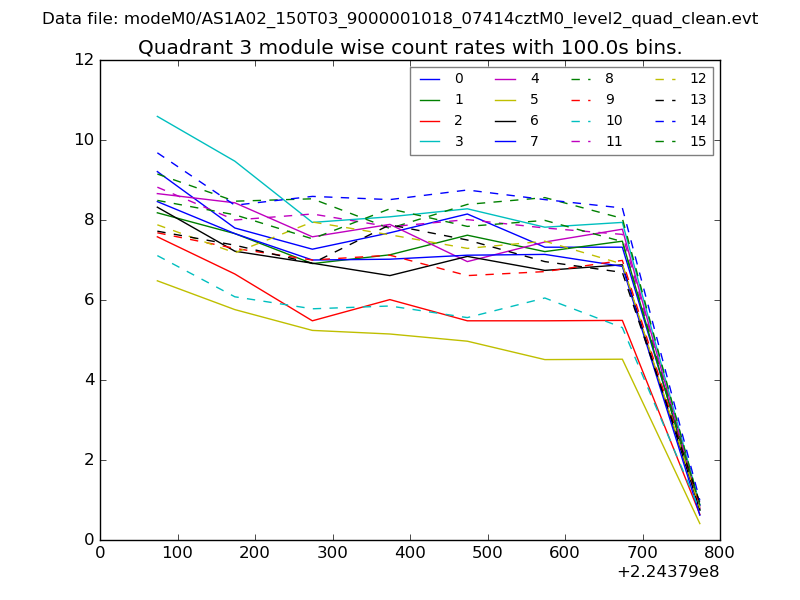 |
 |
| Parameter | Plot |
|---|---|
| CZT HV Monitor | 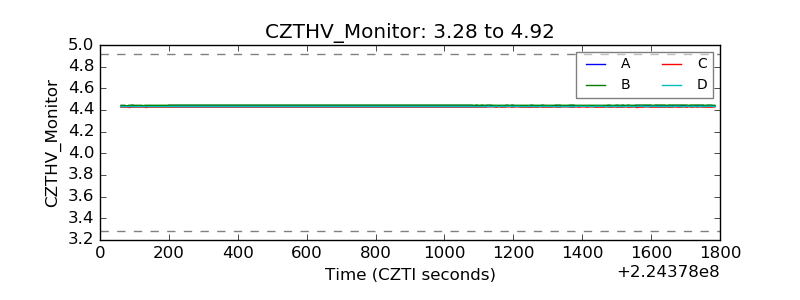 |
| D_VDD | 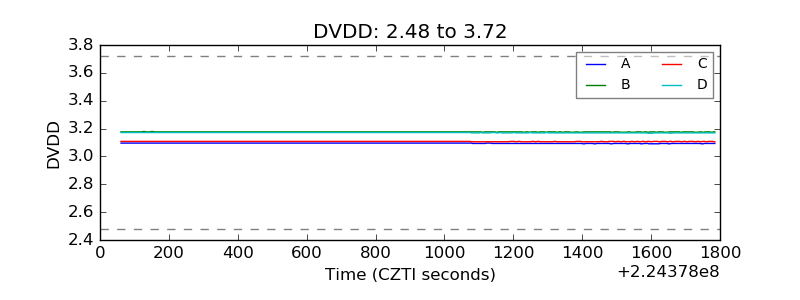 |
| Temperature 1 | 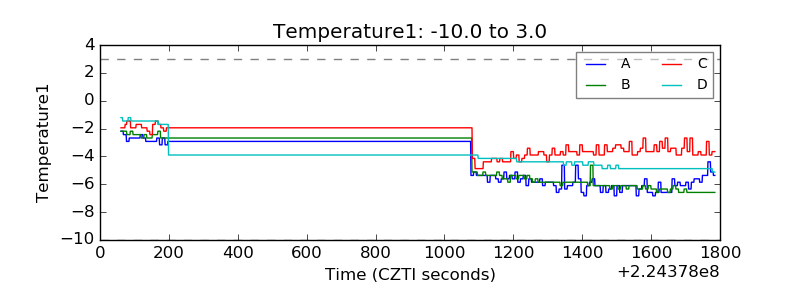 |
| Veto HV Monitor | 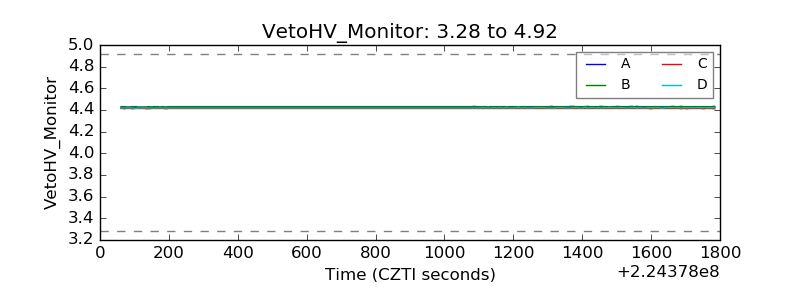 |
| Veto LLD |  |
| Alpha Counter | 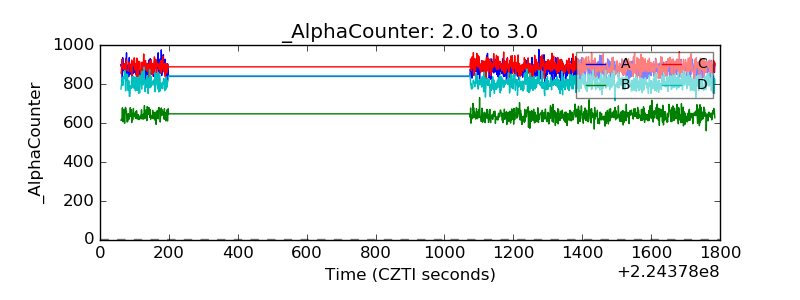 |
| _CPM_Rate | 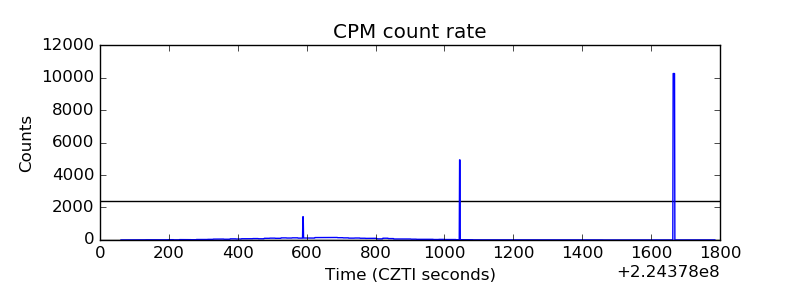 |
| CZT Counter | 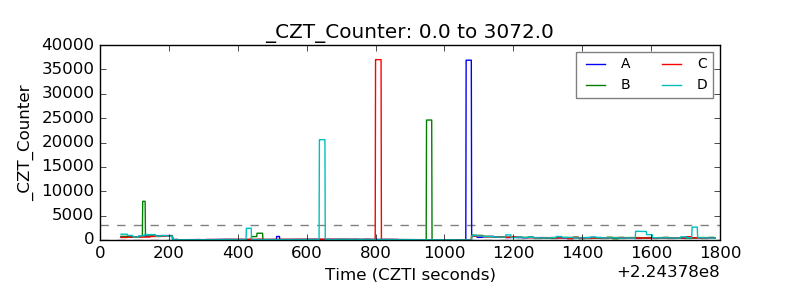 |
| +2.5 Volts monitor |  |
| +5 Volts monitor |  |
| _ROLL_ROT | 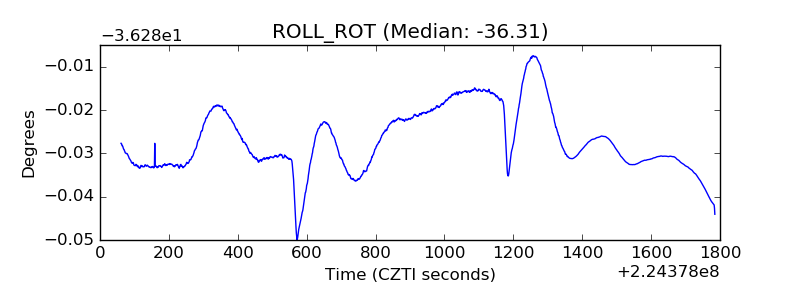 |
| _Roll_DEC | 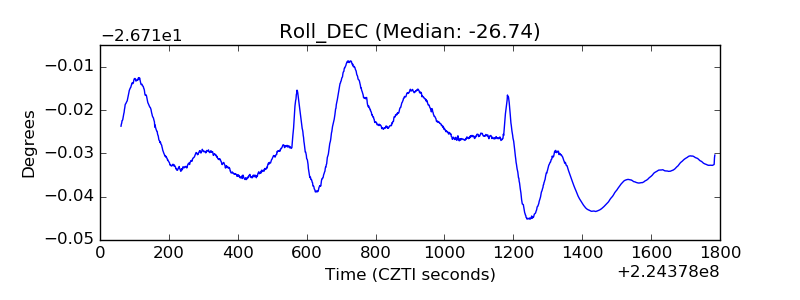 |
| _Roll_RA | 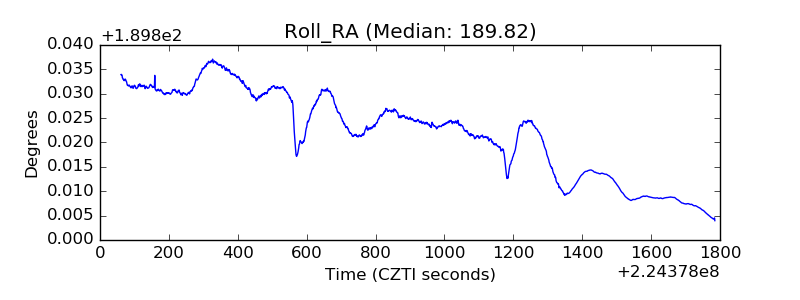 |
| Veto Counter | 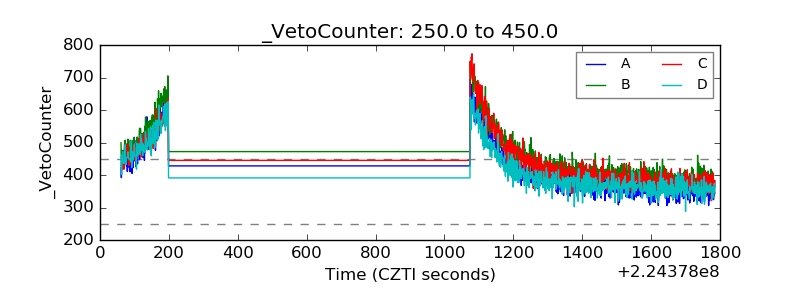 |