| Param | Original file | Final file |
|---|---|---|
| Filename | modeM0/AS1G06_087T02_9000001016cztM0_level2.fits | modeM0/AS1G06_087T02_9000001016cztM0_level2_quad_clean.evt |
| Size (bytes) | 285,871,680 | 269,061,120 |
| Size | 272.6 MB | 256.6 MB |
| Events in quadrant A | 1,696,532 | 1,547,864 |
| Events in quadrant B | 1,652,886 | 1,563,922 |
| Events in quadrant C | 1,691,694 | 1,511,912 |
| Events in quadrant D | 1,450,130 | 1,358,383 |
| Mode SS | |||
|---|---|---|---|
| Quadrant | BADHDUFLAG | Total packets | Discarded packets |
| A | 0 | 586 | 0 |
| B | 0 | 582 | 0 |
| C | 0 | 580 | 0 |
| D | 0 | 582 | 0 |
| Mode M0 | |||
|---|---|---|---|
| Quadrant | BADHDUFLAG | Total packets | Discarded packets |
| A | 0 | 64824 | 0 |
| B | 0 | 65970 | 0 |
| C | 0 | 64948 | 0 |
| D | 0 | 73853 | 0 |
| Mode M9 | |||
|---|---|---|---|
| Quadrant | BADHDUFLAG | Total packets | Discarded packets |
| A | 0 | 23 | 0 |
| B | 0 | 25 | 0 |
| C | 0 | 24 | 0 |
| D | 0 | 24 | 0 |
| Quadrant | Total seconds | Saturated seconds | Saturation percentage |
|---|---|---|---|
| A | 31700 | 350 | 1.104101% |
| B | 31747 | 384 | 1.209563% |
| C | 31708 | 195 | 0.614987% |
| D | 31717 | 868 | 2.736703% |
Noise dominated data is calculated using 1-second bins in cleaned event files. If a bin has >2000 counts, and if more than 50% of those come from <1% of pixels, then it is considered to be noise-dominated and hence unusable.
| Quadrant | # 1 sec bins | Bins with >0 counts | Bins with >2000 counts | High rate bins dominated by noise | Noise dominated (total time) | Noise dominated (detector-on time) | Marked lightcurve |
|---|---|---|---|---|---|---|---|
| A | 37841 | 31931 | 0 | 0 | 0.00% | 0.00% |  |
| B | 37841 | 31947 | 0 | 0 | 0.00% | 0.00% | 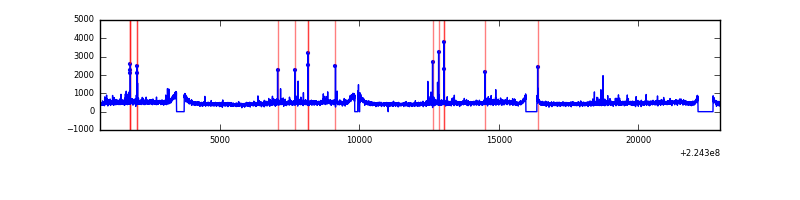 |
| C | 37841 | 31940 | 0 | 0 | 0.00% | 0.00% | 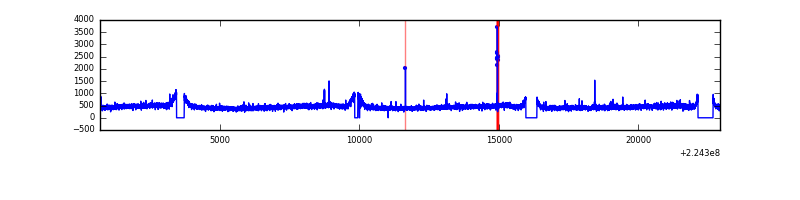 |
| D | 37841 | 31942 | 0 | 0 | 0.00% | 0.00% | 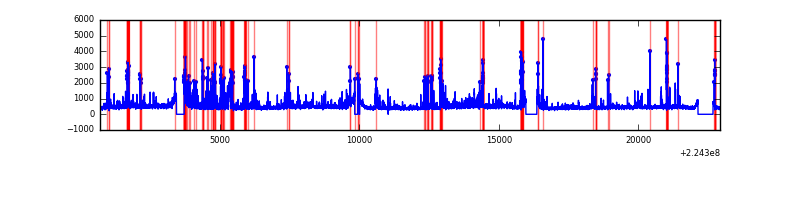 |
Top three noisy pixels from each quadrant. If the there are fewer than three noisy pixels in the level2.evt file, extra rows are filled as -1
| Pixel properties | Quadrant properties | ||||||
|---|---|---|---|---|---|---|---|
| Quadrant | DetID | PixID | Counts | Sigma | Mean | Median | Sigma |
| A | 14 | 188 | 1706 | 11.24 | 440 | 410 | 115.3 |
| A | 0 | 29 | 1644 | 10.7 | 440 | 410 | 115.3 |
| A | 14 | 204 | 1497 | 9.43 | 440 | 410 | 115.3 |
| B | 2 | 9 | 1416 | 10.89 | 435 | 411 | 92.3 |
| B | 3 | 17 | 1157 | 8.08 | 435 | 411 | 92.3 |
| B | 12 | 226 | 1146 | 7.96 | 435 | 411 | 92.3 |
| C | 1 | 80 | 1253 | 7.14 | 446 | 412 | 117.8 |
| C | 12 | 241 | 1216 | 6.83 | 446 | 412 | 117.8 |
| C | 1 | 81 | 1216 | 6.83 | 446 | 412 | 117.8 |
| D | 3 | 14 | 1152 | 6.86 | 413 | 374 | 113.4 |
| D | 6 | 231 | 1088 | 6.3 | 413 | 374 | 113.4 |
| D | 6 | 83 | 1077 | 6.2 | 413 | 374 | 113.4 |
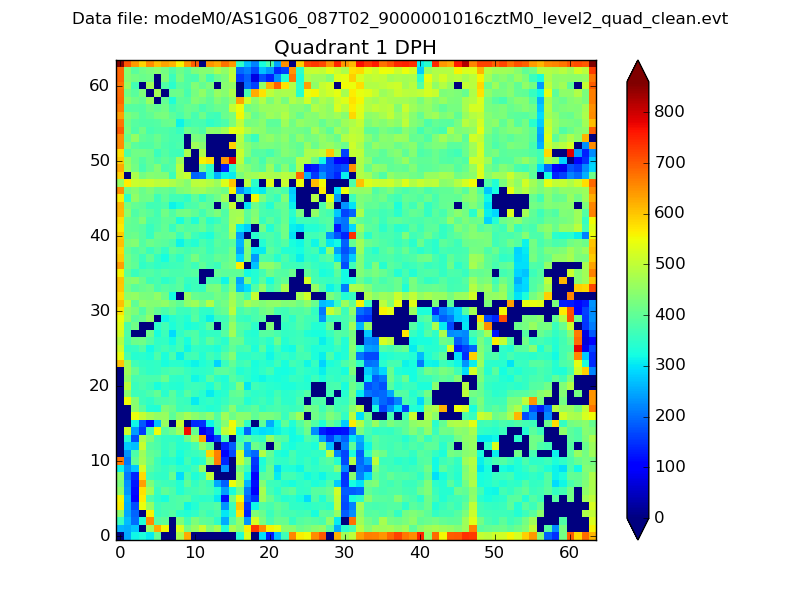
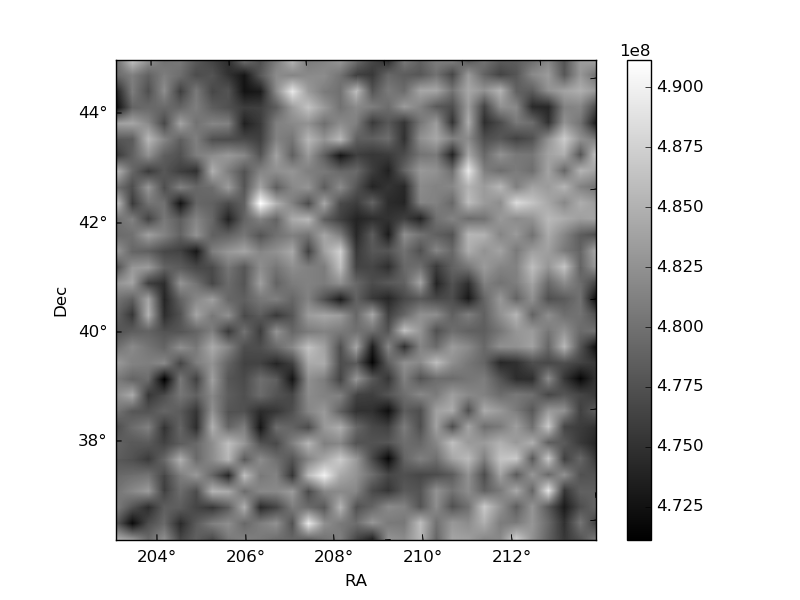
Histogram calculated using DETX and DETY for each event in the final _common_clean file
| Quadrant A | 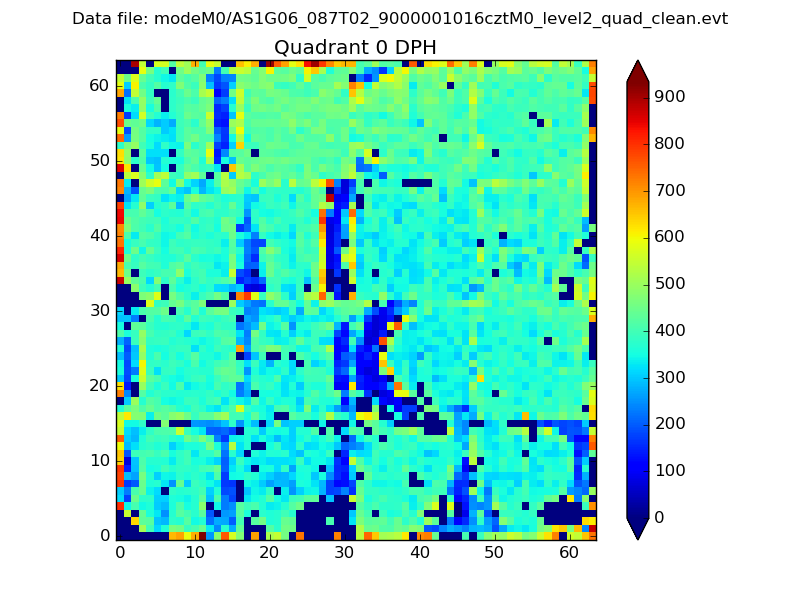 |
 |
Quadrant B |
|---|---|---|---|
| Quadrant D | 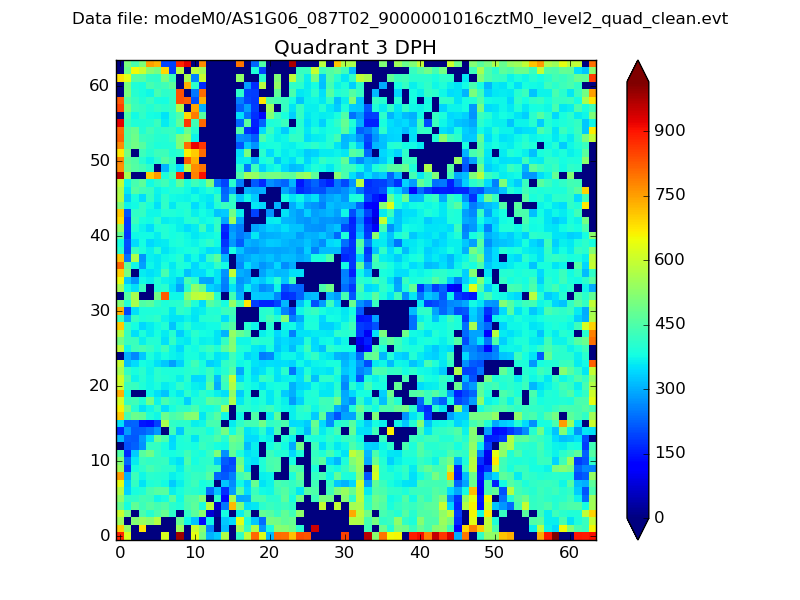 |
 |
Quadrant C |
| Plot type | Count rate plots | Images |
|---|---|---|
| Comparison with Poisson distribution Blue bars denote a histogram of data divided into 1 sec bins. Red curve is a Poisson curve with rate = median count rate of data. |
 |
 |
| Quadrant-wise count rates Data is divided into 100 sec bins |
 |
|
| Module-wise count rates for Quadrant A Data is divided into 100 sec bins |
 |
 |
| Module-wise count rates for Quadrant B Data is divided into 100 sec bins |
 |
 |
| Module-wise count rates for Quadrant C Data is divided into 100 sec bins |
 |
 |
| Module-wise count rates for Quadrant D Data is divided into 100 sec bins |
 |
 |
| Parameter | Plot |
|---|---|
| CZT HV Monitor |  |
| D_VDD |  |
| Temperature 1 | 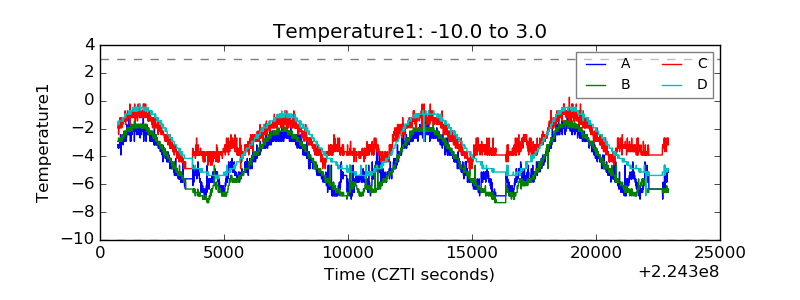 |
| Veto HV Monitor |  |
| Veto LLD |  |
| Alpha Counter | 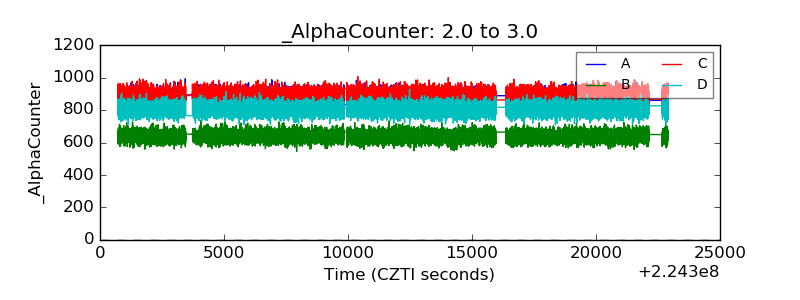 |
| _CPM_Rate | 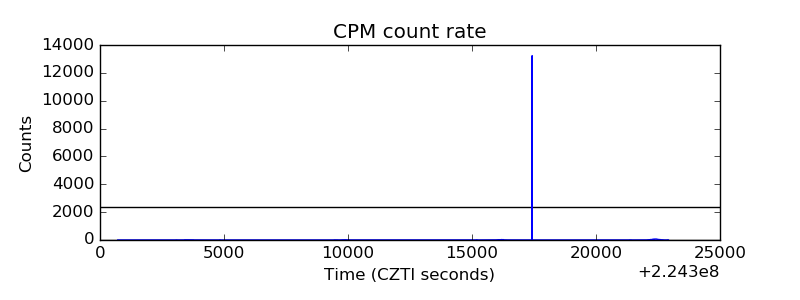 |
| CZT Counter |  |
| +2.5 Volts monitor |  |
| +5 Volts monitor |  |
| _ROLL_ROT |  |
| _Roll_DEC | 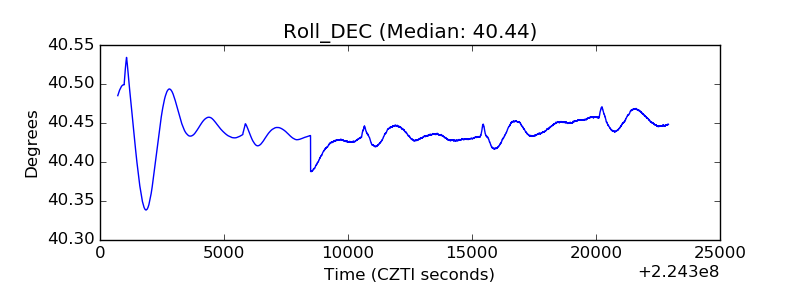 |
| _Roll_RA |  |
| Veto Counter |  |