| Param | Original file | Final file |
|---|---|---|
| Filename | modeM0/AS1G06_087T02_9000001016_07405cztM0_level2.evt | modeM0/AS1G06_087T02_9000001016_07405cztM0_level2_quad_clean.evt |
| Size (bytes) | 1,218,899,520 | 217,465,920 |
| Size | 1.1 GB | 207.4 MB |
| Events in quadrant A | 8,414,835 | 1,326,125 |
| Events in quadrant B | 8,802,579 | 1,355,360 |
| Events in quadrant C | 8,364,442 | 1,350,768 |
| Events in quadrant D | 10,067,615 | 1,265,975 |
| Mode SS | |||
|---|---|---|---|
| Quadrant | BADHDUFLAG | Total packets | Discarded packets |
| A | 0 | 397 | 21 |
| B | 0 | 396 | 14 |
| C | 0 | 396 | 16 |
| D | 0 | 396 | 22 |
| Mode M0 | |||
|---|---|---|---|
| Quadrant | BADHDUFLAG | Total packets | Discarded packets |
| A | 0 | 39778 | 1680 |
| B | 0 | 40210 | 1634 |
| C | 0 | 39876 | 1669 |
| D | 0 | 45157 | 1826 |
| Mode M9 | |||
|---|---|---|---|
| Quadrant | BADHDUFLAG | Total packets | Discarded packets |
| A | 0 | 17 | 8 |
| B | 0 | 16 | 6 |
| C | 0 | 17 | 8 |
| D | 0 | 14 | 4 |
| Quadrant | Total seconds | Saturated seconds | Saturation percentage |
|---|---|---|---|
| A | 18676 | 230 | 1.231527% |
| B | 18694 | 229 | 1.224992% |
| C | 18693 | 115 | 0.615204% |
| D | 18682 | 612 | 3.275881% |
Noise dominated data is calculated using 1-second bins in cleaned event files. If a bin has >2000 counts, and if more than 50% of those come from <1% of pixels, then it is considered to be noise-dominated and hence unusable.
| Quadrant | # 1 sec bins | Bins with >0 counts | Bins with >2000 counts | High rate bins dominated by noise | Noise dominated (total time) | Noise dominated (detector-on time) | Marked lightcurve |
|---|---|---|---|---|---|---|---|
| A | 21281 | 18963 | 2 | 2 | 0.01% | 0.01% | 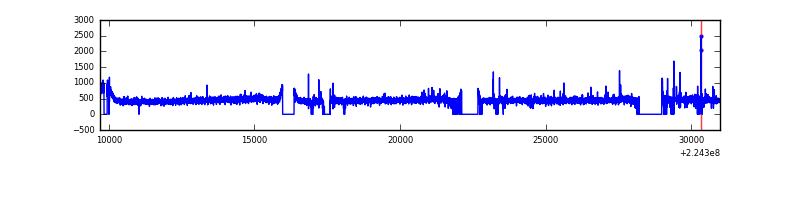 |
| B | 21281 | 18979 | 8 | 8 | 0.04% | 0.04% | 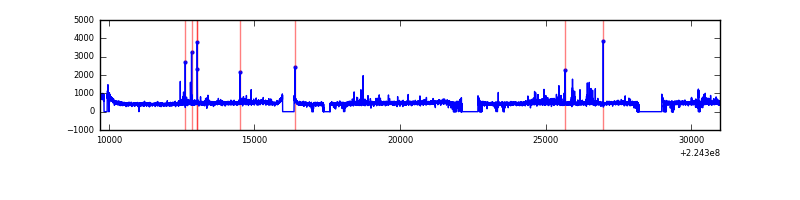 |
| C | 21281 | 18968 | 16 | 16 | 0.08% | 0.08% | 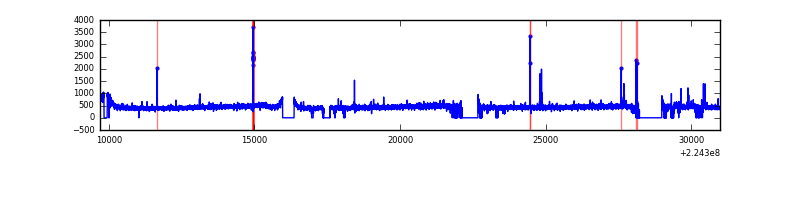 |
| D | 21281 | 18971 | 429 | 429 | 2.02% | 2.26% | 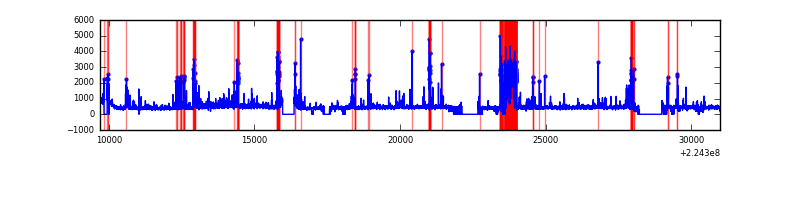 |
Top three noisy pixels from each quadrant. If the there are fewer than three noisy pixels in the level2.evt file, extra rows are filled as -1
| Pixel properties | Quadrant properties | ||||||
|---|---|---|---|---|---|---|---|
| Quadrant | DetID | PixID | Counts | Sigma | Mean | Median | Sigma |
| A | 3 | 1 | 73726 | 161.03 | 2162 | 2110 | 444.7 |
| A | 0 | 226 | 21167 | 42.85 | 2162 | 2110 | 444.7 |
| A | 12 | 194 | 19206 | 38.44 | 2162 | 2110 | 444.7 |
| B | 0 | 214 | 239184 | 566.44 | 2181 | 2125 | 418.5 |
| B | 12 | 111 | 42977 | 97.61 | 2181 | 2125 | 418.5 |
| B | 4 | 170 | 41992 | 95.26 | 2181 | 2125 | 418.5 |
| C | 1 | 16 | 67120 | 132.66 | 2101 | 2105 | 490.1 |
| C | 8 | 128 | 32952 | 62.94 | 2101 | 2105 | 490.1 |
| C | 9 | 68 | 27228 | 51.26 | 2101 | 2105 | 490.1 |
| D | 15 | 47 | 894223 | 1744.41 | 2076 | 2009 | 511.5 |
| D | 14 | 34 | 341958 | 664.65 | 2076 | 2009 | 511.5 |
| D | 12 | 233 | 271338 | 526.58 | 2076 | 2009 | 511.5 |
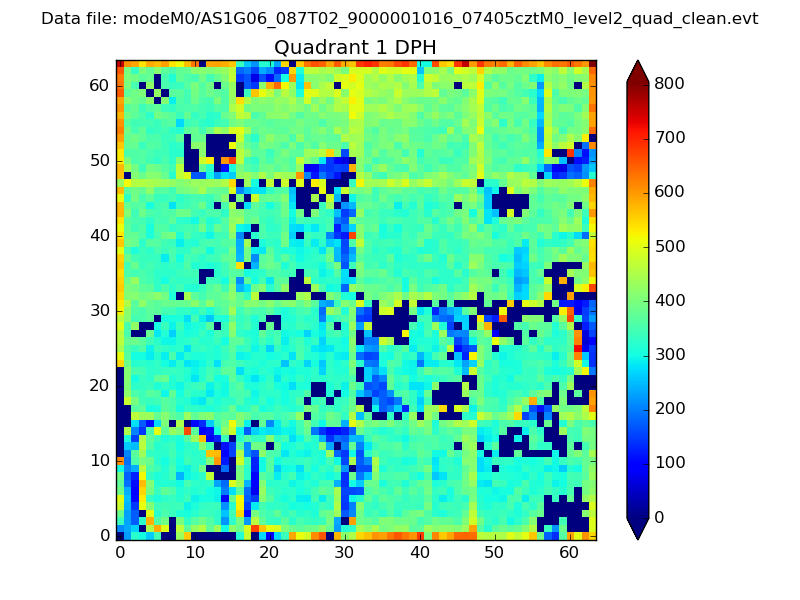
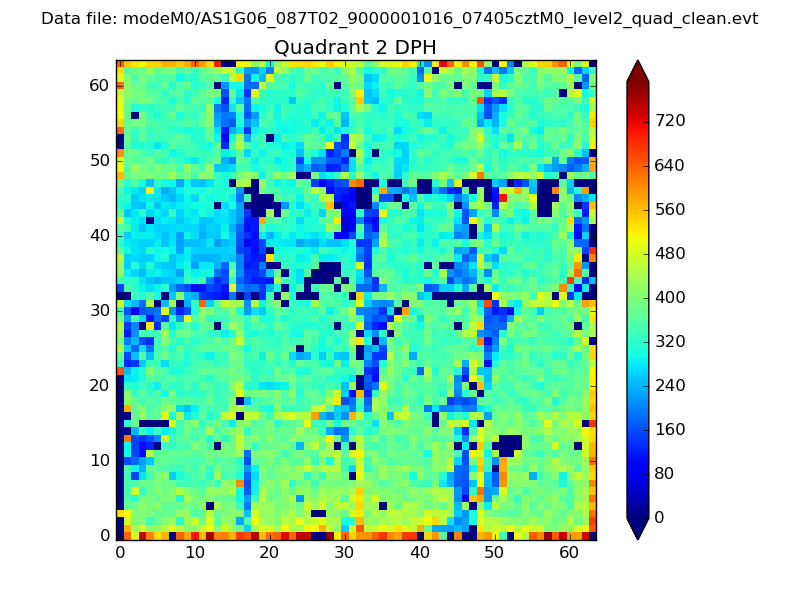
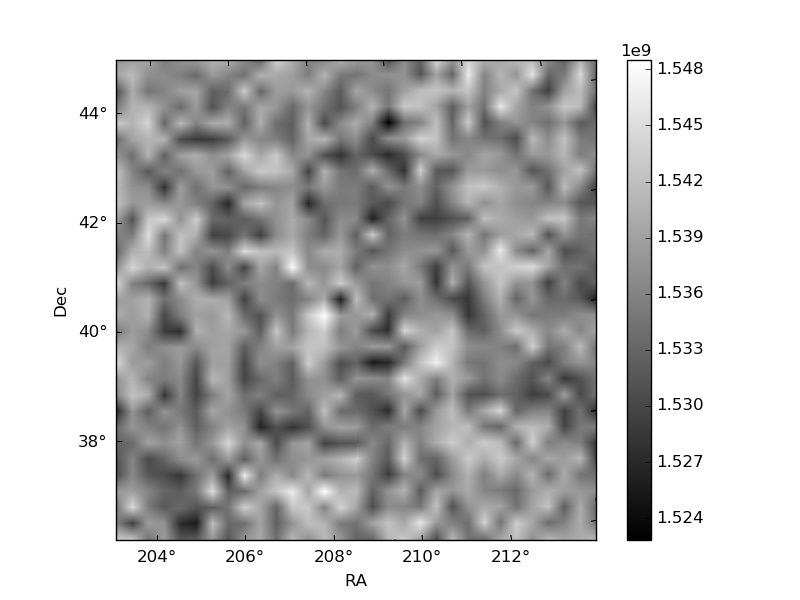
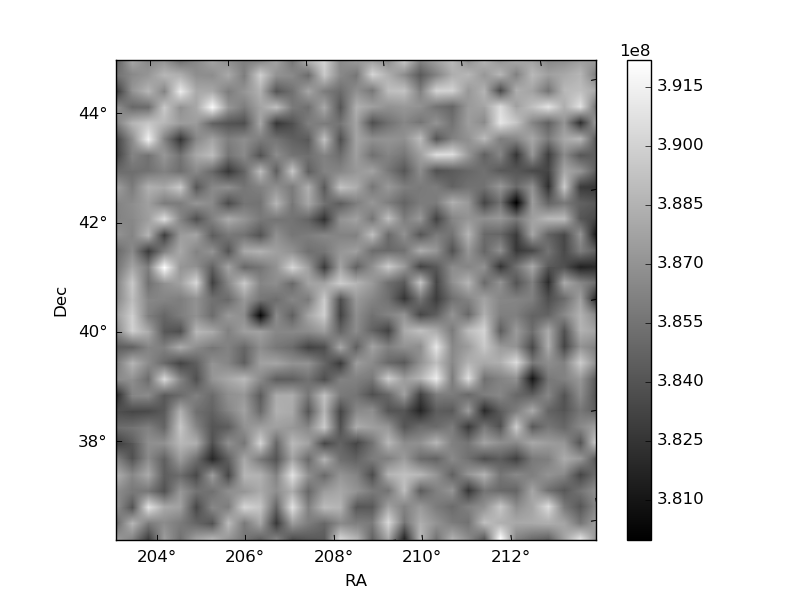
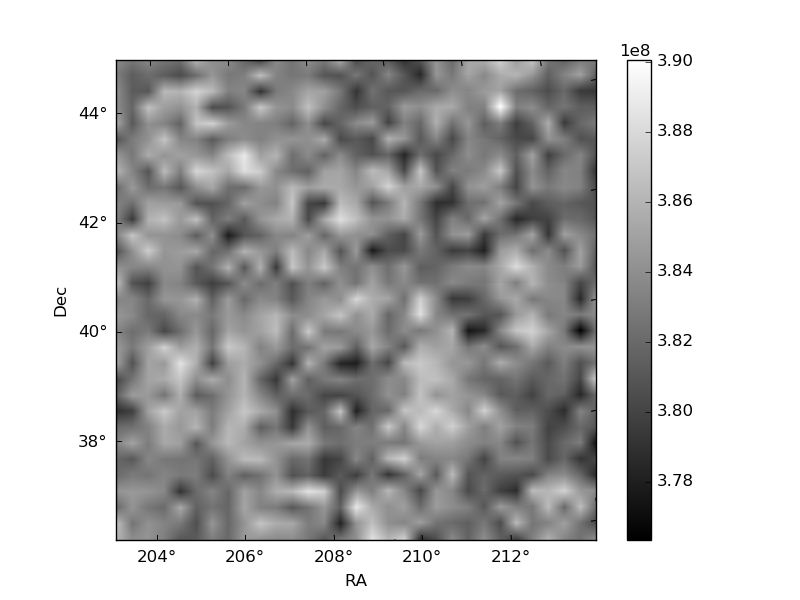
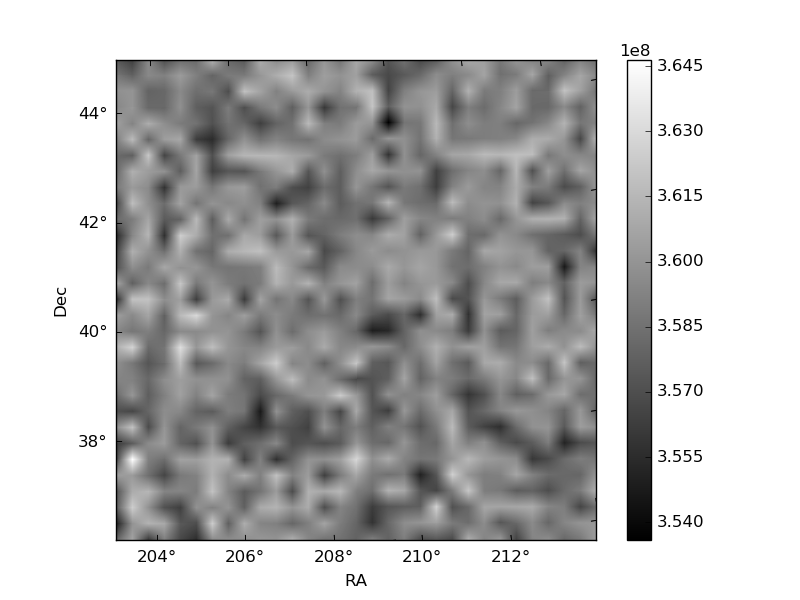
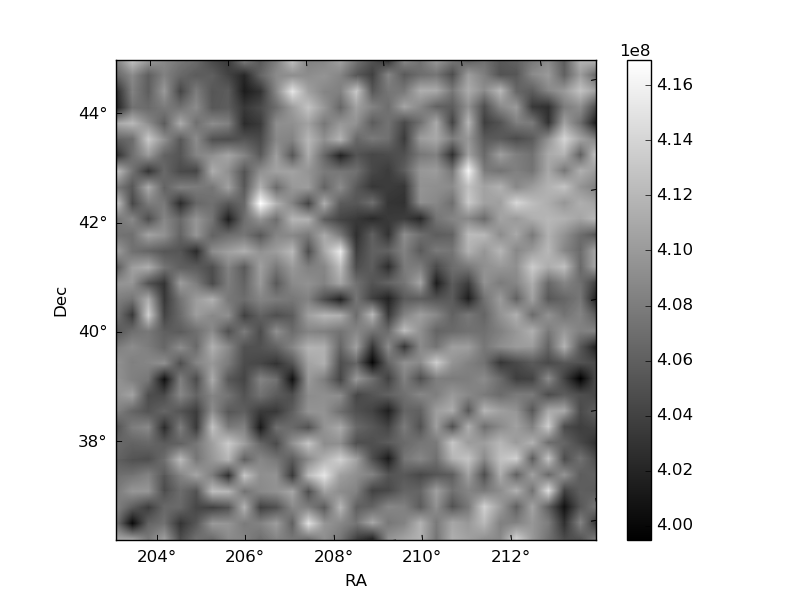
Histogram calculated using DETX and DETY for each event in the final _common_clean file
| Quadrant A |  |
 |
Quadrant B |
|---|---|---|---|
| Quadrant D | 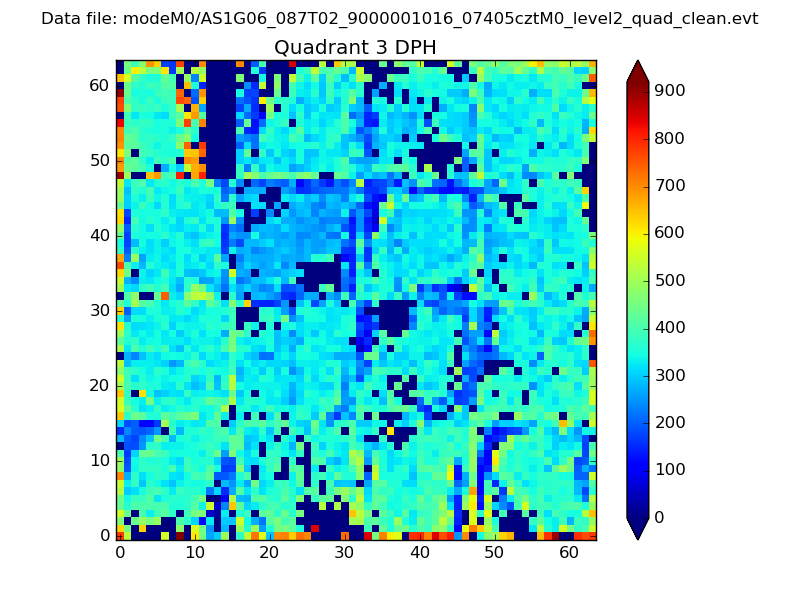 |
 |
Quadrant C |
| Plot type | Count rate plots | Images |
|---|---|---|
| Comparison with Poisson distribution Blue bars denote a histogram of data divided into 1 sec bins. Red curve is a Poisson curve with rate = median count rate of data. |
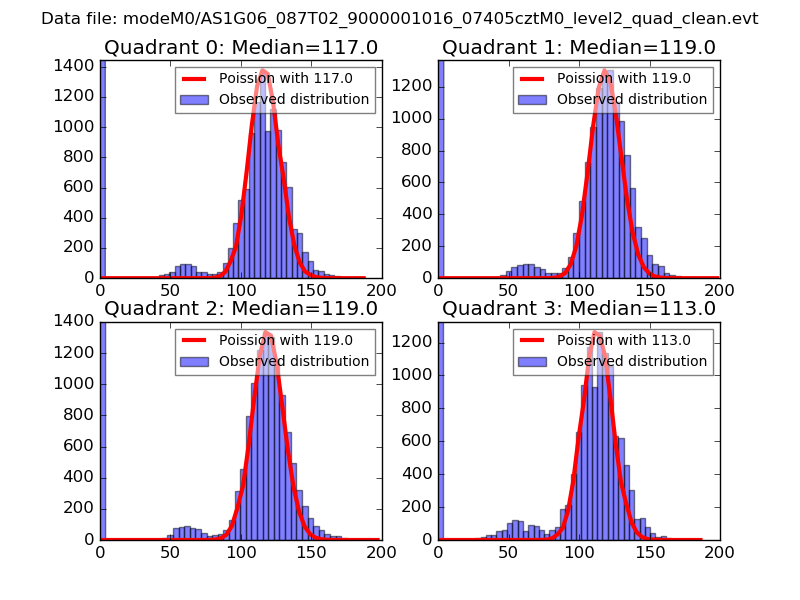 |
 |
| Quadrant-wise count rates Data is divided into 100 sec bins |
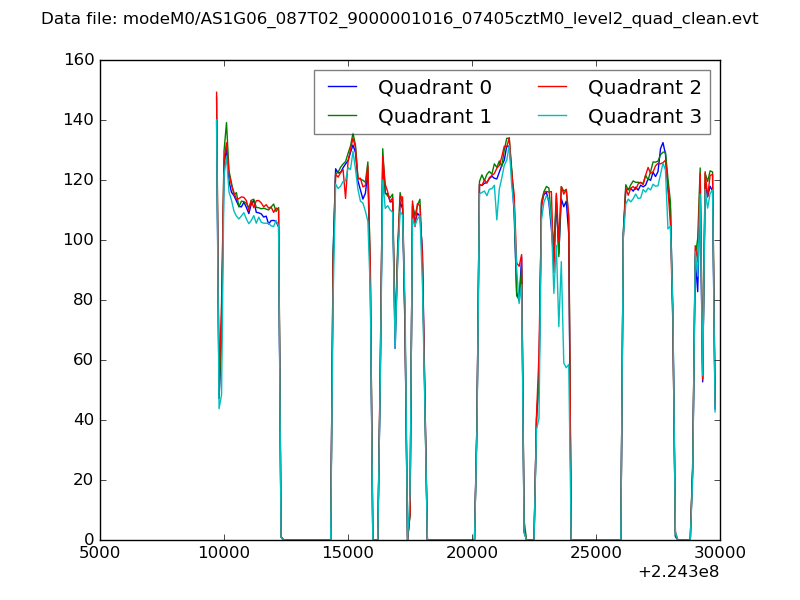 |
|
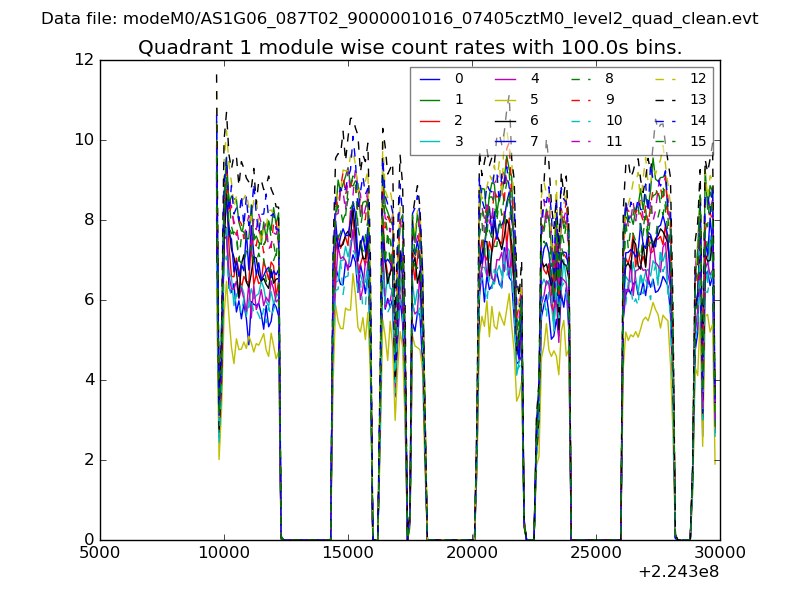
| Module-wise count rates for Quadrant A Data is divided into 100 sec bins |
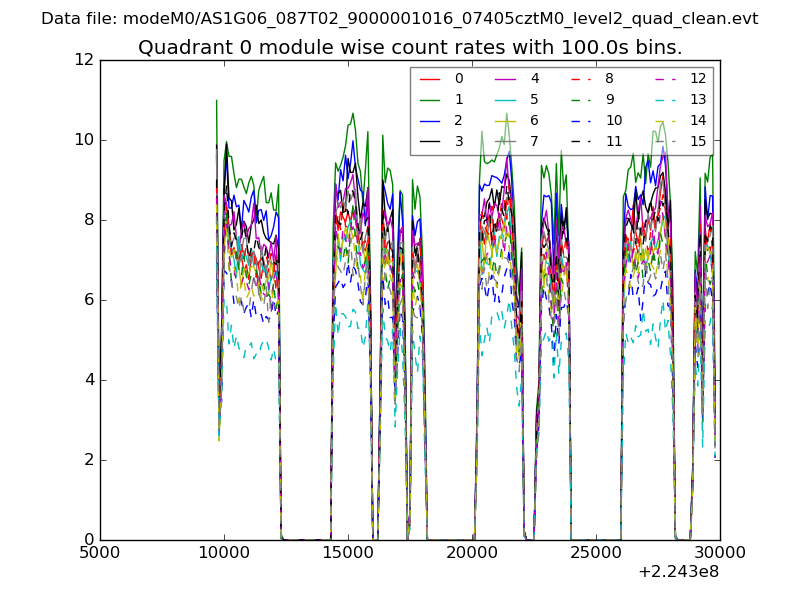 |
 |
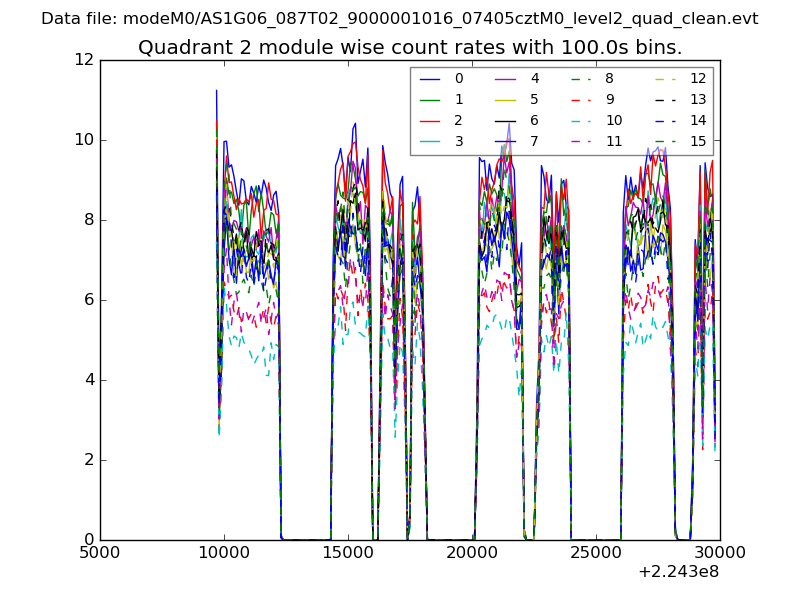
| Module-wise count rates for Quadrant B Data is divided into 100 sec bins |
 |
 |
| Module-wise count rates for Quadrant C Data is divided into 100 sec bins |
 |
 |
| Module-wise count rates for Quadrant D Data is divided into 100 sec bins |
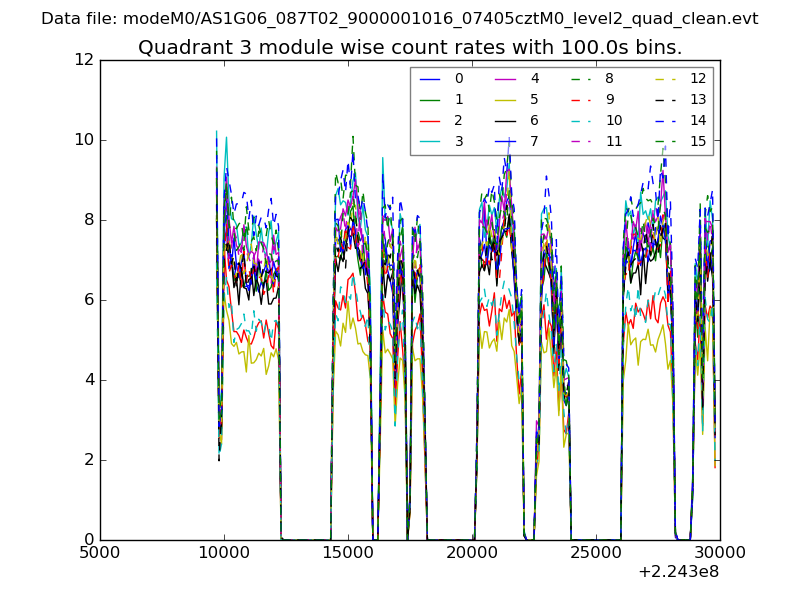 |
 |
| Parameter | Plot |
|---|---|
| CZT HV Monitor | 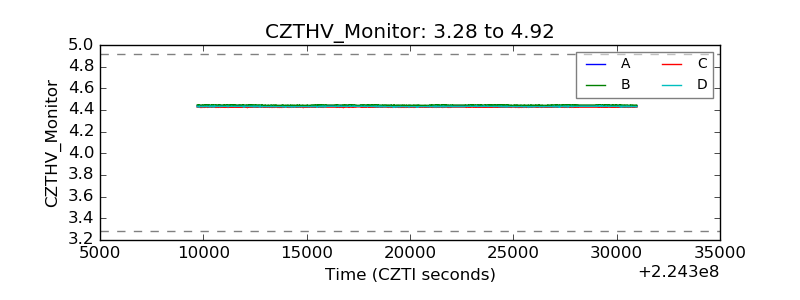 |
| D_VDD | 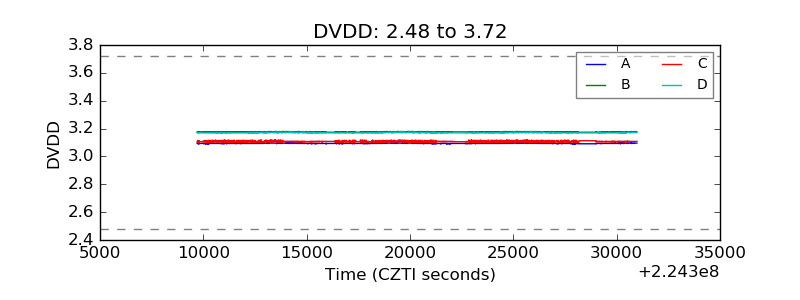 |
| Temperature 1 | 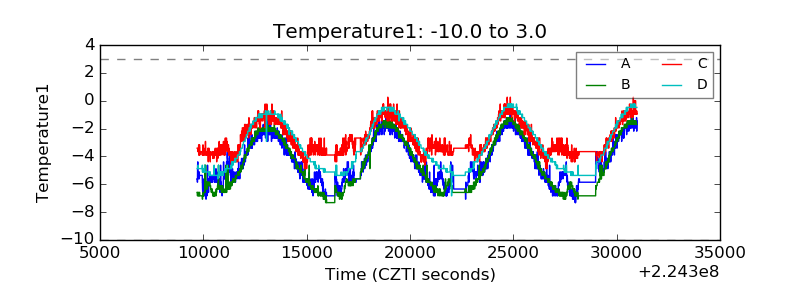 |
| Veto HV Monitor | 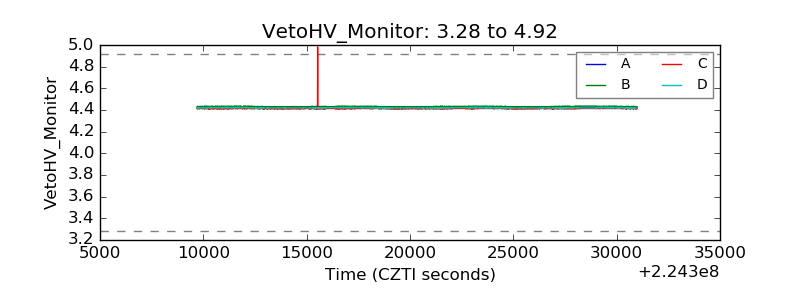 |
| Veto LLD | 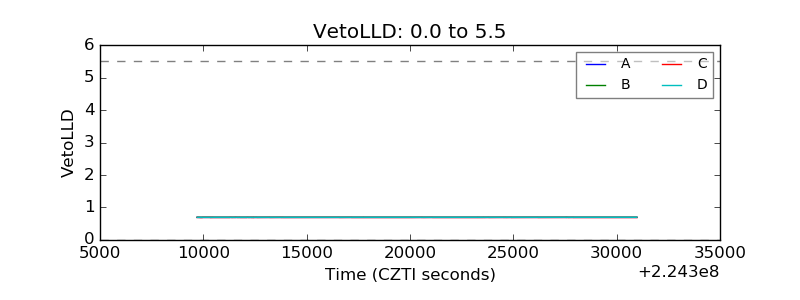 |
| Alpha Counter | 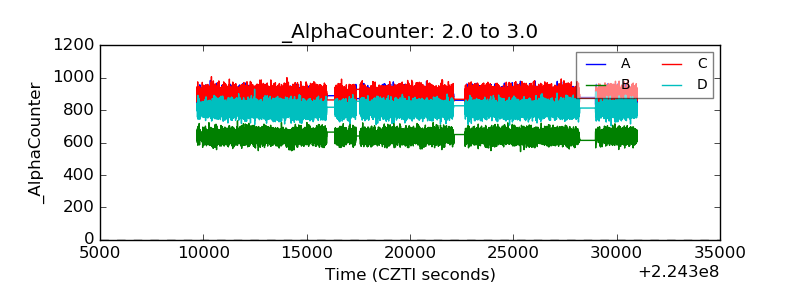 |
| _CPM_Rate | 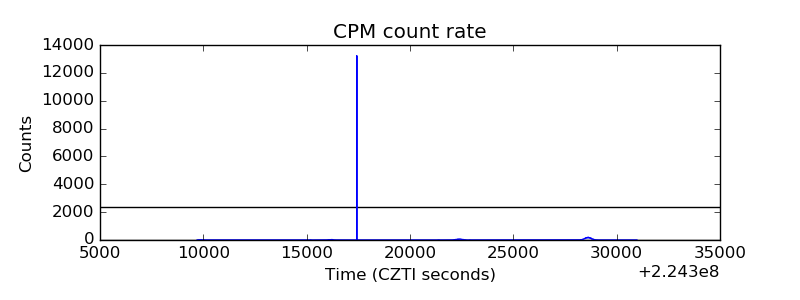 |
| CZT Counter | 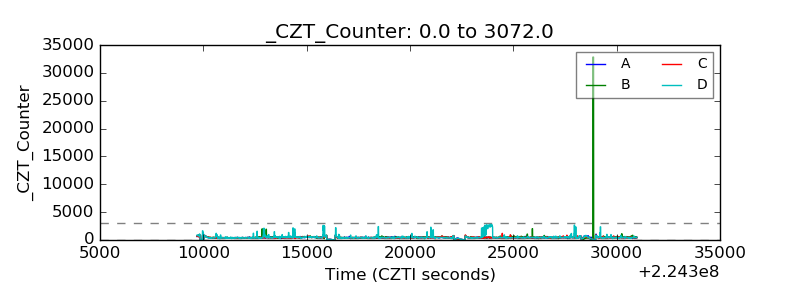 |
| +2.5 Volts monitor |  |
| +5 Volts monitor |  |
| _ROLL_ROT | 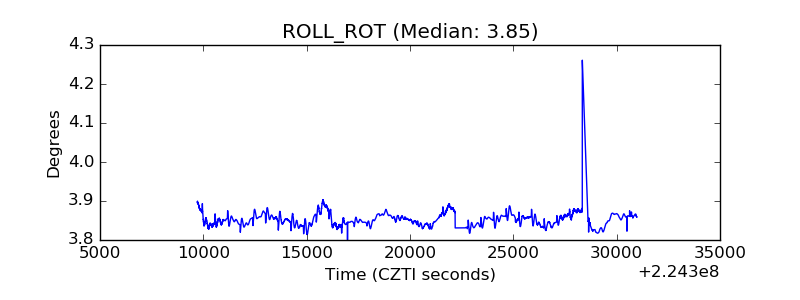 |
| _Roll_DEC | 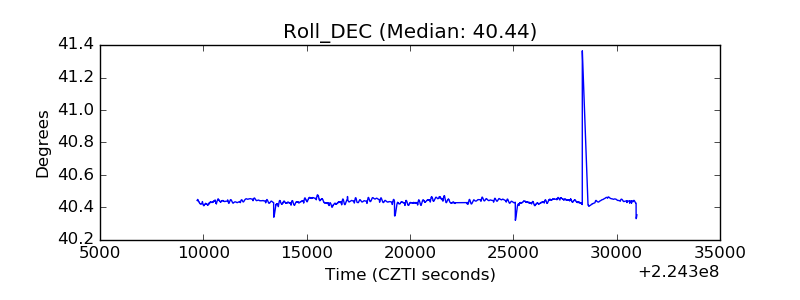 |
| _Roll_RA | 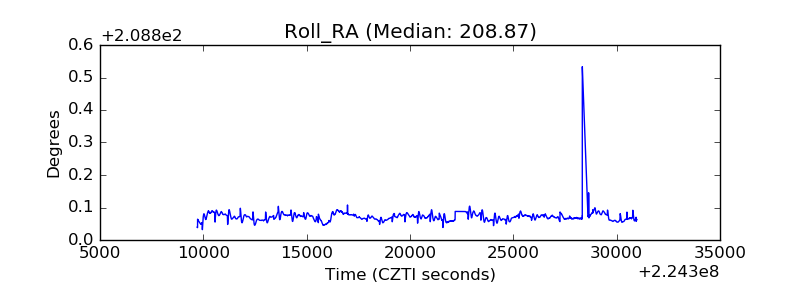 |
| Veto Counter | 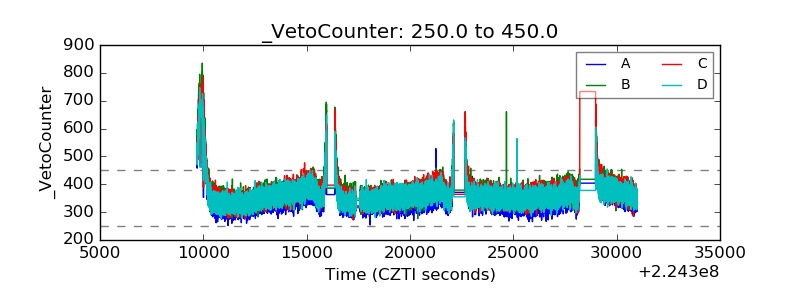 |