| Param | Original file | Final file |
|---|---|---|
| Filename | modeM0/AS1G06_087T02_9000001016_07406cztM0_level2.evt | modeM0/AS1G06_087T02_9000001016_07406cztM0_level2_quad_clean.evt |
| Size (bytes) | 252,743,040 | 42,842,880 |
| Size | 241.0 MB | 40.9 MB |
| Events in quadrant A | 1,783,867 | 257,690 |
| Events in quadrant B | 1,888,600 | 261,787 |
| Events in quadrant C | 1,796,782 | 258,558 |
| Events in quadrant D | 1,923,258 | 248,606 |
| Mode SS | |||
|---|---|---|---|
| Quadrant | BADHDUFLAG | Total packets | Discarded packets |
| A | 0 | 85 | 7 |
| B | 0 | 85 | 7 |
| C | 0 | 84 | 8 |
| D | 0 | 85 | 7 |
| Mode M0 | |||
|---|---|---|---|
| Quadrant | BADHDUFLAG | Total packets | Discarded packets |
| A | 0 | 8512 | 708 |
| B | 0 | 8730 | 692 |
| C | 0 | 8523 | 676 |
| D | 0 | 9004 | 684 |
| Mode M9 | |||
|---|---|---|---|
| Quadrant | BADHDUFLAG | Total packets | Discarded packets |
| A | 0 | 9 | 0 |
| B | 0 | 9 | 0 |
| C | 0 | 9 | 0 |
| D | 0 | 10 | 1 |
| Quadrant | Total seconds | Saturated seconds | Saturation percentage |
|---|---|---|---|
| A | 3824 | 39 | 1.019874% |
| B | 3836 | 34 | 0.886340% |
| C | 3828 | 24 | 0.626959% |
| D | 3832 | 51 | 1.330898% |
Noise dominated data is calculated using 1-second bins in cleaned event files. If a bin has >2000 counts, and if more than 50% of those come from <1% of pixels, then it is considered to be noise-dominated and hence unusable.
| Quadrant | # 1 sec bins | Bins with >0 counts | Bins with >2000 counts | High rate bins dominated by noise | Noise dominated (total time) | Noise dominated (detector-on time) | Marked lightcurve |
|---|---|---|---|---|---|---|---|
| A | 5121 | 3897 | 0 | 0 | 0.00% | 0.00% |  |
| B | 5121 | 3895 | 0 | 0 | 0.00% | 0.00% |  |
| C | 5121 | 3899 | 0 | 0 | 0.00% | 0.00% |  |
| D | 5121 | 3903 | 16 | 16 | 0.31% | 0.41% |  |
Top three noisy pixels from each quadrant. If the there are fewer than three noisy pixels in the level2.evt file, extra rows are filled as -1
| Pixel properties | Quadrant properties | ||||||
|---|---|---|---|---|---|---|---|
| Quadrant | DetID | PixID | Counts | Sigma | Mean | Median | Sigma |
| A | 3 | 1 | 16741 | 174.11 | 458 | 448 | 93.6 |
| A | 0 | 226 | 4543 | 43.76 | 458 | 448 | 93.6 |
| A | 12 | 194 | 3989 | 37.84 | 458 | 448 | 93.6 |
| B | 0 | 214 | 68303 | 761.91 | 461 | 450 | 89.1 |
| B | 4 | 170 | 10870 | 117.0 | 461 | 450 | 89.1 |
| B | 12 | 111 | 9144 | 97.62 | 461 | 450 | 89.1 |
| C | 10 | 22 | 56321 | 528.68 | 445 | 445 | 105.7 |
| C | 13 | 61 | 3465 | 28.57 | 445 | 445 | 105.7 |
| C | 1 | 16 | 2256 | 17.14 | 445 | 445 | 105.7 |
| D | 14 | 34 | 155463 | 1410.9 | 445 | 431 | 109.9 |
| D | 2 | 216 | 30720 | 275.65 | 445 | 431 | 109.9 |
| D | 13 | 137 | 21991 | 196.21 | 445 | 431 | 109.9 |
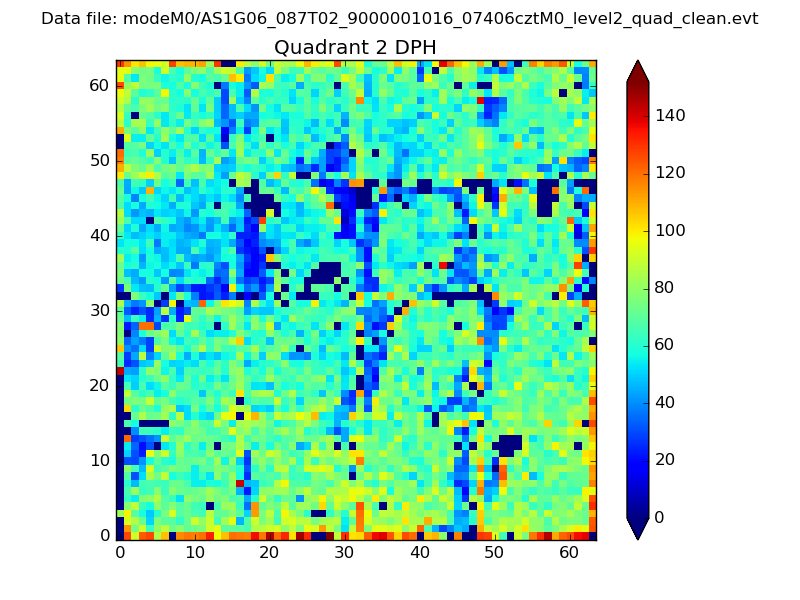
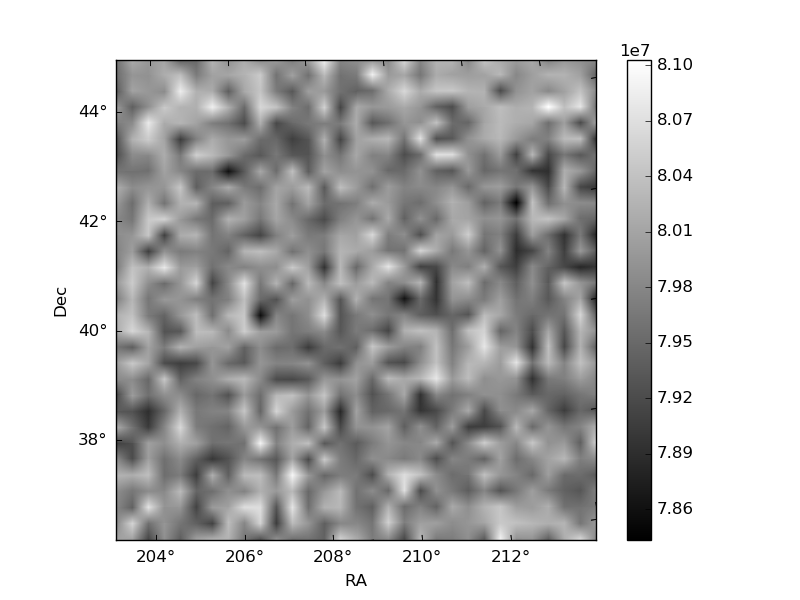
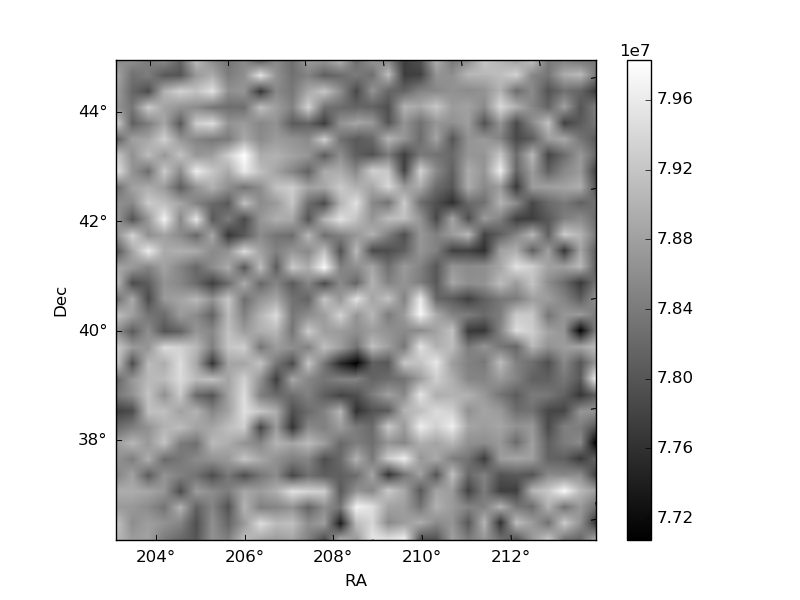
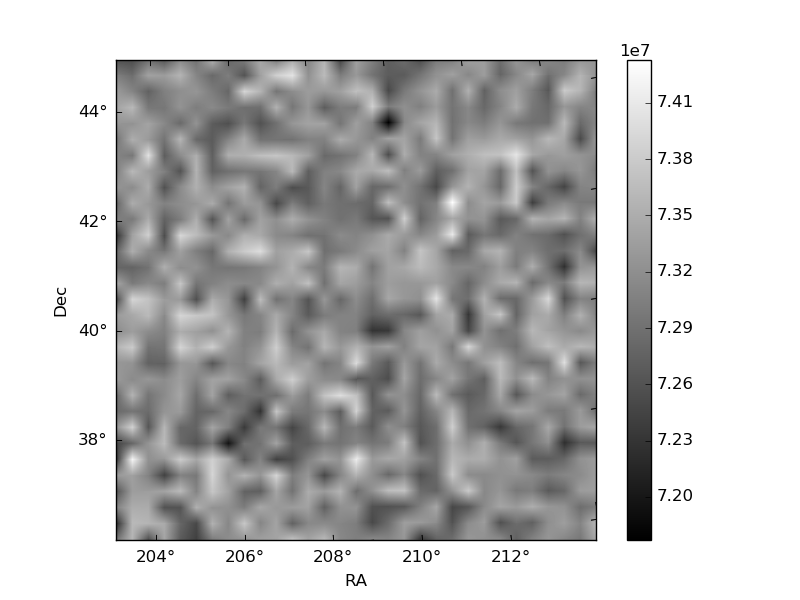
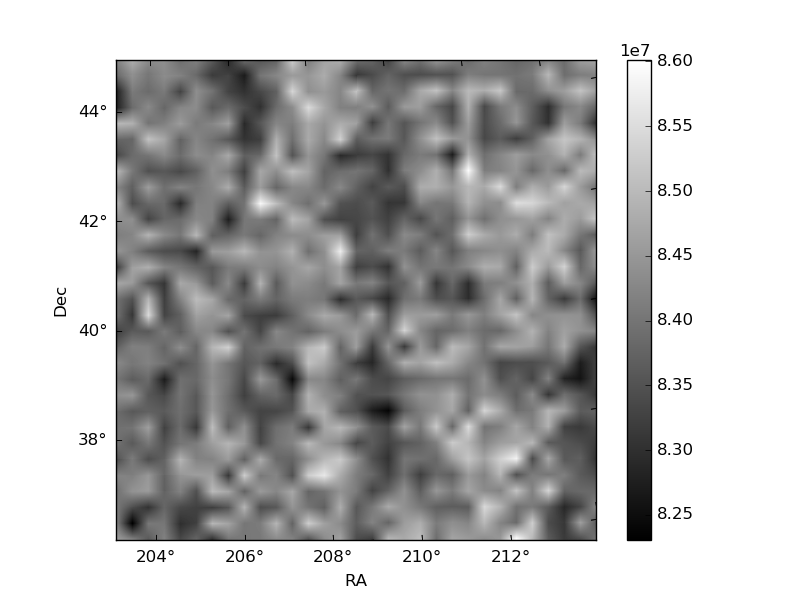
Histogram calculated using DETX and DETY for each event in the final _common_clean file
| Quadrant A | 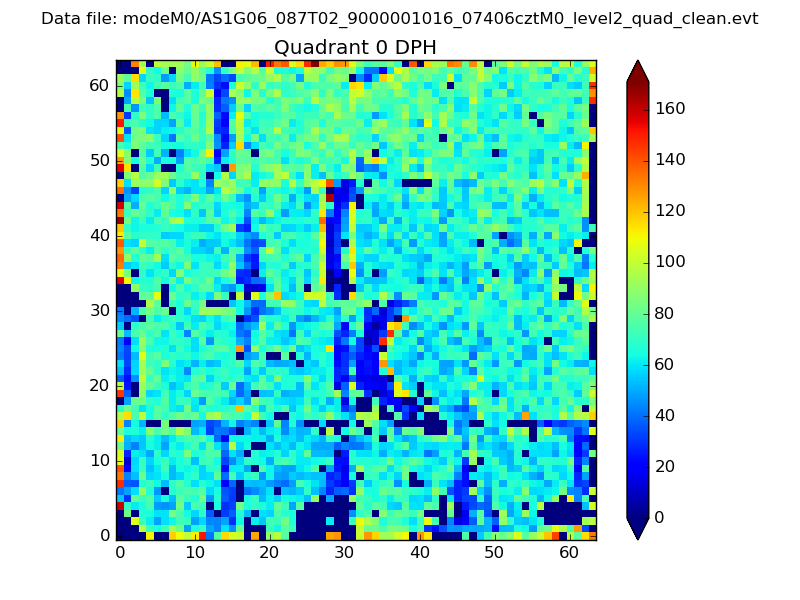 |
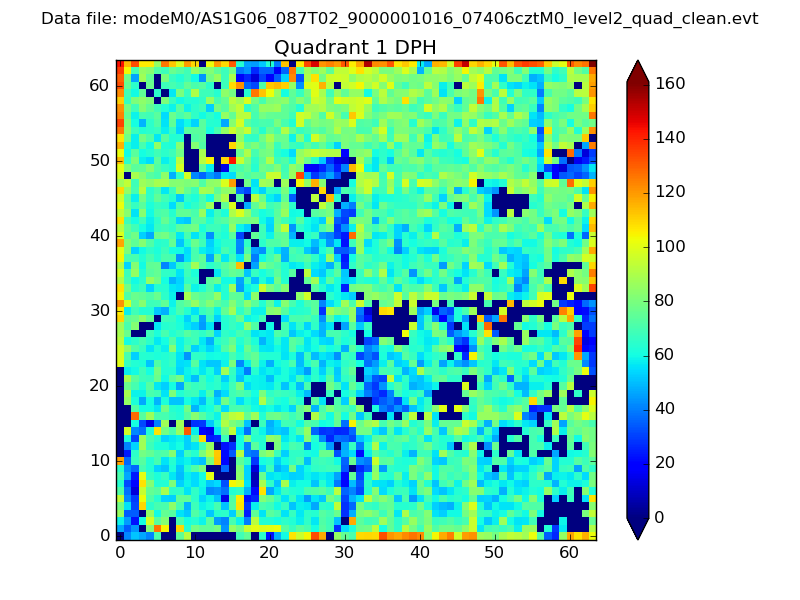 |
Quadrant B |
|---|---|---|---|
| Quadrant D | 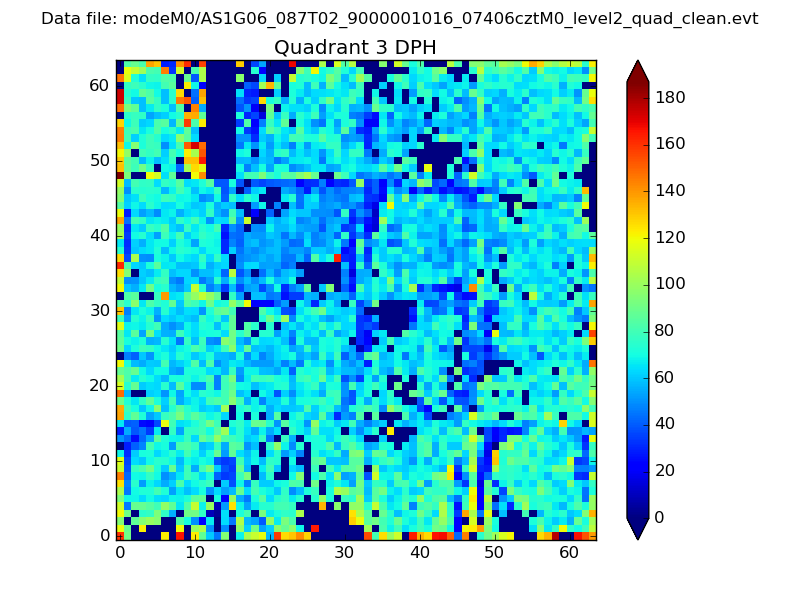 |
 |
Quadrant C |
| Plot type | Count rate plots | Images |
|---|---|---|
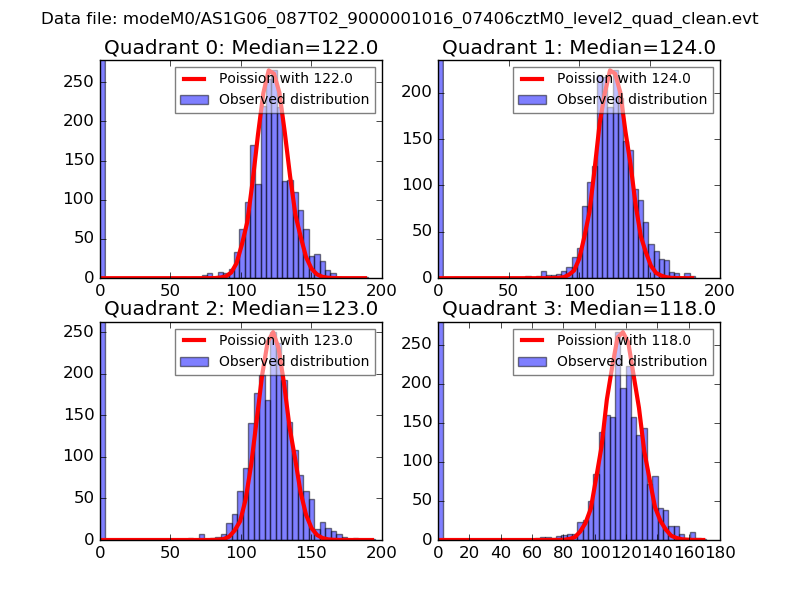
| Comparison with Poisson distribution Blue bars denote a histogram of data divided into 1 sec bins. Red curve is a Poisson curve with rate = median count rate of data. |
 |
 |
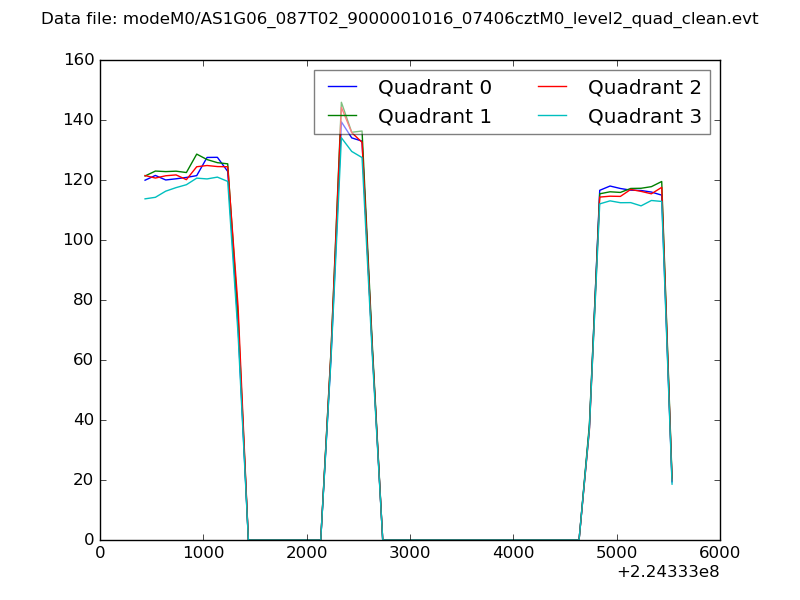
| Quadrant-wise count rates Data is divided into 100 sec bins |
 |
|
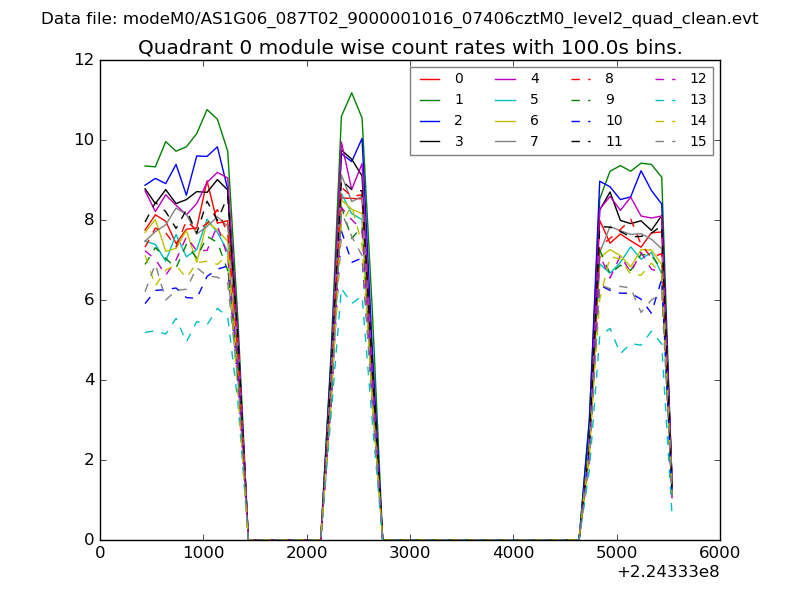
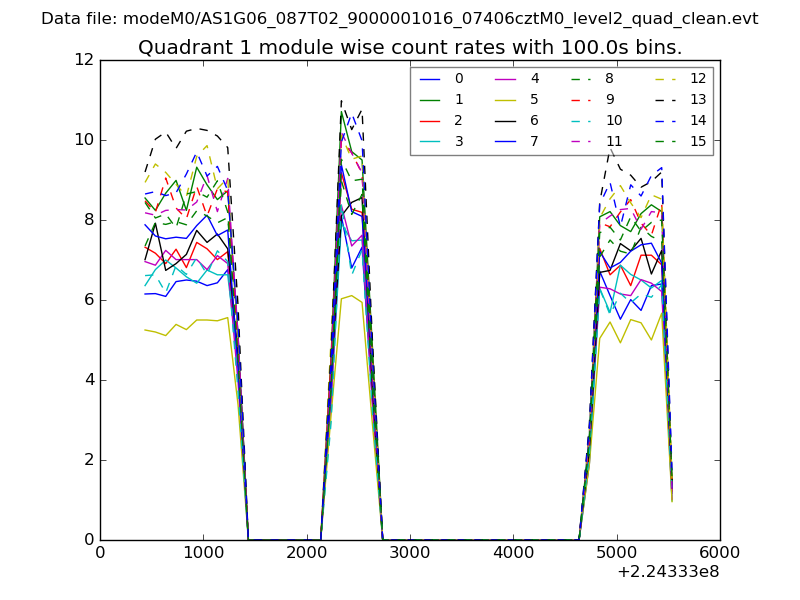
| Module-wise count rates for Quadrant A Data is divided into 100 sec bins |
 |
 |
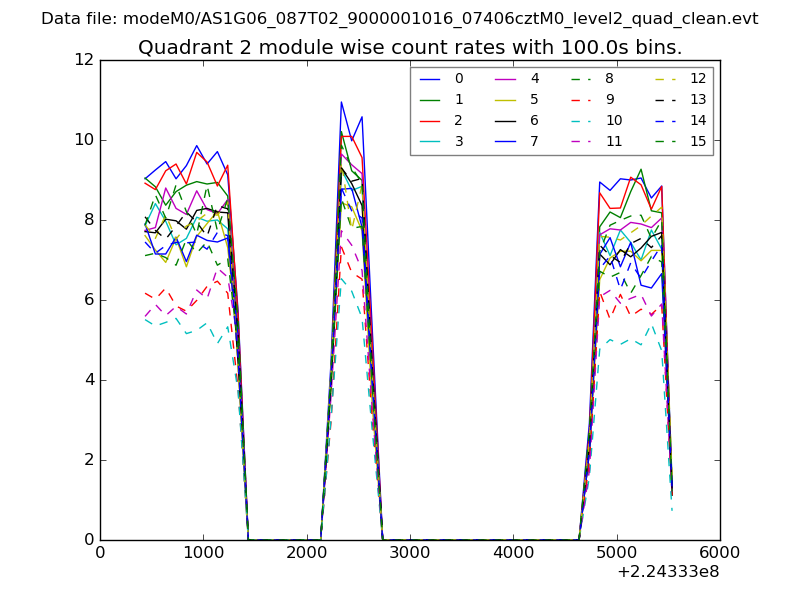
| Module-wise count rates for Quadrant B Data is divided into 100 sec bins |
 |
 |
| Module-wise count rates for Quadrant C Data is divided into 100 sec bins |
 |
 |
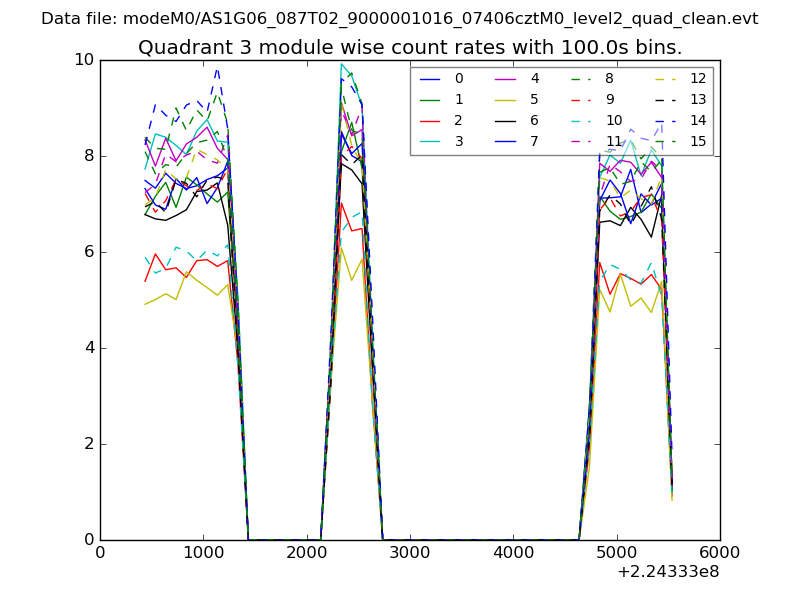
| Module-wise count rates for Quadrant D Data is divided into 100 sec bins |
 |
 |
| Parameter | Plot |
|---|---|
| CZT HV Monitor | 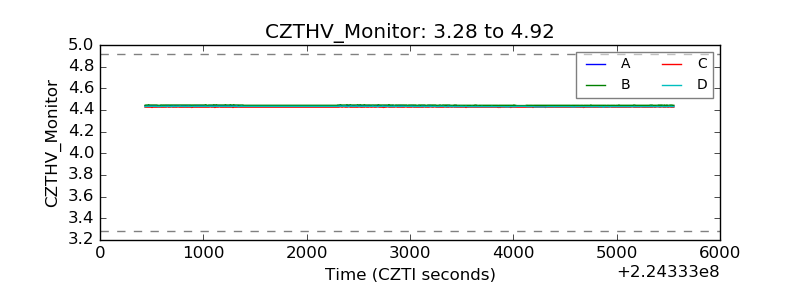 |
| D_VDD | 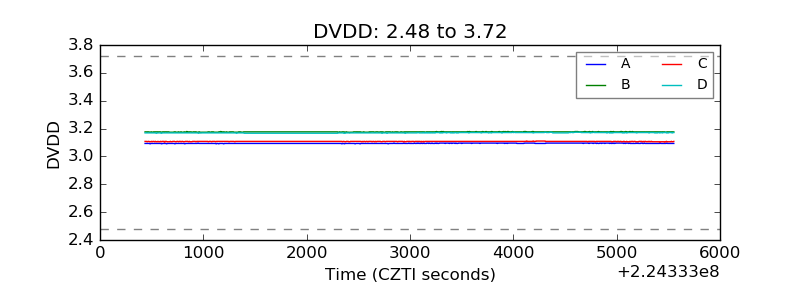 |
| Temperature 1 | 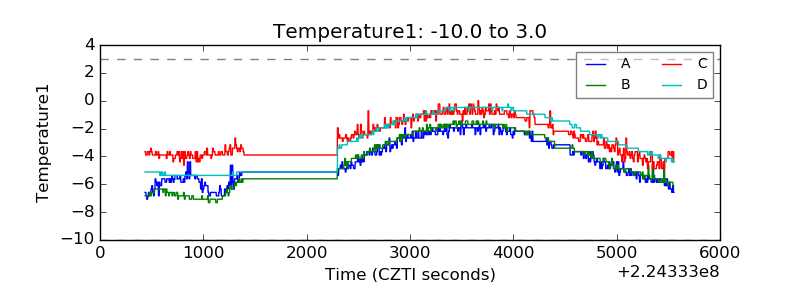 |
| Veto HV Monitor | 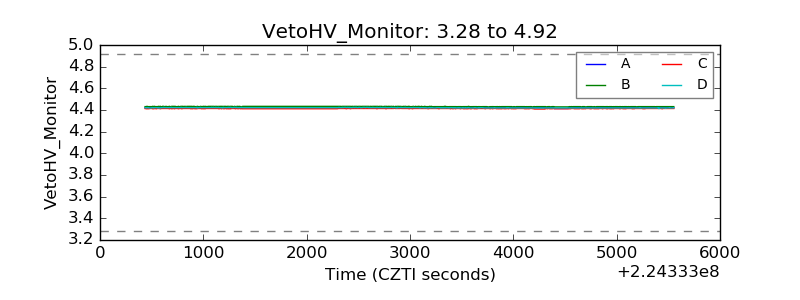 |
| Veto LLD |  |
| Alpha Counter | 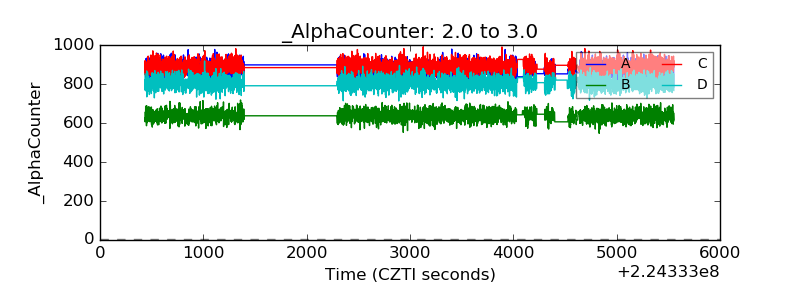 |
| _CPM_Rate | 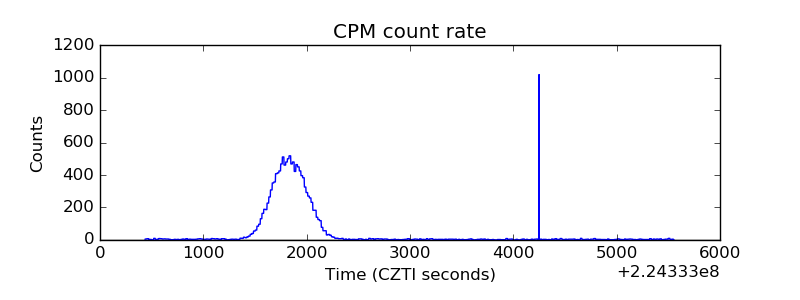 |
| CZT Counter | 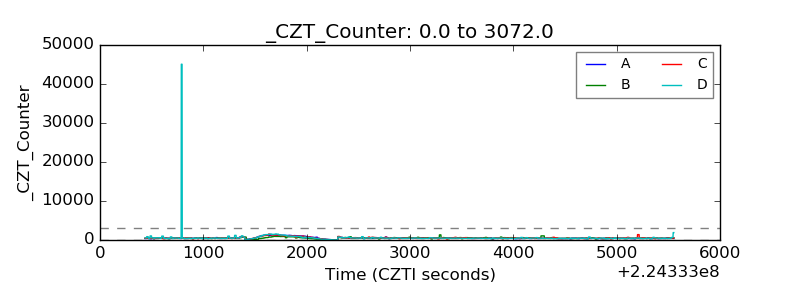 |
| +2.5 Volts monitor |  |
| +5 Volts monitor |  |
| _ROLL_ROT | 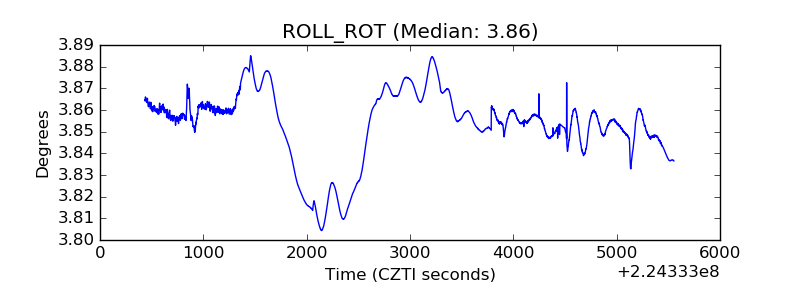 |
| _Roll_DEC | 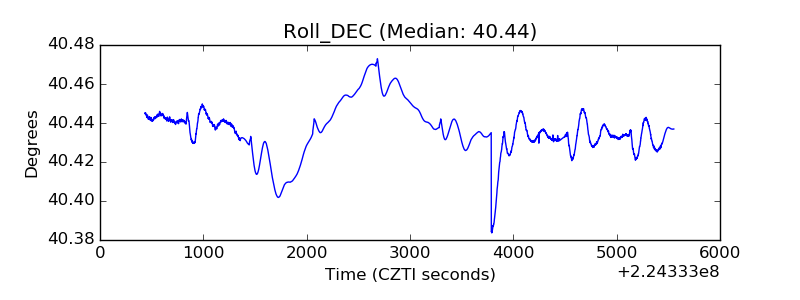 |
| _Roll_RA | 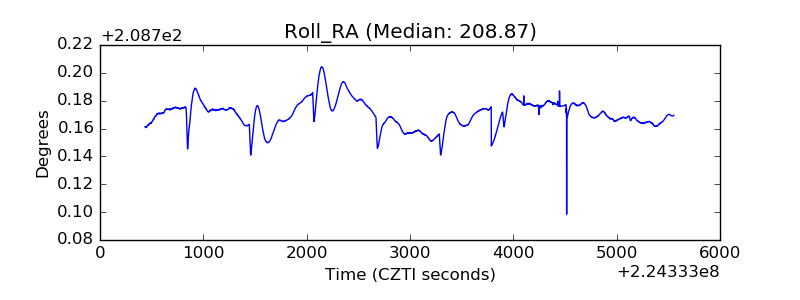 |
| Veto Counter | 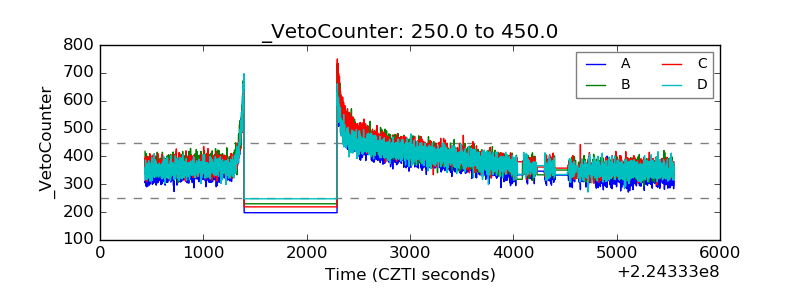 |