| Param | Original file | Final file |
|---|---|---|
| Filename | modeM0/AS1G06_138T01_9000001020_07414cztM0_level2.evt | modeM0/AS1G06_138T01_9000001020_07414cztM0_level2_quad_clean.evt |
| Size (bytes) | 391,596,480 | 69,217,920 |
| Size | 373.5 MB | 66.0 MB |
| Events in quadrant A | 2,667,251 | 420,169 |
| Events in quadrant B | 2,753,182 | 433,071 |
| Events in quadrant C | 2,629,185 | 427,829 |
| Events in quadrant D | 3,411,116 | 405,231 |
| Mode M0 | |||
|---|---|---|---|
| Quadrant | BADHDUFLAG | Total packets | Discarded packets |
| A | 0 | 12134 | 2 |
| B | 0 | 12247 | 1 |
| C | 0 | 12071 | 1 |
| D | 0 | 14092 | 1 |
| Mode M9 | |||
|---|---|---|---|
| Quadrant | BADHDUFLAG | Total packets | Discarded packets |
| A | 0 | 4 | 0 |
| B | 0 | 4 | 0 |
| C | 0 | 4 | 0 |
| D | 0 | 4 | 0 |
| Mode SS | |||
|---|---|---|---|
| Quadrant | BADHDUFLAG | Total packets | Discarded packets |
| A | 0 | 120 | 0 |
| B | 0 | 120 | 0 |
| C | 0 | 120 | 0 |
| D | 0 | 120 | 0 |
| Quadrant | Total seconds | Saturated seconds | Saturation percentage |
|---|---|---|---|
| A | 5856 | 48 | 0.819672% |
| B | 5856 | 86 | 1.468579% |
| C | 5856 | 25 | 0.426913% |
| D | 5856 | 111 | 1.895492% |
Noise dominated data is calculated using 1-second bins in cleaned event files. If a bin has >2000 counts, and if more than 50% of those come from <1% of pixels, then it is considered to be noise-dominated and hence unusable.
| Quadrant | # 1 sec bins | Bins with >0 counts | Bins with >2000 counts | High rate bins dominated by noise | Noise dominated (total time) | Noise dominated (detector-on time) | Marked lightcurve |
|---|---|---|---|---|---|---|---|
| A | 6286 | 5857 | 0 | 0 | 0.00% | 0.00% | 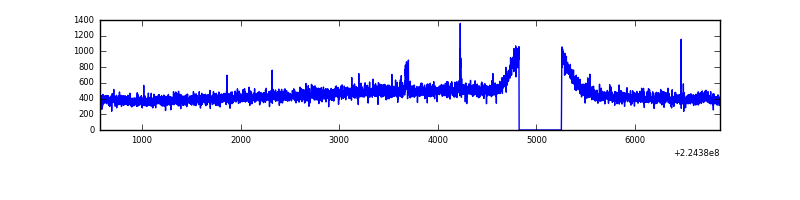 |
| B | 6286 | 5857 | 0 | 0 | 0.00% | 0.00% | 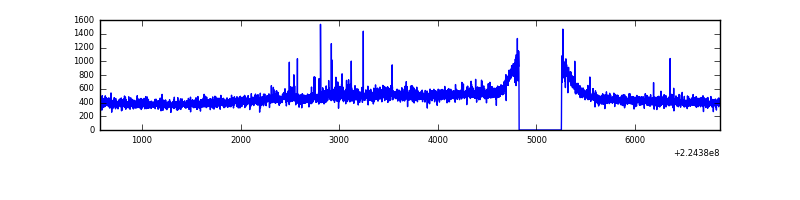 |
| C | 6286 | 5857 | 0 | 0 | 0.00% | 0.00% | 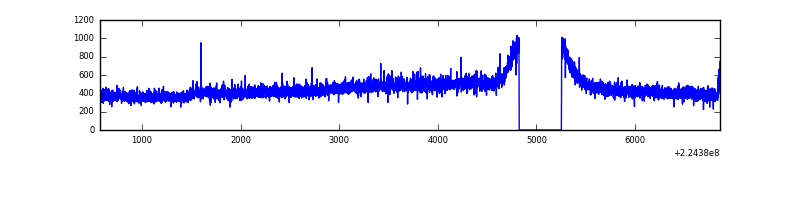 |
| D | 6286 | 5857 | 69 | 69 | 1.10% | 1.18% | 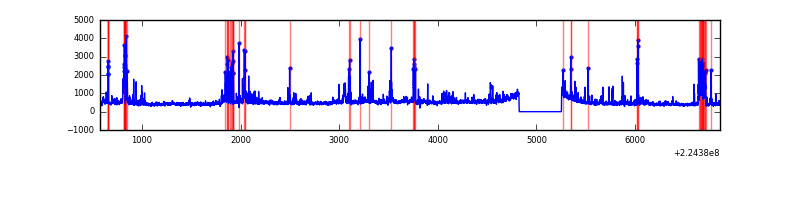 |
Top three noisy pixels from each quadrant. If the there are fewer than three noisy pixels in the level2.evt file, extra rows are filled as -1
| Pixel properties | Quadrant properties | ||||||
|---|---|---|---|---|---|---|---|
| Quadrant | DetID | PixID | Counts | Sigma | Mean | Median | Sigma |
| A | 15 | 234 | 12914 | 86.39 | 687 | 671 | 141.7 |
| A | 0 | 226 | 6569 | 41.62 | 687 | 671 | 141.7 |
| A | 12 | 194 | 6049 | 37.95 | 687 | 671 | 141.7 |
| B | 0 | 214 | 41130 | 299.81 | 695 | 678 | 134.9 |
| B | 12 | 111 | 14090 | 99.4 | 695 | 678 | 134.9 |
| B | 0 | 229 | 13626 | 95.96 | 695 | 678 | 134.9 |
| C | 14 | 205 | 7255 | 41.7 | 670 | 673 | 157.8 |
| C | 13 | 61 | 5231 | 28.88 | 670 | 673 | 157.8 |
| C | 9 | 68 | 3089 | 15.31 | 670 | 673 | 157.8 |
| D | 13 | 104 | 388137 | 2341.11 | 663 | 641 | 165.5 |
| D | 5 | 233 | 219374 | 1321.5 | 663 | 641 | 165.5 |
| D | 8 | 195 | 124230 | 746.68 | 663 | 641 | 165.5 |
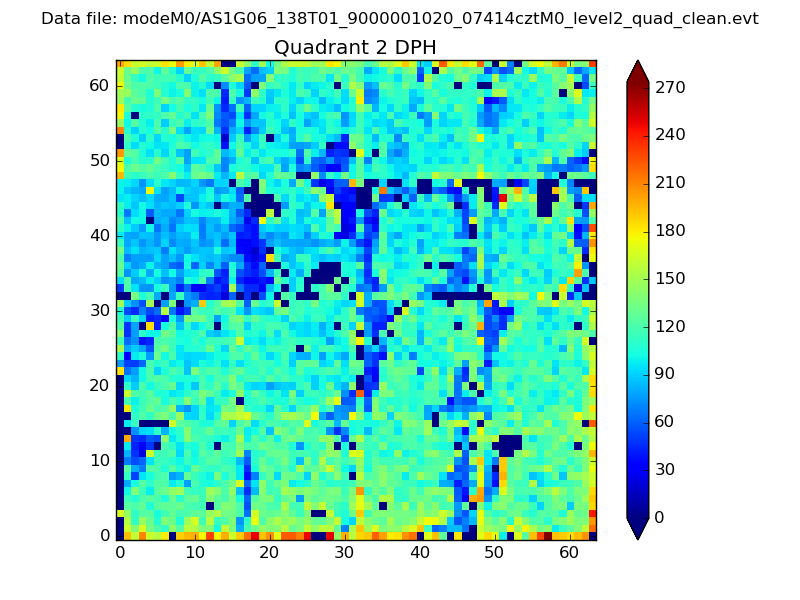
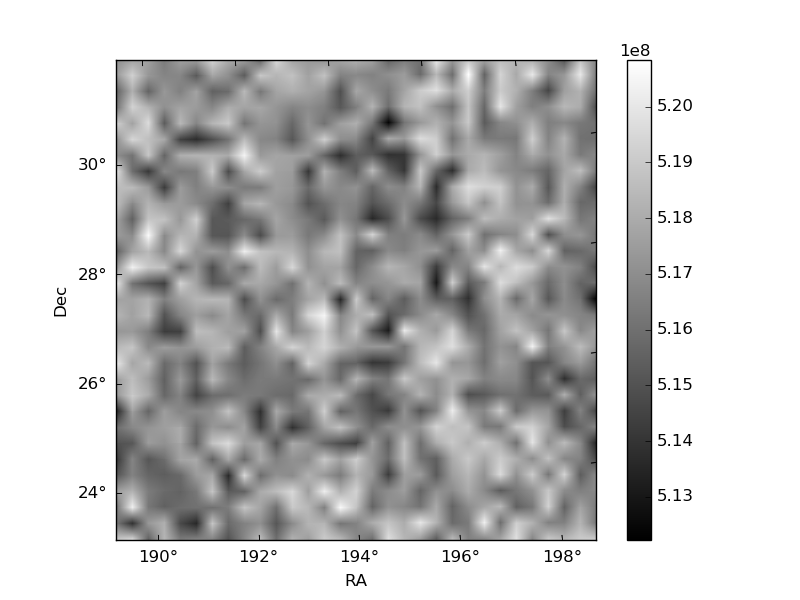
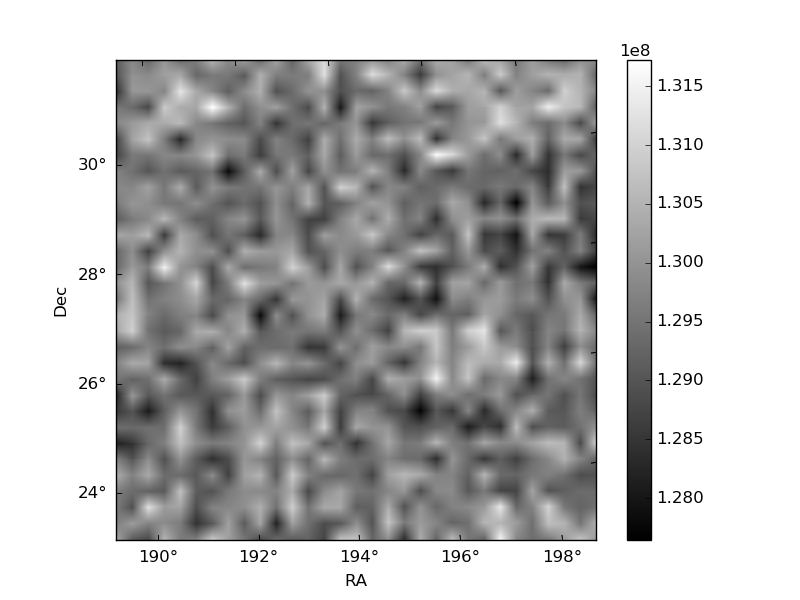
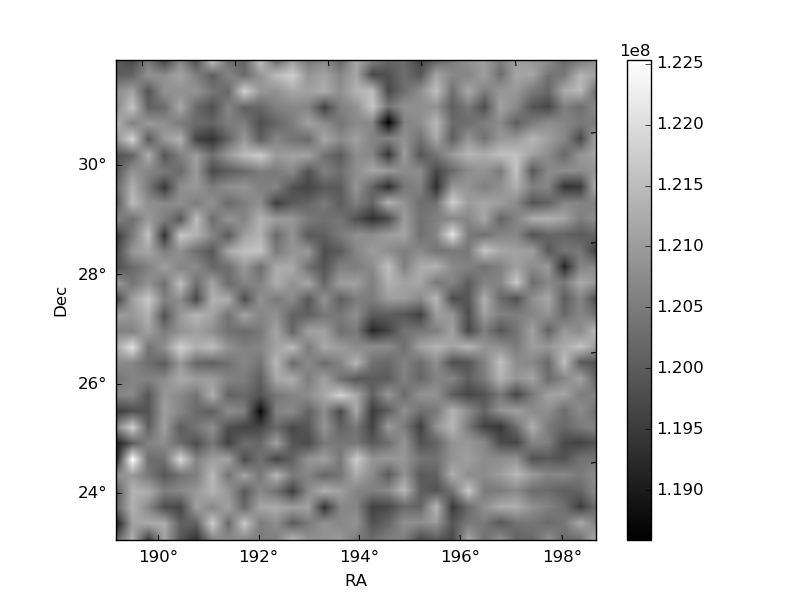
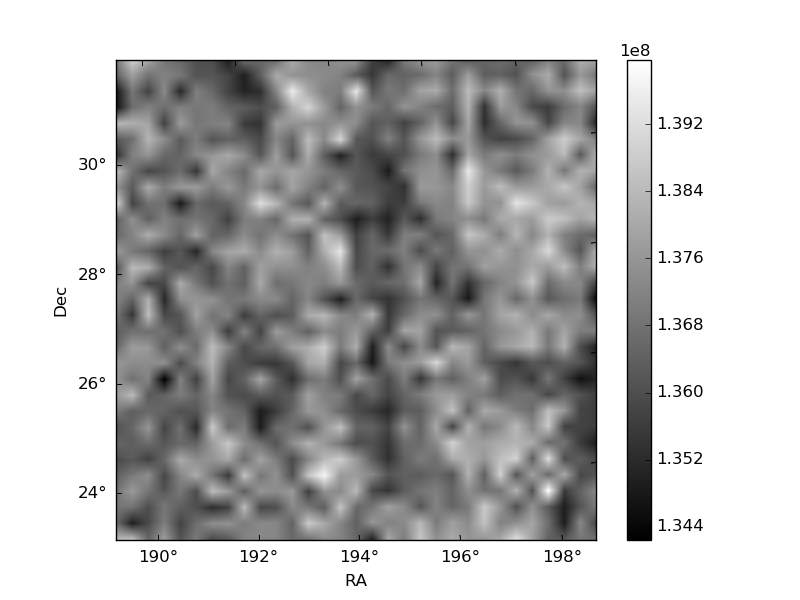
Histogram calculated using DETX and DETY for each event in the final _common_clean file
| Quadrant A | 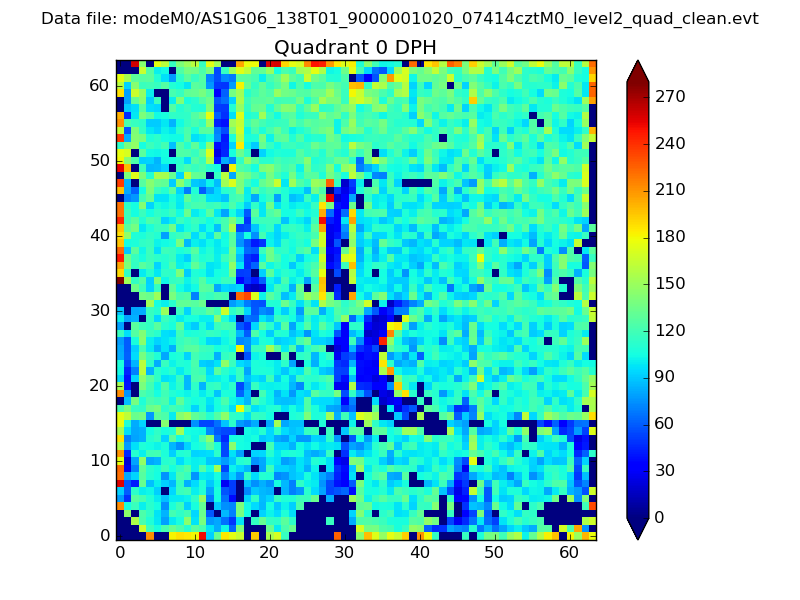 |
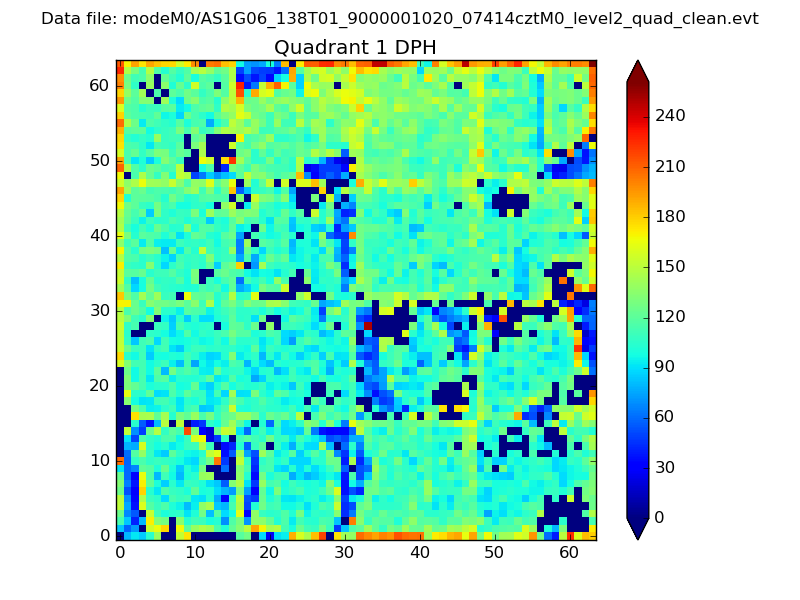 |
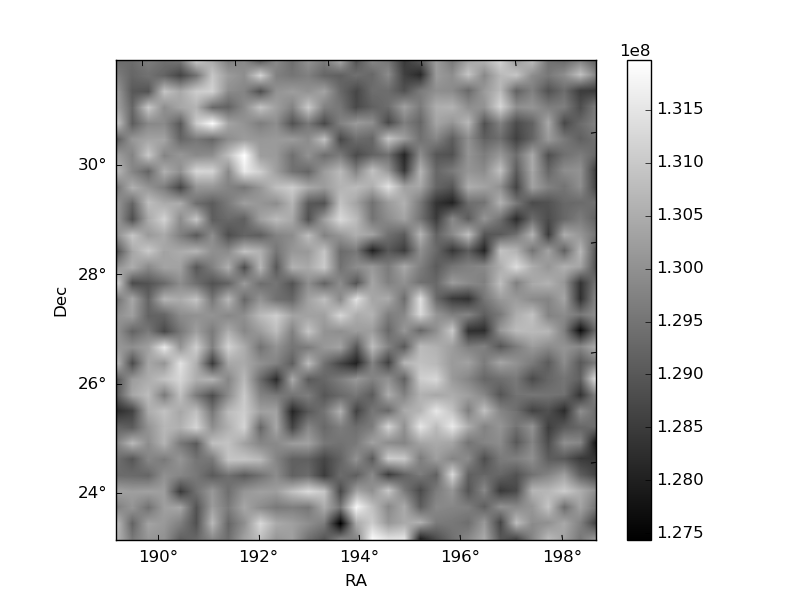
Quadrant B |
|---|---|---|---|
| Quadrant D | 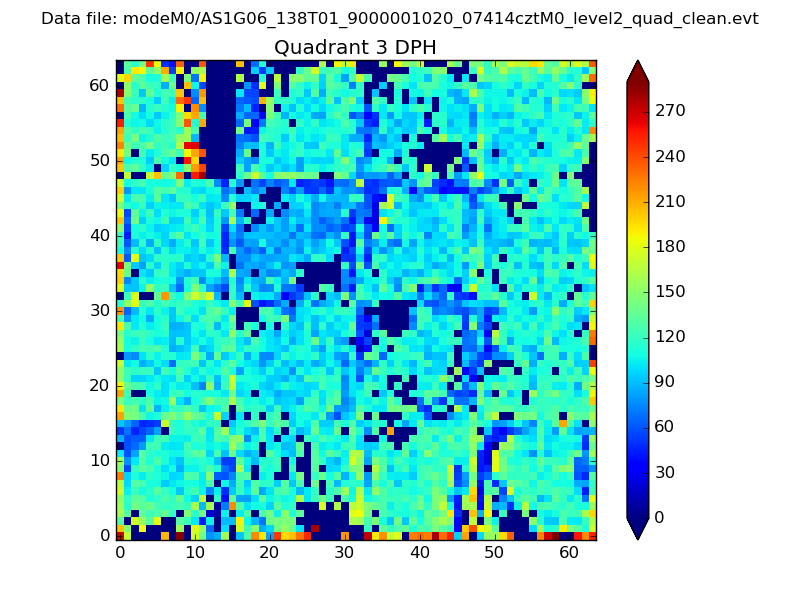 |
 |
Quadrant C |
| Plot type | Count rate plots | Images |
|---|---|---|
| Comparison with Poisson distribution Blue bars denote a histogram of data divided into 1 sec bins. Red curve is a Poisson curve with rate = median count rate of data. |
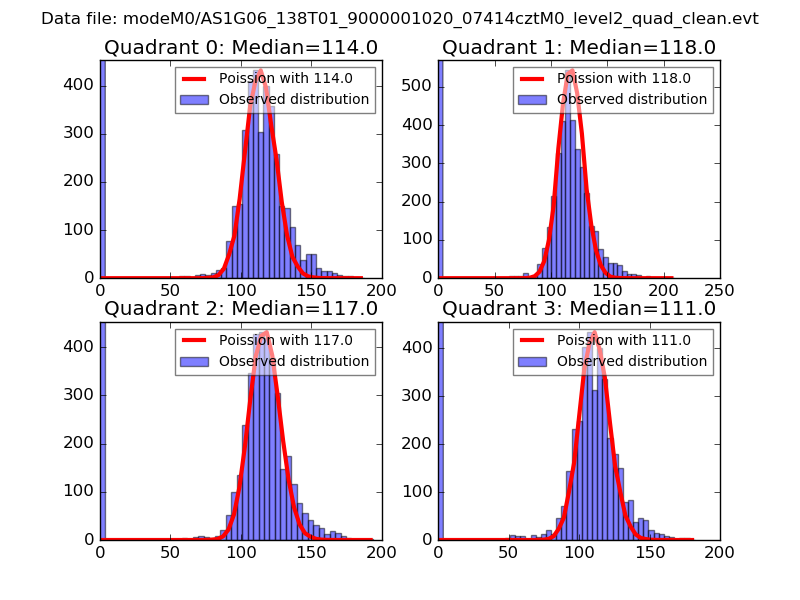 |
 |
| Quadrant-wise count rates Data is divided into 100 sec bins |
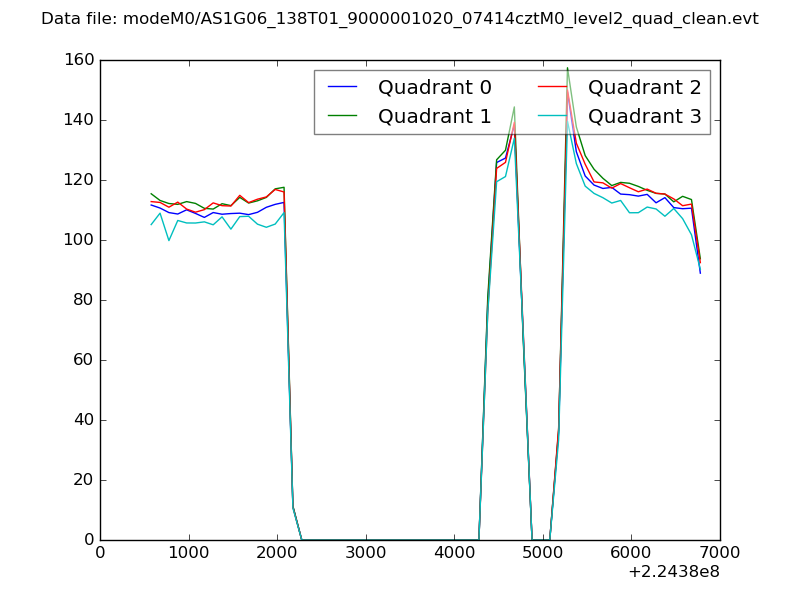 |
|
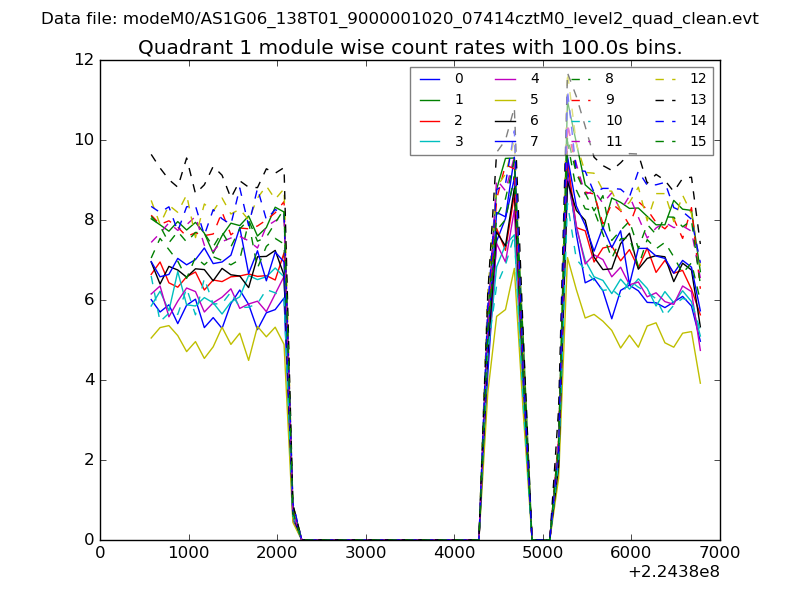
| Module-wise count rates for Quadrant A Data is divided into 100 sec bins |
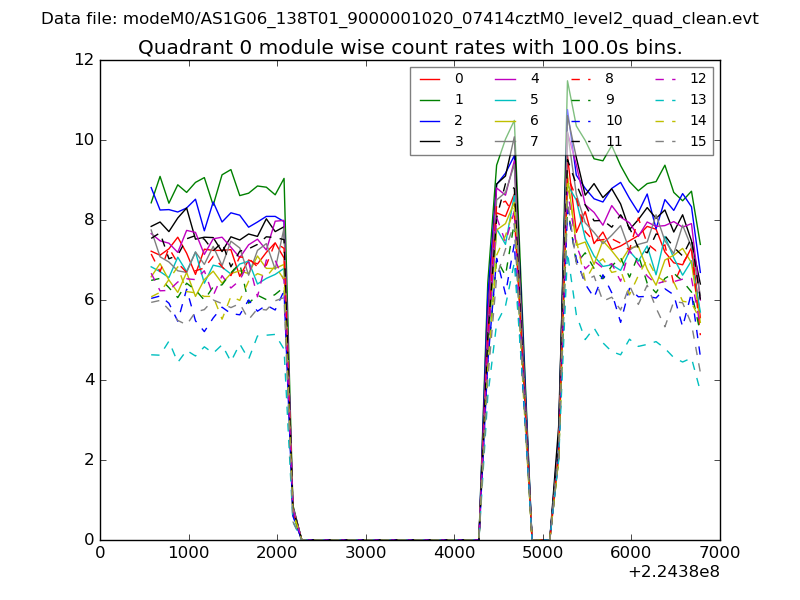 |
 |
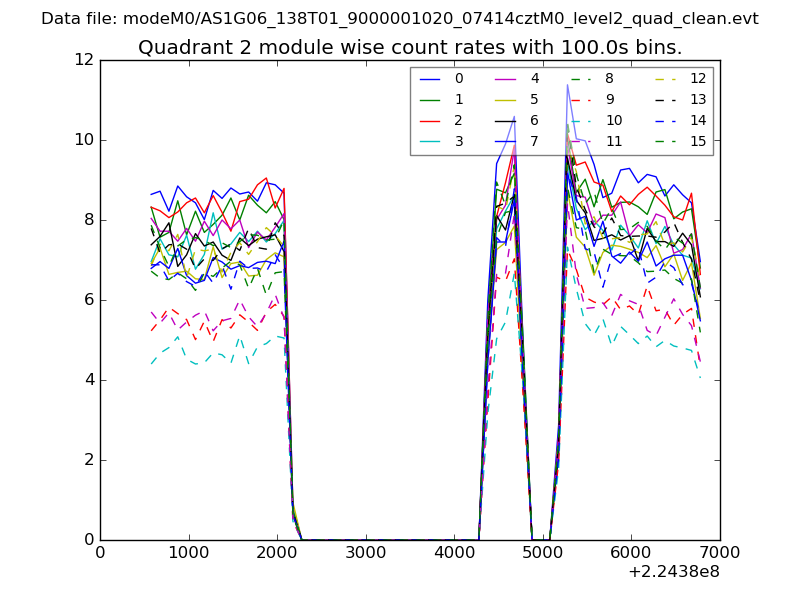
| Module-wise count rates for Quadrant B Data is divided into 100 sec bins |
 |
 |
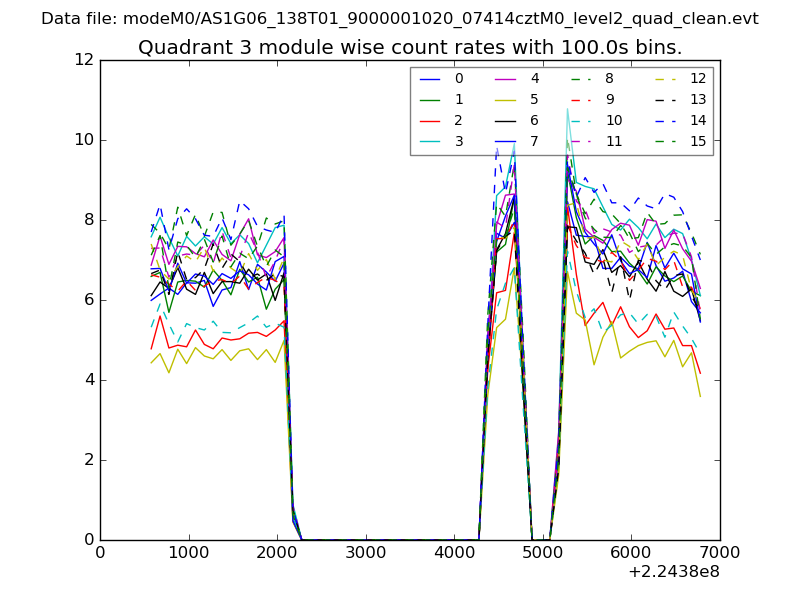
| Module-wise count rates for Quadrant C Data is divided into 100 sec bins |
 |
 |
| Module-wise count rates for Quadrant D Data is divided into 100 sec bins |
 |
 |
| Parameter | Plot |
|---|---|
| CZT HV Monitor | 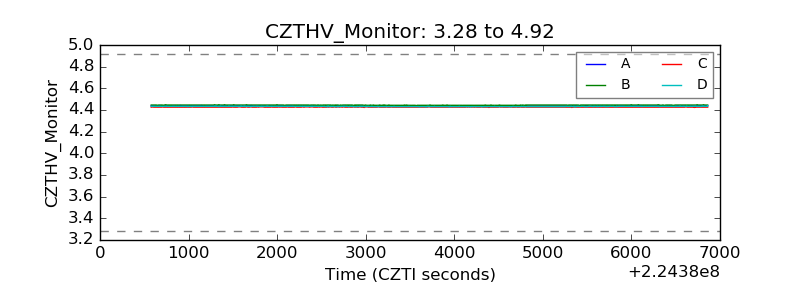 |
| D_VDD | 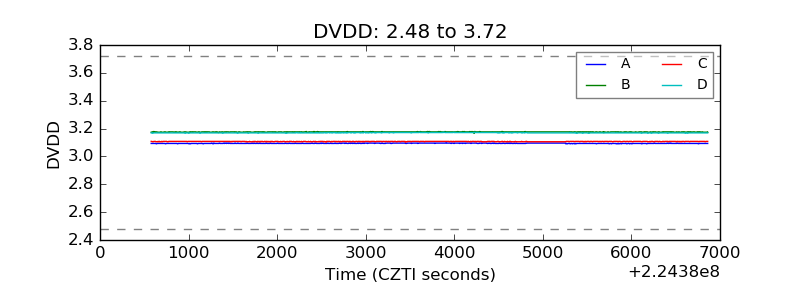 |
| Temperature 1 | 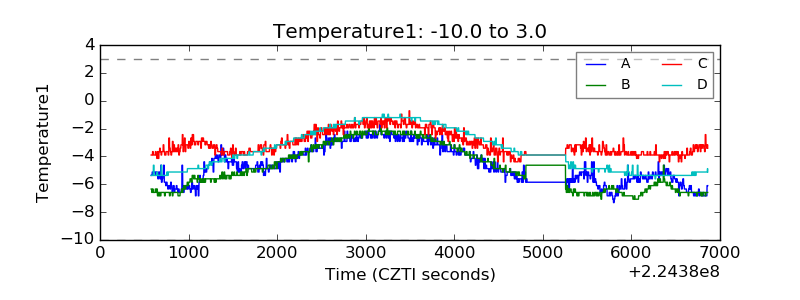 |
| Veto HV Monitor | 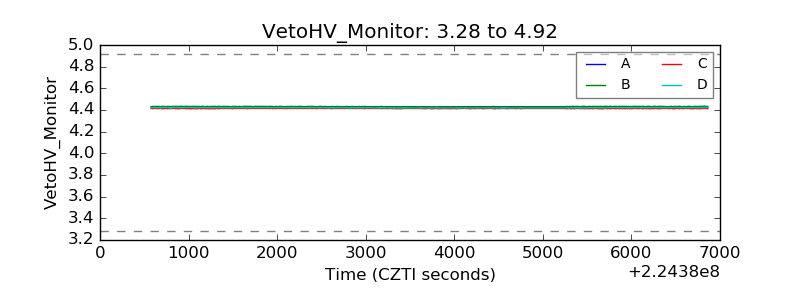 |
| Veto LLD | 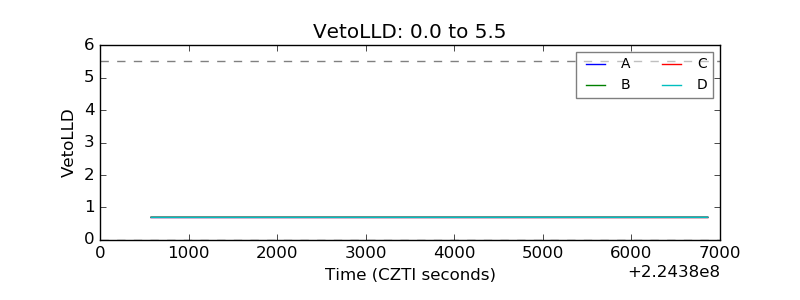 |
| Alpha Counter | 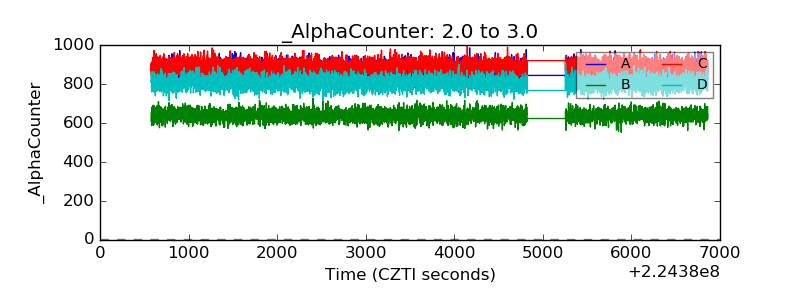 |
| _CPM_Rate | 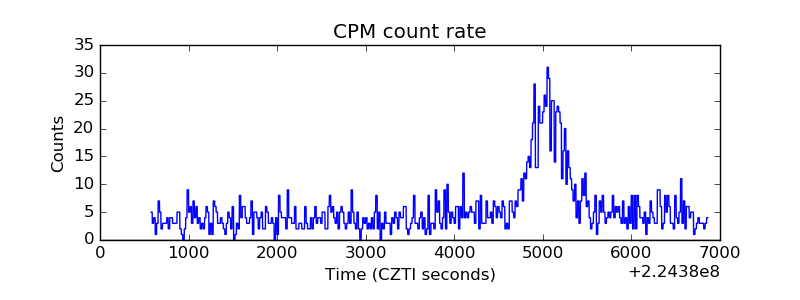 |
| CZT Counter |  |
| +2.5 Volts monitor |  |
| +5 Volts monitor |  |
| _ROLL_ROT | 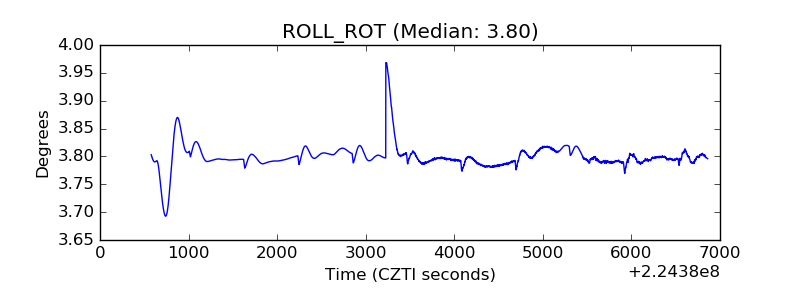 |
| _Roll_DEC | 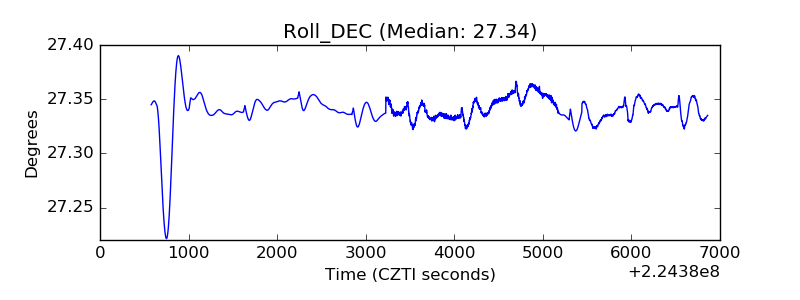 |
| _Roll_RA |  |
| Veto Counter | 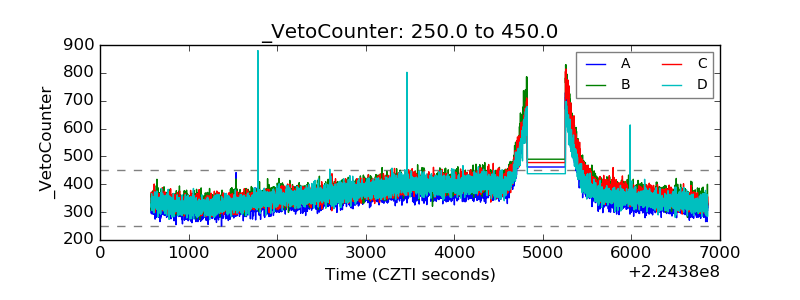 |