| Param | Original file | Final file |
|---|---|---|
| Filename | modeM0/AS1G06_138T01_9000001020_07419cztM0_level2.evt | modeM0/AS1G06_138T01_9000001020_07419cztM0_level2_quad_clean.evt |
| Size (bytes) | 572,477,760 | 92,571,840 |
| Size | 546.0 MB | 88.3 MB |
| Events in quadrant A | 3,822,587 | 549,444 |
| Events in quadrant B | 4,061,517 | 564,873 |
| Events in quadrant C | 4,648,080 | 554,098 |
| Events in quadrant D | 4,216,060 | 532,123 |
| Mode M0 | |||
|---|---|---|---|
| Quadrant | BADHDUFLAG | Total packets | Discarded packets |
| A | 0 | 17574 | 2 |
| B | 0 | 17911 | 5 |
| C | 0 | 19240 | 1 |
| D | 0 | 18652 | 3 |
| Mode M9 | |||
|---|---|---|---|
| Quadrant | BADHDUFLAG | Total packets | Discarded packets |
| A | 0 | 4 | 0 |
| B | 0 | 4 | 0 |
| C | 0 | 4 | 0 |
| D | 0 | 4 | 0 |
| Mode SS | |||
|---|---|---|---|
| Quadrant | BADHDUFLAG | Total packets | Discarded packets |
| A | 0 | 176 | 0 |
| B | 0 | 176 | 0 |
| C | 0 | 176 | 0 |
| D | 0 | 176 | 0 |
| Quadrant | Total seconds | Saturated seconds | Saturation percentage |
|---|---|---|---|
| A | 8678 | 103 | 1.186909% |
| B | 8676 | 111 | 1.279391% |
| C | 8678 | 74 | 0.852731% |
| D | 8677 | 147 | 1.694134% |
Noise dominated data is calculated using 1-second bins in cleaned event files. If a bin has >2000 counts, and if more than 50% of those come from <1% of pixels, then it is considered to be noise-dominated and hence unusable.
| Quadrant | # 1 sec bins | Bins with >0 counts | Bins with >2000 counts | High rate bins dominated by noise | Noise dominated (total time) | Noise dominated (detector-on time) | Marked lightcurve |
|---|---|---|---|---|---|---|---|
| A | 9113 | 8679 | 0 | 0 | 0.00% | 0.00% | 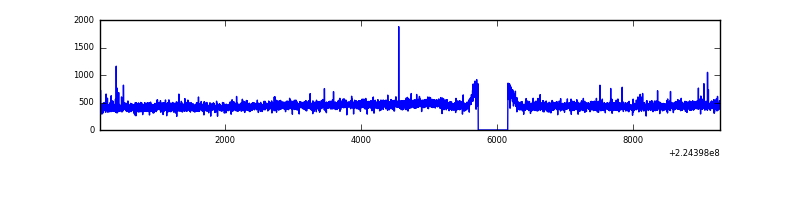 |
| B | 9113 | 8679 | 11 | 11 | 0.12% | 0.13% | 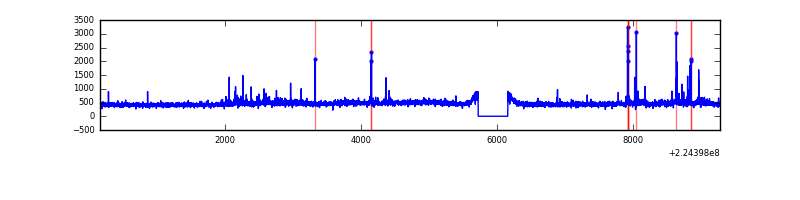 |
| C | 9113 | 8679 | 0 | 0 | 0.00% | 0.00% | 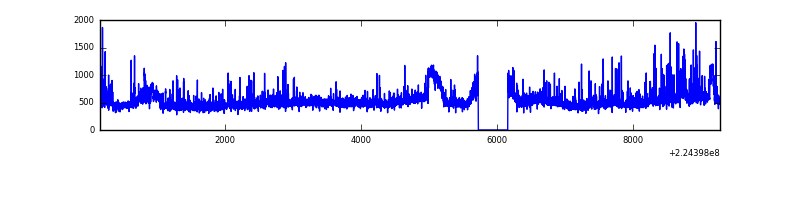 |
| D | 9113 | 8679 | 45 | 45 | 0.49% | 0.52% | 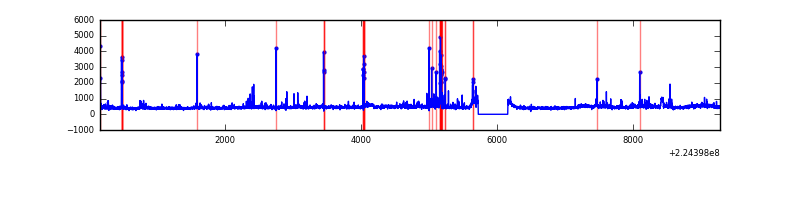 |
Top three noisy pixels from each quadrant. If the there are fewer than three noisy pixels in the level2.evt file, extra rows are filled as -1
| Pixel properties | Quadrant properties | ||||||
|---|---|---|---|---|---|---|---|
| Quadrant | DetID | PixID | Counts | Sigma | Mean | Median | Sigma |
| A | 0 | 226 | 9686 | 42.67 | 988 | 966 | 204.3 |
| A | 12 | 194 | 8578 | 37.25 | 988 | 966 | 204.3 |
| A | 15 | 239 | 7300 | 31.0 | 988 | 966 | 204.3 |
| B | 0 | 214 | 176146 | 913.8 | 992 | 965 | 191.7 |
| B | 12 | 111 | 19874 | 98.64 | 992 | 965 | 191.7 |
| B | 11 | 111 | 15935 | 78.09 | 992 | 965 | 191.7 |
| C | 9 | 68 | 881125 | 3942.76 | 954 | 956 | 223.2 |
| C | 8 | 128 | 13461 | 56.02 | 954 | 956 | 223.2 |
| C | 10 | 22 | 10654 | 43.44 | 954 | 956 | 223.2 |
| D | 2 | 14 | 156116 | 658.83 | 957 | 924 | 235.6 |
| D | 8 | 195 | 151627 | 639.78 | 957 | 924 | 235.6 |
| D | 13 | 105 | 92076 | 386.96 | 957 | 924 | 235.6 |
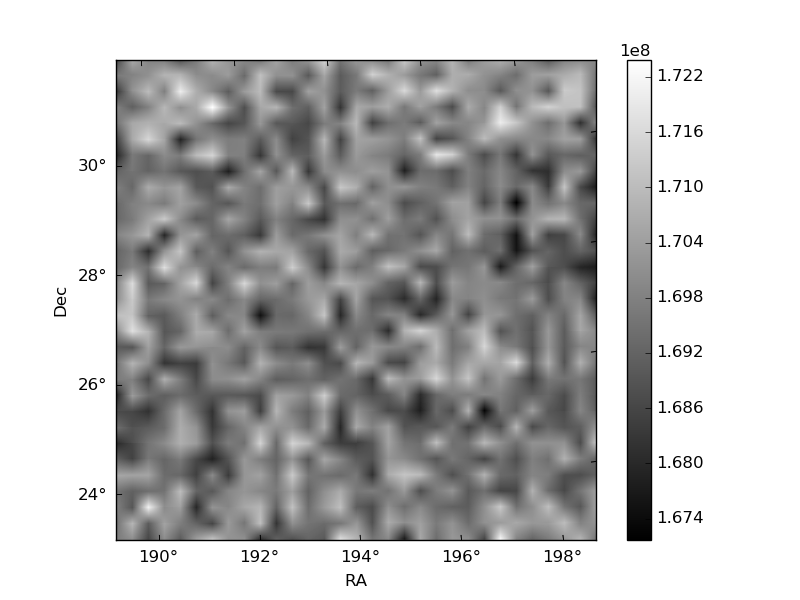
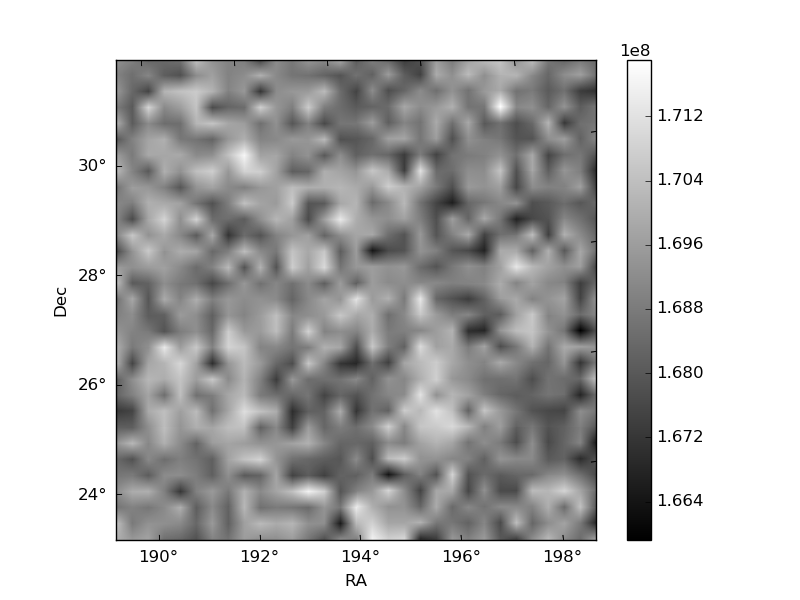
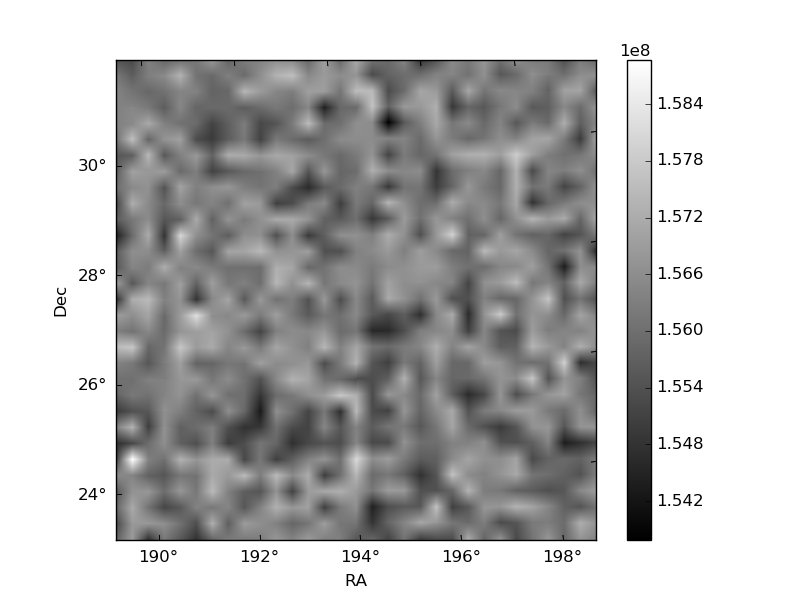
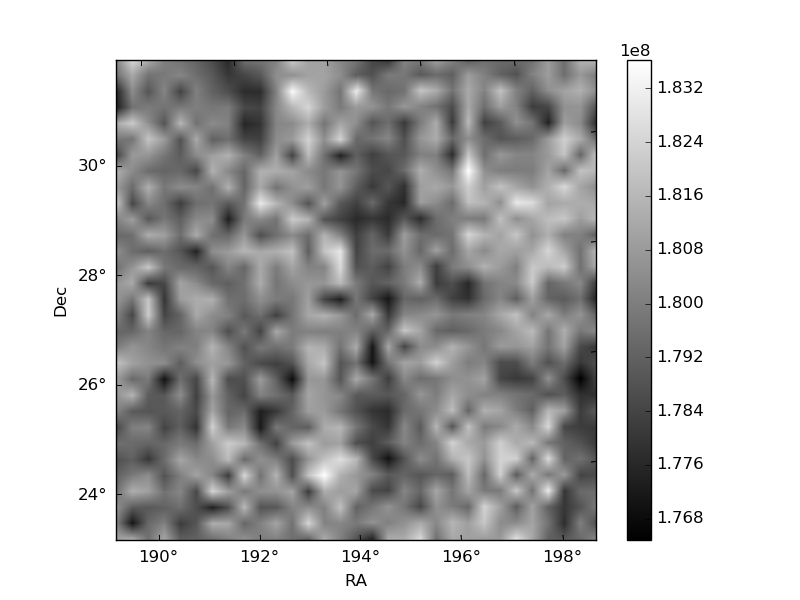
Histogram calculated using DETX and DETY for each event in the final _common_clean file
| Quadrant A | 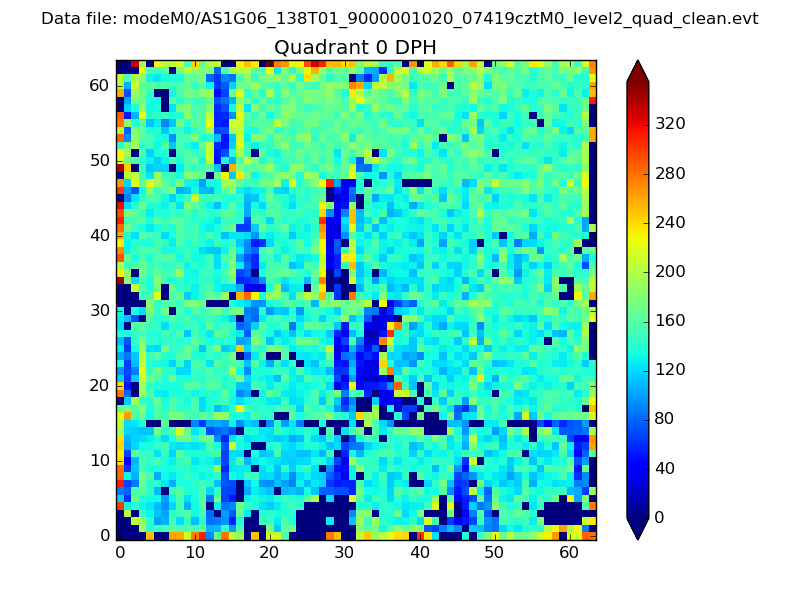 |
 |
Quadrant B |
|---|---|---|---|
| Quadrant D | 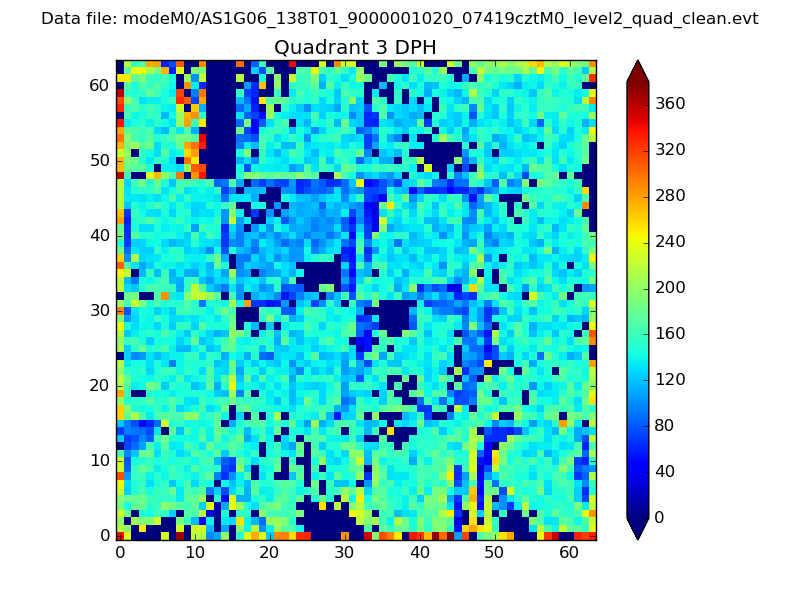 |
 |
Quadrant C |
| Plot type | Count rate plots | Images |
|---|---|---|
| Comparison with Poisson distribution Blue bars denote a histogram of data divided into 1 sec bins. Red curve is a Poisson curve with rate = median count rate of data. |
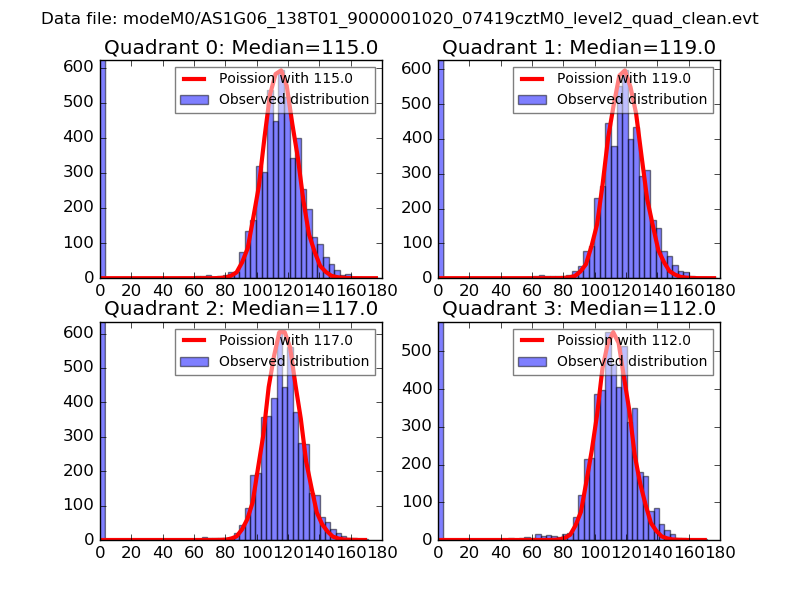 |
 |
| Quadrant-wise count rates Data is divided into 100 sec bins |
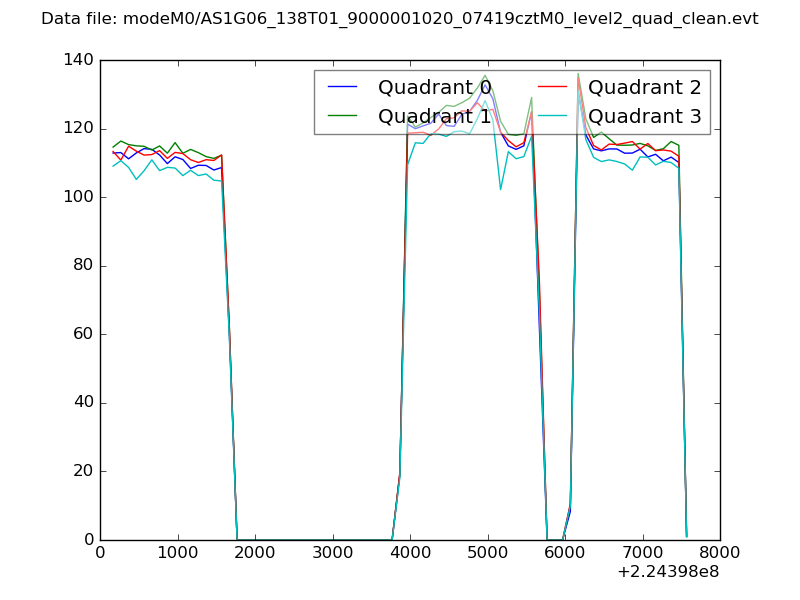 |
|
| Module-wise count rates for Quadrant A Data is divided into 100 sec bins |
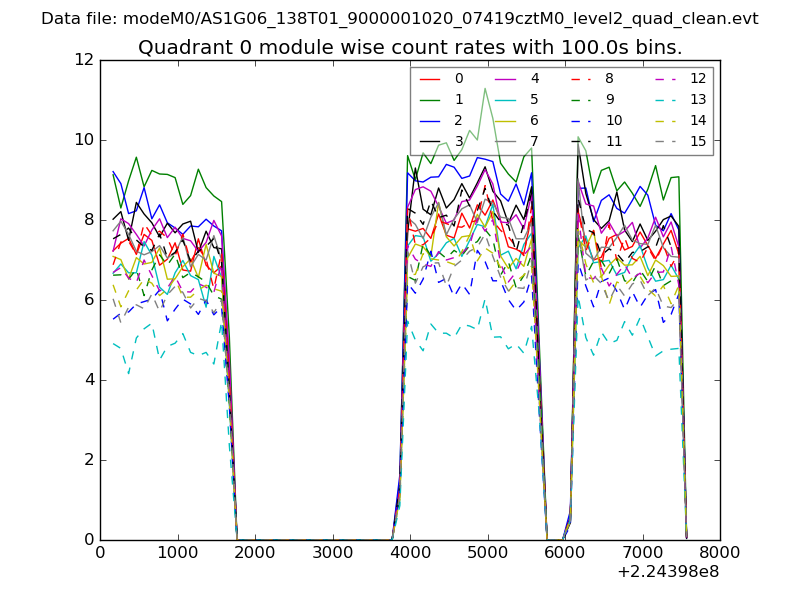 |
 |
| Module-wise count rates for Quadrant B Data is divided into 100 sec bins |
 |
 |
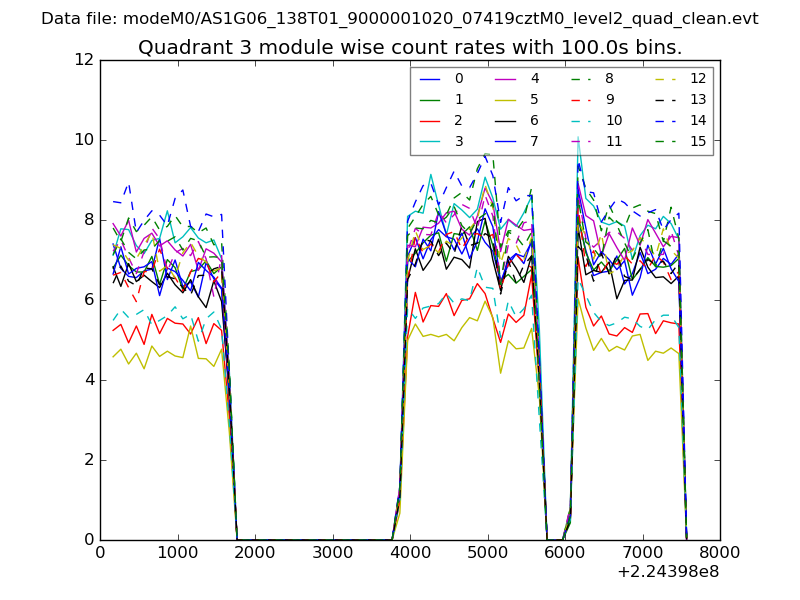
| Module-wise count rates for Quadrant C Data is divided into 100 sec bins |
 |
 |
| Module-wise count rates for Quadrant D Data is divided into 100 sec bins |
 |
 |
| Parameter | Plot |
|---|---|
| CZT HV Monitor |  |
| D_VDD | 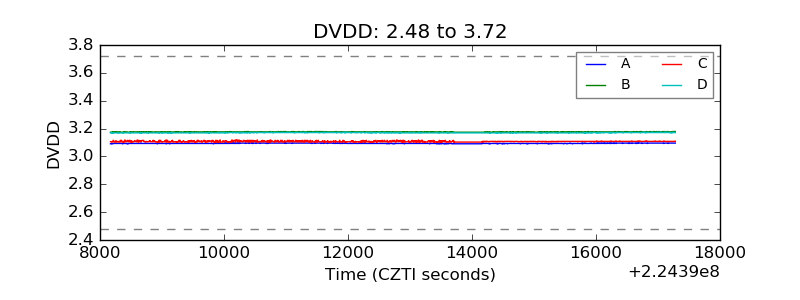 |
| Temperature 1 | 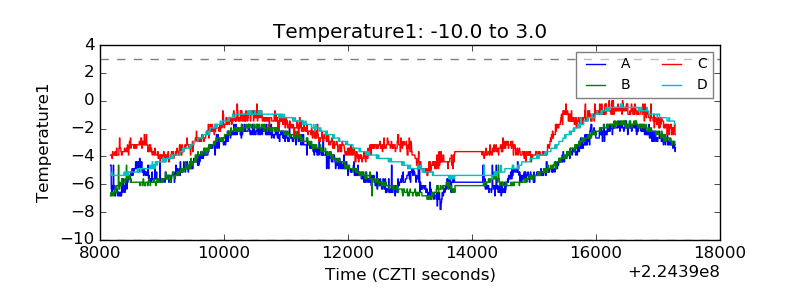 |
| Veto HV Monitor | 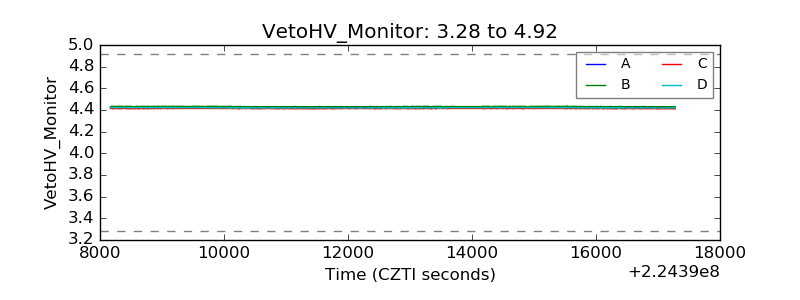 |
| Veto LLD | 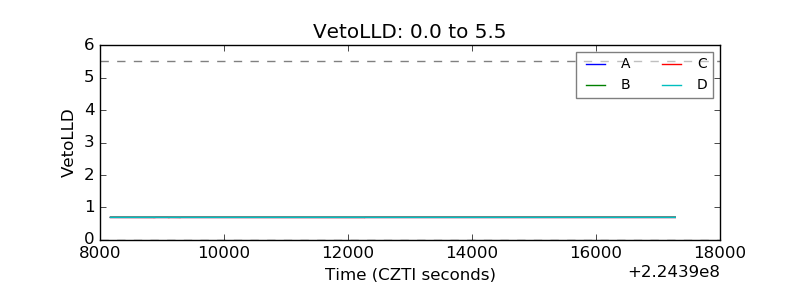 |
| Alpha Counter |  |
| _CPM_Rate | 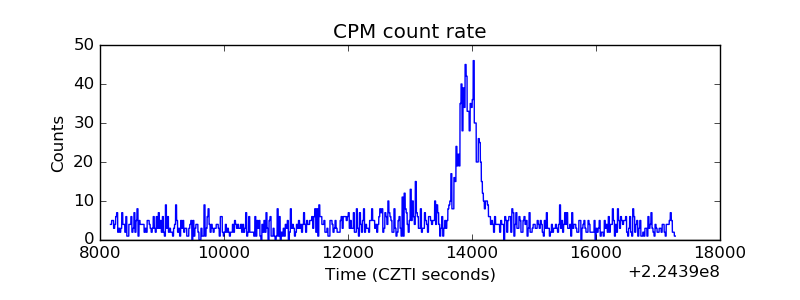 |
| CZT Counter |  |
| +2.5 Volts monitor |  |
| +5 Volts monitor |  |
| _ROLL_ROT | 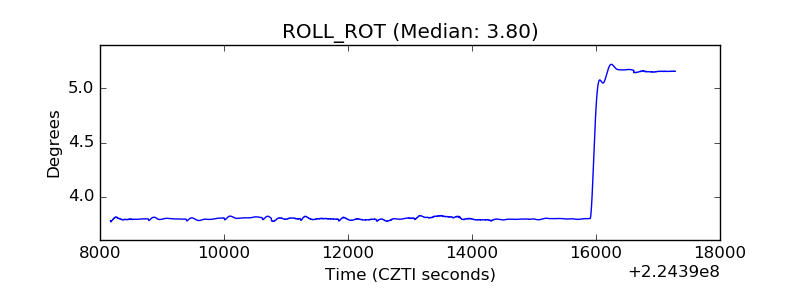 |
| _Roll_DEC | 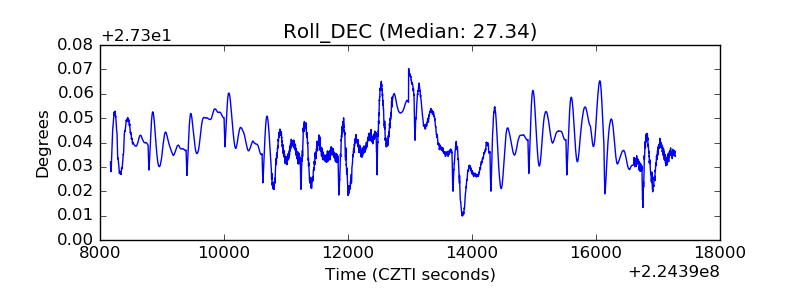 |
| _Roll_RA | 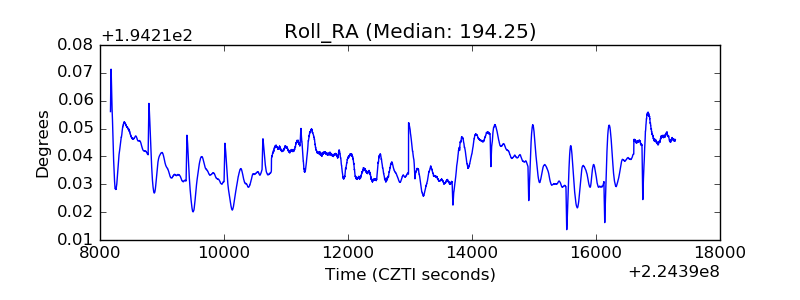 |
| Veto Counter | 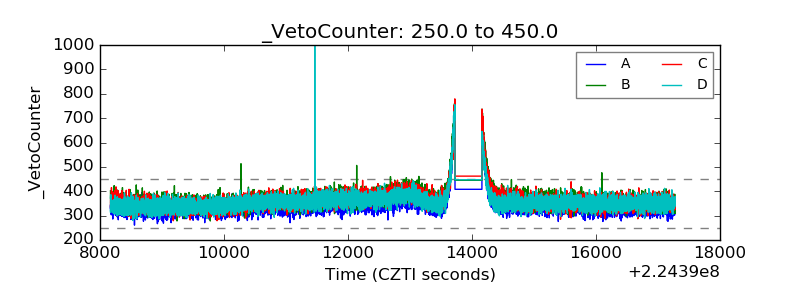 |