| Param | Original file | Final file |
|---|---|---|
| Filename | modeM0/AS1G06_138T01_9000001020_07420cztM0_level2.evt | modeM0/AS1G06_138T01_9000001020_07420cztM0_level2_quad_clean.evt |
| Size (bytes) | 1,053,023,040 | 168,148,800 |
| Size | 1004.2 MB | 160.4 MB |
| Events in quadrant A | 6,999,795 | 1,020,077 |
| Events in quadrant B | 7,263,477 | 1,035,607 |
| Events in quadrant C | 8,453,490 | 1,019,183 |
| Events in quadrant D | 8,155,610 | 978,047 |
| Mode M0 | |||
|---|---|---|---|
| Quadrant | BADHDUFLAG | Total packets | Discarded packets |
| A | 0 | 30862 | 3 |
| B | 0 | 31260 | 2 |
| C | 0 | 34538 | 2 |
| D | 0 | 34401 | 2 |
| Mode M9 | |||
|---|---|---|---|
| Quadrant | BADHDUFLAG | Total packets | Discarded packets |
| A | 0 | 25 | 0 |
| B | 0 | 25 | 0 |
| C | 0 | 25 | 0 |
| D | 0 | 25 | 0 |
| Mode SS | |||
|---|---|---|---|
| Quadrant | BADHDUFLAG | Total packets | Discarded packets |
| A | 0 | 306 | 0 |
| B | 0 | 306 | 0 |
| C | 0 | 306 | 0 |
| D | 0 | 306 | 0 |
| Quadrant | Total seconds | Saturated seconds | Saturation percentage |
|---|---|---|---|
| A | 15063 | 212 | 1.407422% |
| B | 15063 | 193 | 1.281285% |
| C | 15063 | 174 | 1.155148% |
| D | 15063 | 382 | 2.536015% |
Noise dominated data is calculated using 1-second bins in cleaned event files. If a bin has >2000 counts, and if more than 50% of those come from <1% of pixels, then it is considered to be noise-dominated and hence unusable.
| Quadrant | # 1 sec bins | Bins with >0 counts | Bins with >2000 counts | High rate bins dominated by noise | Noise dominated (total time) | Noise dominated (detector-on time) | Marked lightcurve |
|---|---|---|---|---|---|---|---|
| A | 17443 | 15064 | 3 | 3 | 0.02% | 0.02% | 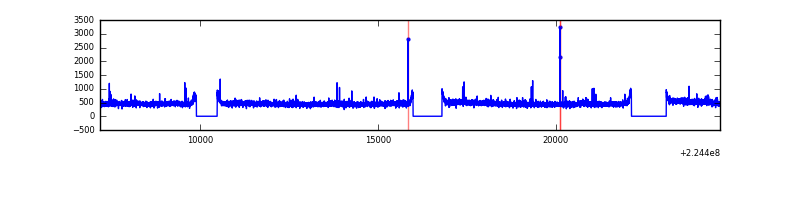 |
| B | 17443 | 15064 | 5 | 5 | 0.03% | 0.03% | 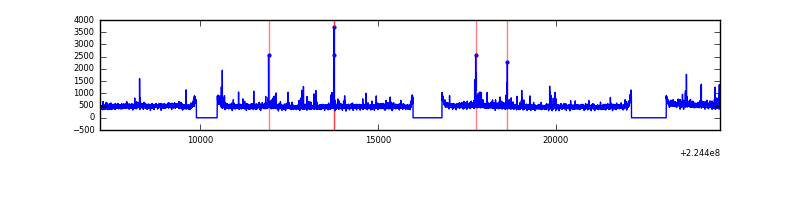 |
| C | 17443 | 15065 | 4 | 4 | 0.02% | 0.03% | 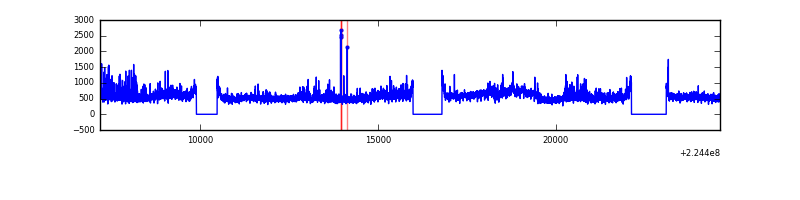 |
| D | 17443 | 15065 | 173 | 173 | 0.99% | 1.15% | 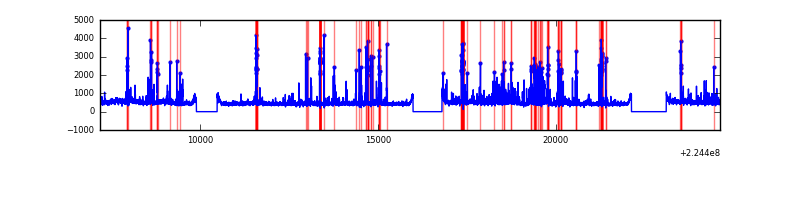 |
Top three noisy pixels from each quadrant. If the there are fewer than three noisy pixels in the level2.evt file, extra rows are filled as -1
| Pixel properties | Quadrant properties | ||||||
|---|---|---|---|---|---|---|---|
| Quadrant | DetID | PixID | Counts | Sigma | Mean | Median | Sigma |
| A | 13 | 251 | 72606 | 194.93 | 1790 | 1750 | 363.5 |
| A | 3 | 1 | 18296 | 45.52 | 1790 | 1750 | 363.5 |
| A | 0 | 226 | 16916 | 41.72 | 1790 | 1750 | 363.5 |
| B | 0 | 214 | 164245 | 469.35 | 1803 | 1759 | 346.2 |
| B | 12 | 111 | 35488 | 97.43 | 1803 | 1759 | 346.2 |
| B | 4 | 81 | 32289 | 88.19 | 1803 | 1759 | 346.2 |
| C | 9 | 68 | 1635029 | 4024.45 | 1741 | 1746 | 405.8 |
| C | 12 | 4 | 28520 | 65.97 | 1741 | 1746 | 405.8 |
| C | 13 | 61 | 13681 | 29.41 | 1741 | 1746 | 405.8 |
| D | 2 | 14 | 452983 | 1061.9 | 1732 | 1679 | 425.0 |
| D | 2 | 216 | 398040 | 932.62 | 1732 | 1679 | 425.0 |
| D | 8 | 195 | 290396 | 679.34 | 1732 | 1679 | 425.0 |
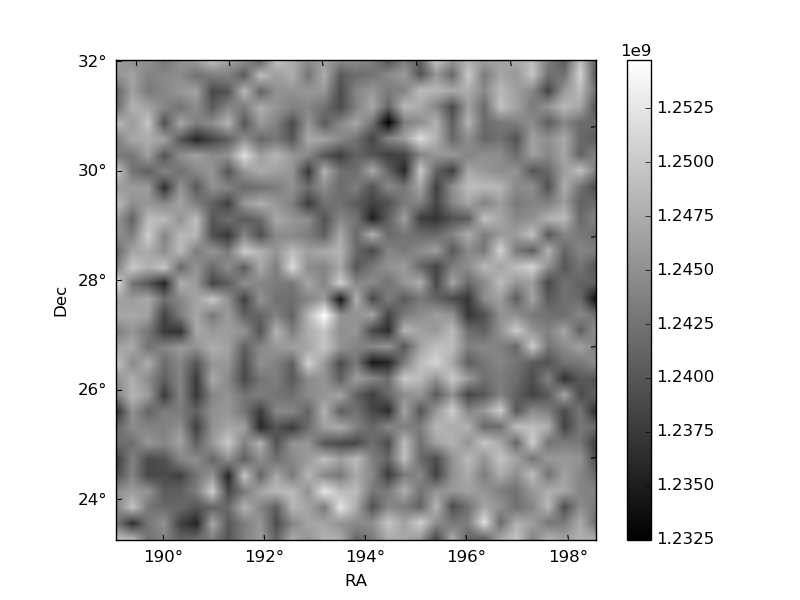
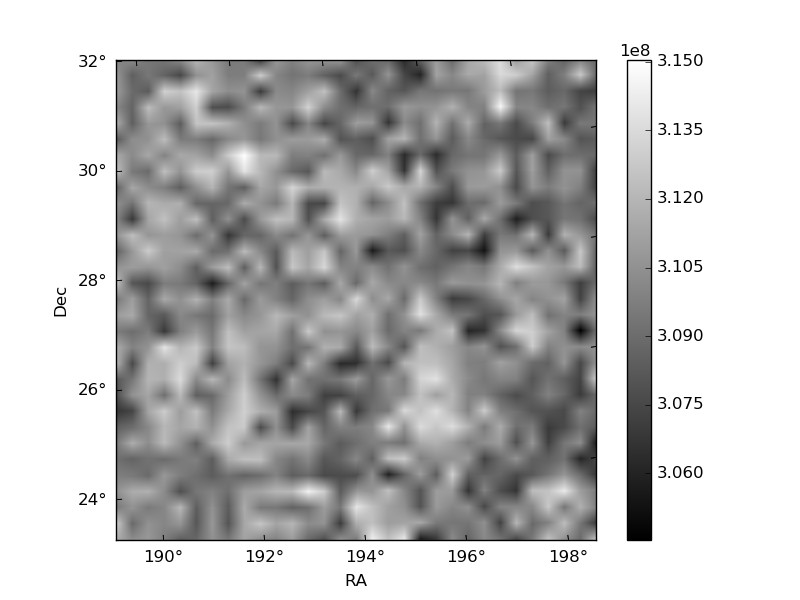
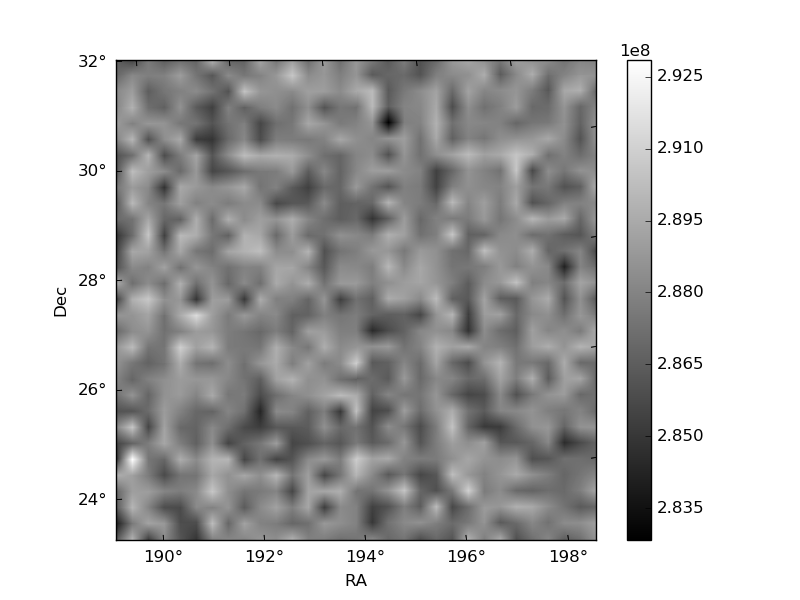
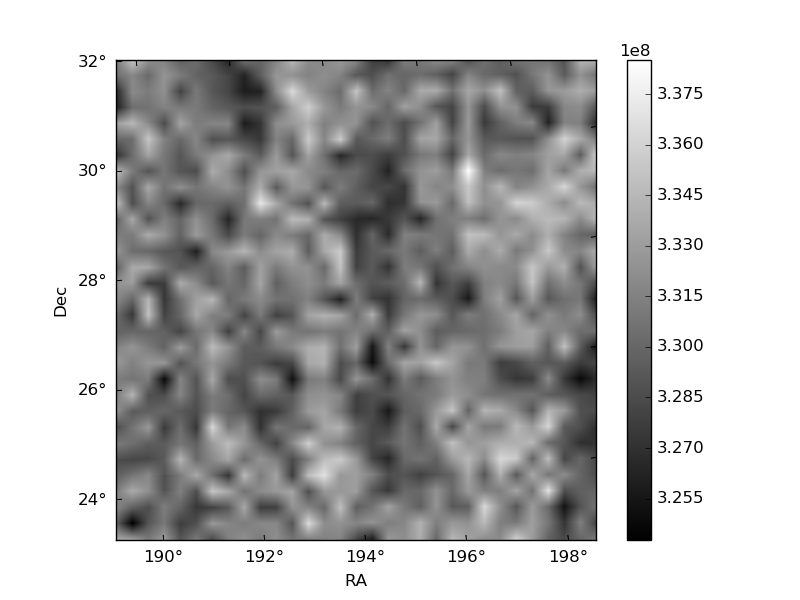
Histogram calculated using DETX and DETY for each event in the final _common_clean file
| Quadrant A | 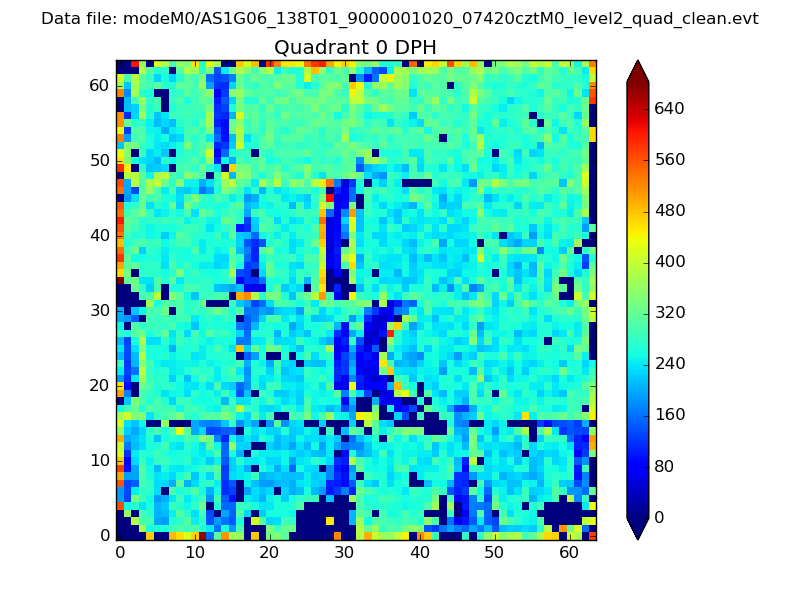 |
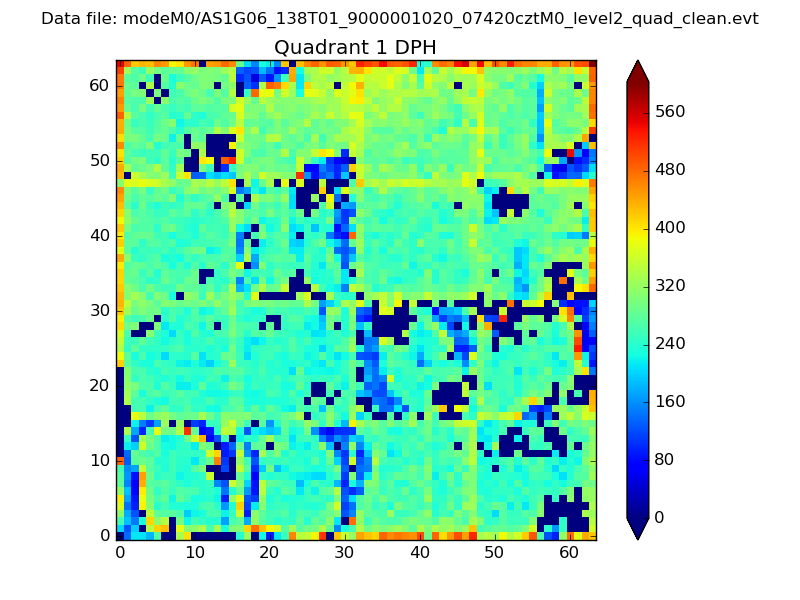 |
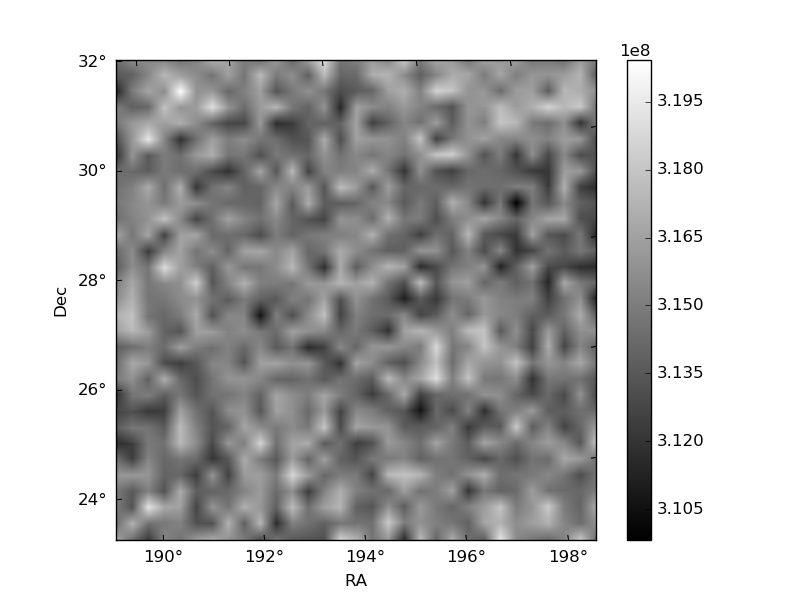
Quadrant B |
|---|---|---|---|
| Quadrant D | 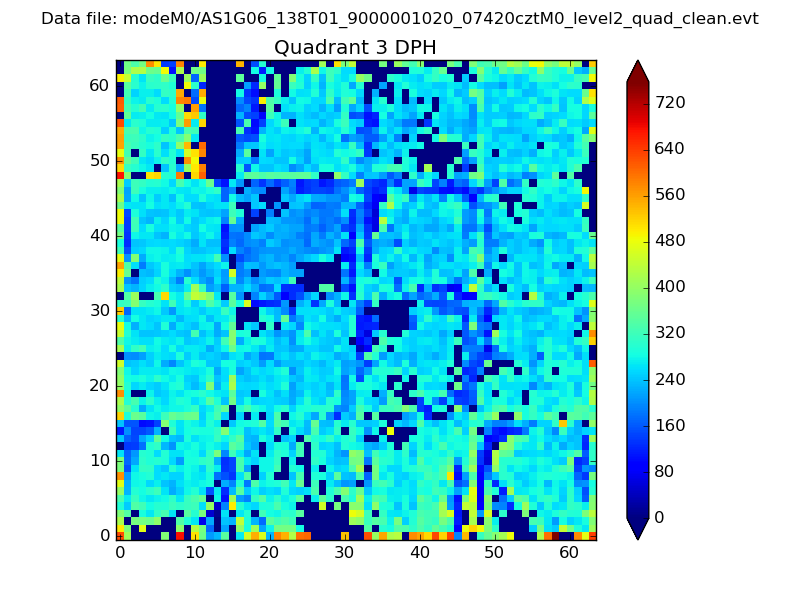 |
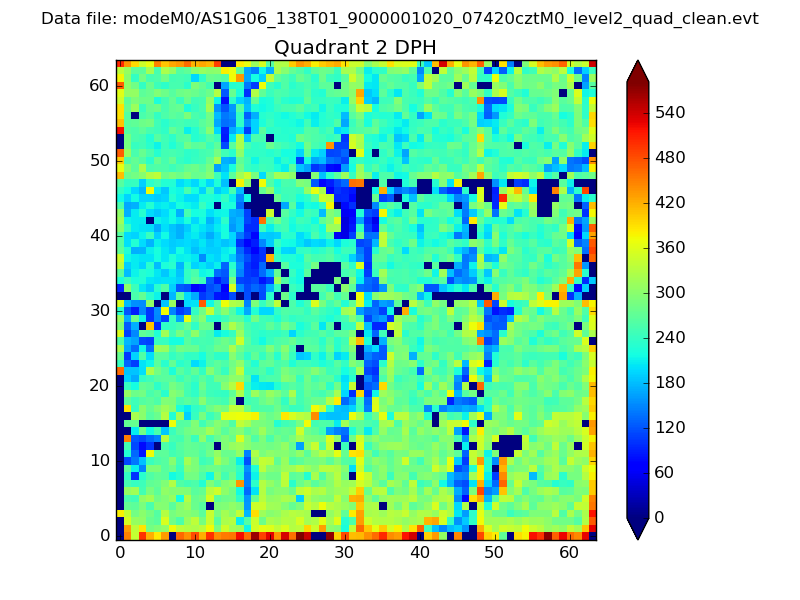 |
Quadrant C |
| Plot type | Count rate plots | Images |
|---|---|---|
| Comparison with Poisson distribution Blue bars denote a histogram of data divided into 1 sec bins. Red curve is a Poisson curve with rate = median count rate of data. |
 |
 |
| Quadrant-wise count rates Data is divided into 100 sec bins |
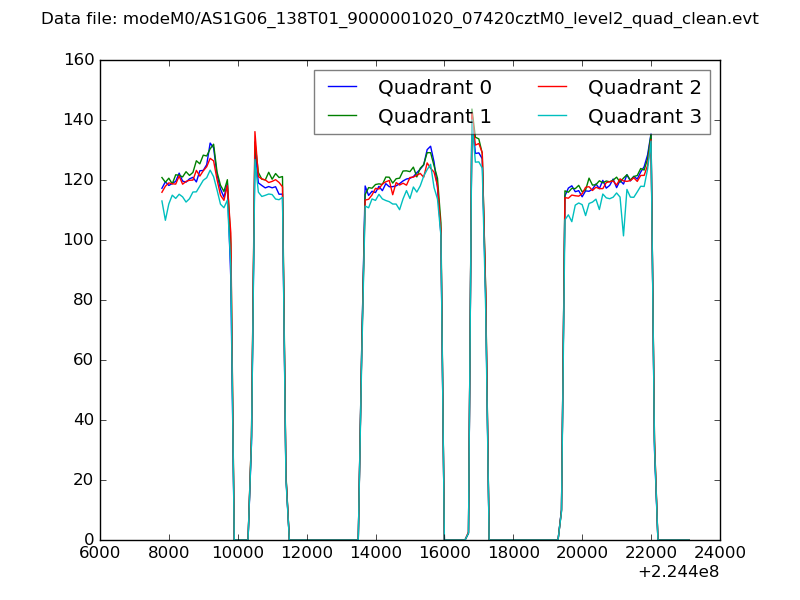 |
|
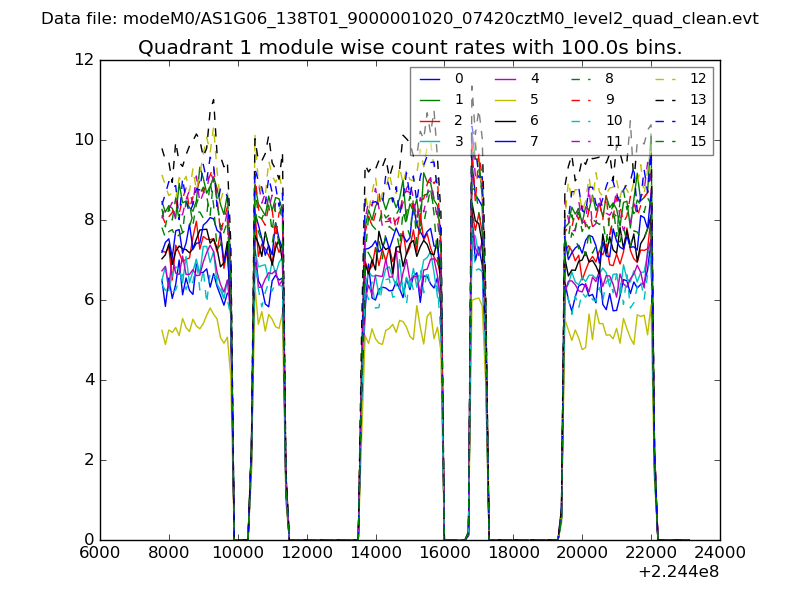
| Module-wise count rates for Quadrant A Data is divided into 100 sec bins |
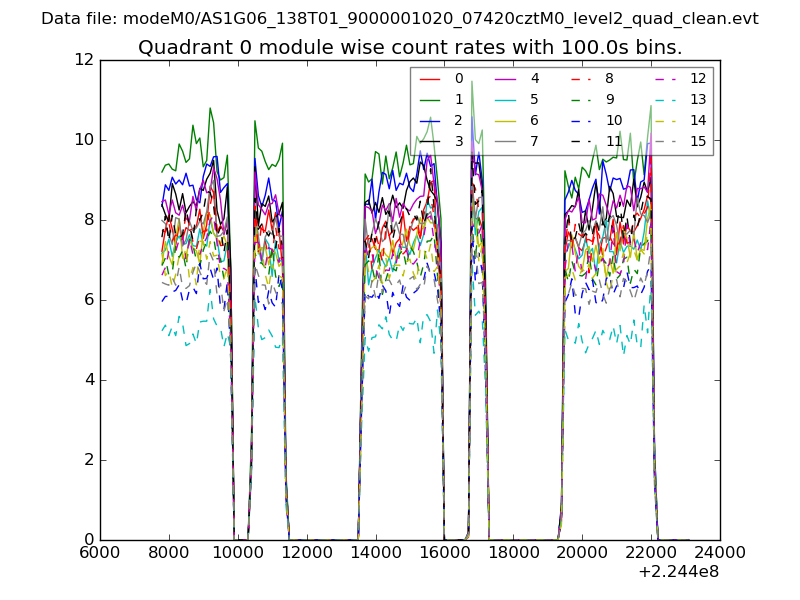 |
 |
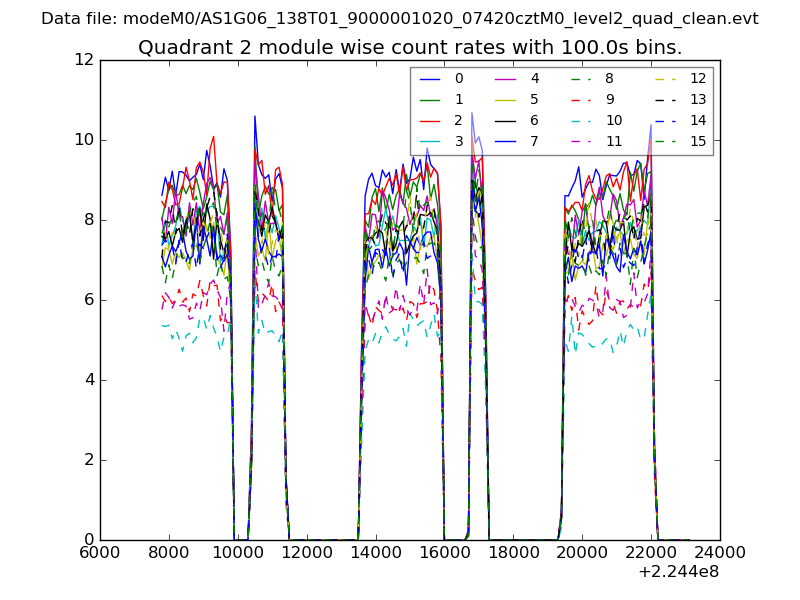
| Module-wise count rates for Quadrant B Data is divided into 100 sec bins |
 |
 |
| Module-wise count rates for Quadrant C Data is divided into 100 sec bins |
 |
 |
| Module-wise count rates for Quadrant D Data is divided into 100 sec bins |
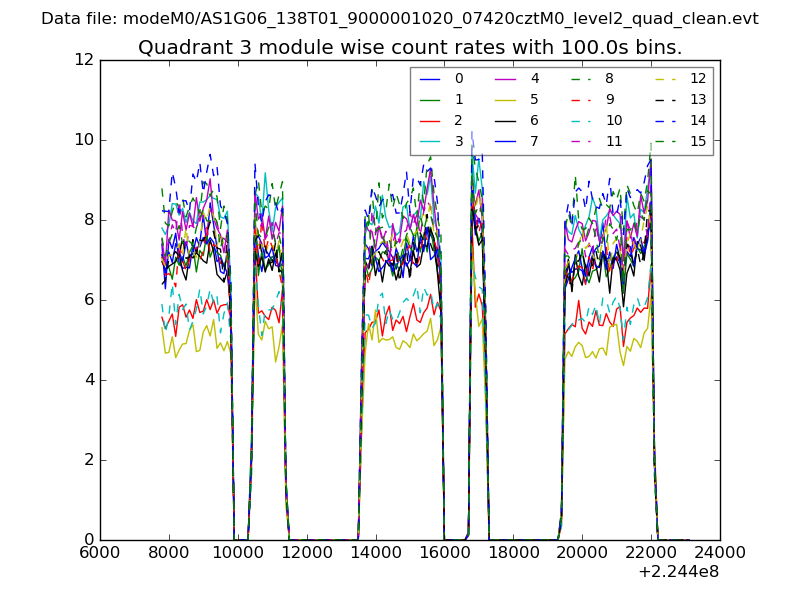 |
 |
| Parameter | Plot |
|---|---|
| CZT HV Monitor | 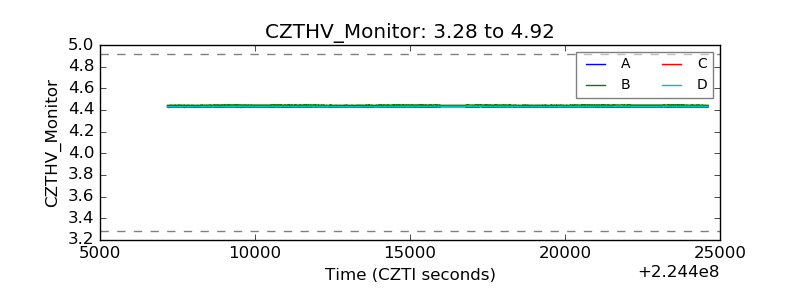 |
| D_VDD | 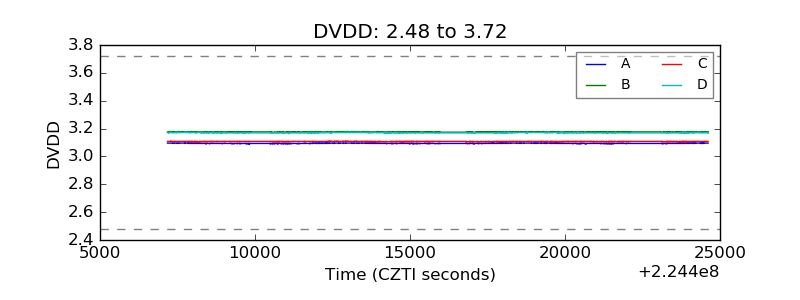 |
| Temperature 1 |  |
| Veto HV Monitor | 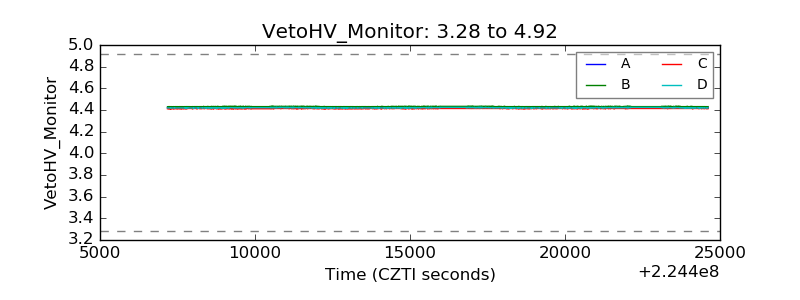 |
| Veto LLD | 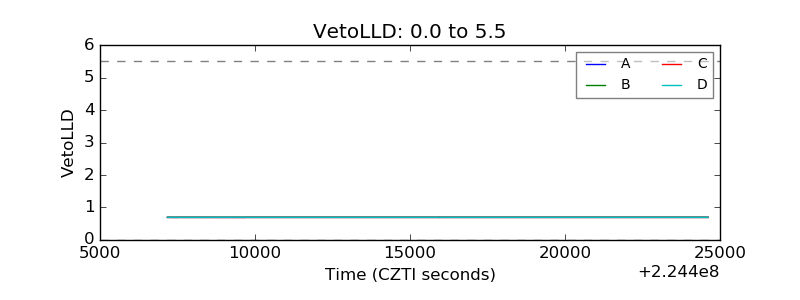 |
| Alpha Counter |  |
| _CPM_Rate | 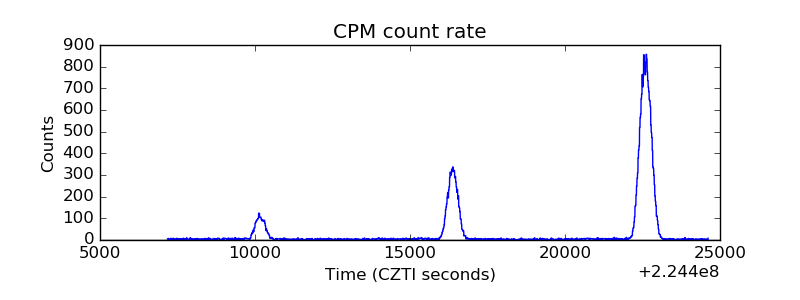 |
| CZT Counter |  |
| +2.5 Volts monitor |  |
| +5 Volts monitor |  |
| _ROLL_ROT | 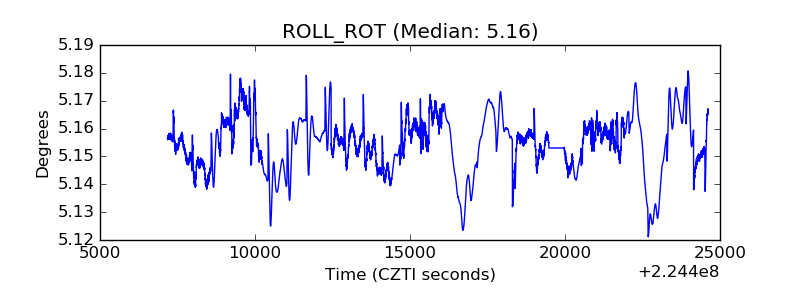 |
| _Roll_DEC | 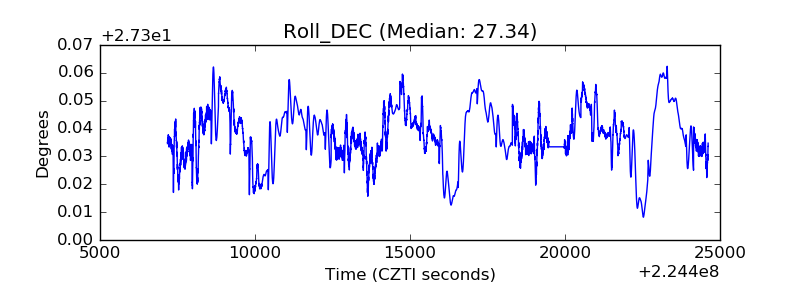 |
| _Roll_RA |  |
| Veto Counter | 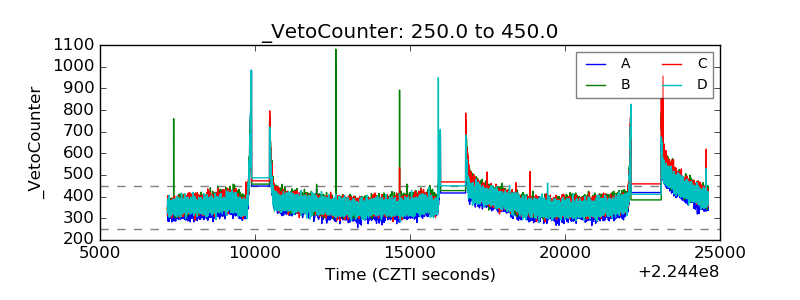 |