| Param | Original file | Final file |
|---|---|---|
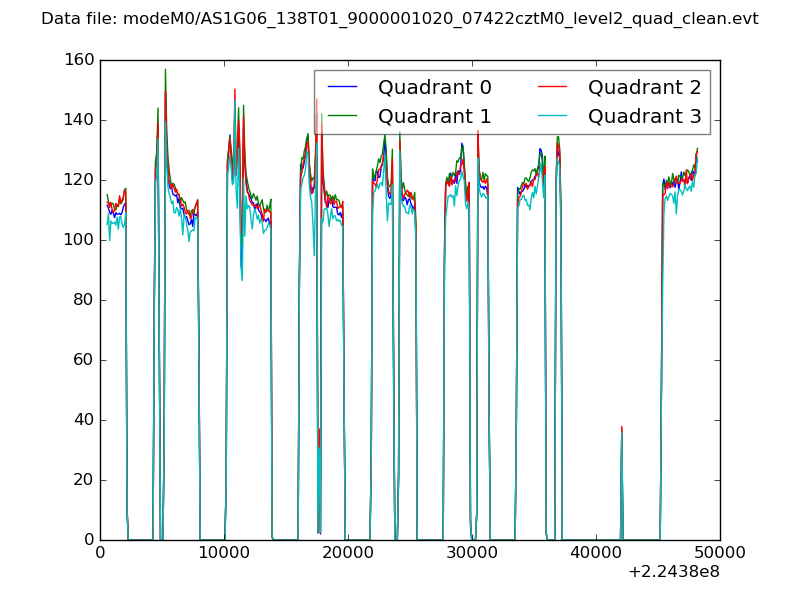
| Filename | modeM0/AS1G06_138T01_9000001020_07422cztM0_level2.evt | modeM0/AS1G06_138T01_9000001020_07422cztM0_level2_quad_clean.evt |
| Size (bytes) | 2,891,540,160 | 463,521,600 |
| Size | 2.7 GB | 442.0 MB |
| Events in quadrant A | 19,159,921 | 2,797,521 |
| Events in quadrant B | 20,069,950 | 2,866,881 |
| Events in quadrant C | 22,359,082 | 2,824,703 |
| Events in quadrant D | 23,171,159 | 2,690,876 |
| Mode M0 | |||
|---|---|---|---|
| Quadrant | BADHDUFLAG | Total packets | Discarded packets |
| A | 0 | 85744 | 9 |
| B | 0 | 87276 | 8 |
| C | 0 | 93055 | 8 |
| D | 0 | 97247 | 11 |
| Mode M9 | |||
|---|---|---|---|
| Quadrant | BADHDUFLAG | Total packets | Discarded packets |
| A | 0 | 48 | 0 |
| B | 0 | 48 | 0 |
| C | 0 | 48 | 0 |
| D | 0 | 48 | 0 |
| Mode SS | |||
|---|---|---|---|
| Quadrant | BADHDUFLAG | Total packets | Discarded packets |
| A | 0 | 850 | 0 |
| B | 0 | 850 | 0 |
| C | 0 | 850 | 0 |
| D | 0 | 850 | 0 |
| Quadrant | Total seconds | Saturated seconds | Saturation percentage |
|---|---|---|---|
| A | 41634 | 691 | 1.659701% |
| B | 41634 | 756 | 1.815824% |
| C | 41634 | 501 | 1.203343% |
| D | 41633 | 1232 | 2.959191% |
Noise dominated data is calculated using 1-second bins in cleaned event files. If a bin has >2000 counts, and if more than 50% of those come from <1% of pixels, then it is considered to be noise-dominated and hence unusable.
| Quadrant | # 1 sec bins | Bins with >0 counts | Bins with >2000 counts | High rate bins dominated by noise | Noise dominated (total time) | Noise dominated (detector-on time) | Marked lightcurve |
|---|---|---|---|---|---|---|---|
| A | 50302 | 41644 | 4 | 4 | 0.01% | 0.01% | 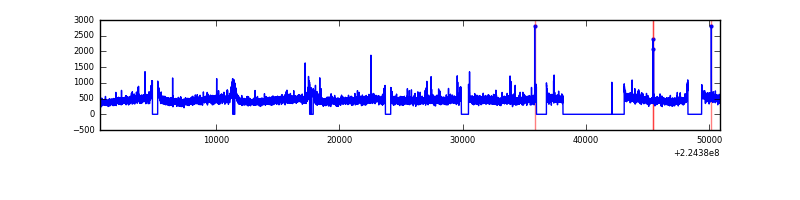 |
| B | 50302 | 41644 | 21 | 21 | 0.04% | 0.05% | 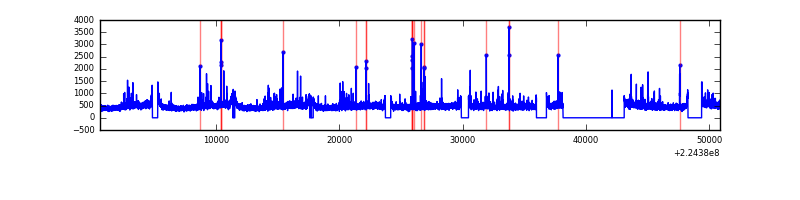 |
| C | 50302 | 41645 | 7 | 7 | 0.01% | 0.02% | 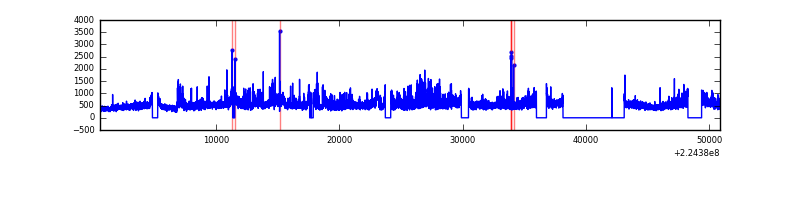 |
| D | 50302 | 41643 | 521 | 521 | 1.04% | 1.25% | 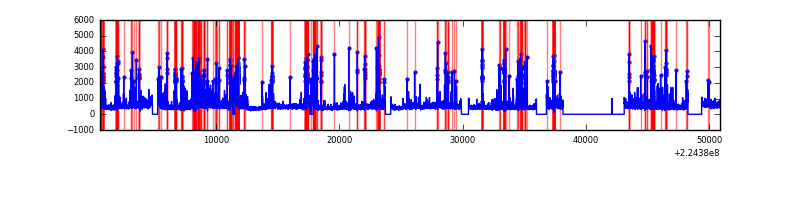 |
Top three noisy pixels from each quadrant. If the there are fewer than three noisy pixels in the level2.evt file, extra rows are filled as -1
| Pixel properties | Quadrant properties | ||||||
|---|---|---|---|---|---|---|---|
| Quadrant | DetID | PixID | Counts | Sigma | Mean | Median | Sigma |
| A | 13 | 251 | 61164 | 56.28 | 4941 | 4836 | 1000.9 |
| A | 0 | 226 | 47794 | 42.92 | 4941 | 4836 | 1000.9 |
| A | 12 | 194 | 43472 | 38.6 | 4941 | 4836 | 1000.9 |
| B | 0 | 214 | 501374 | 520.94 | 4981 | 4856 | 953.1 |
| B | 12 | 111 | 99514 | 99.31 | 4981 | 4856 | 953.1 |
| B | 4 | 81 | 88055 | 87.29 | 4981 | 4856 | 953.1 |
| C | 9 | 68 | 3447115 | 3081.6 | 4807 | 4824 | 1117.0 |
| C | 1 | 16 | 62086 | 51.26 | 4807 | 4824 | 1117.0 |
| C | 12 | 4 | 47809 | 38.48 | 4807 | 4824 | 1117.0 |
| D | 8 | 195 | 899655 | 763.93 | 4781 | 4630 | 1171.6 |
| D | 2 | 14 | 896708 | 761.41 | 4781 | 4630 | 1171.6 |
| D | 13 | 104 | 666849 | 565.22 | 4781 | 4630 | 1171.6 |
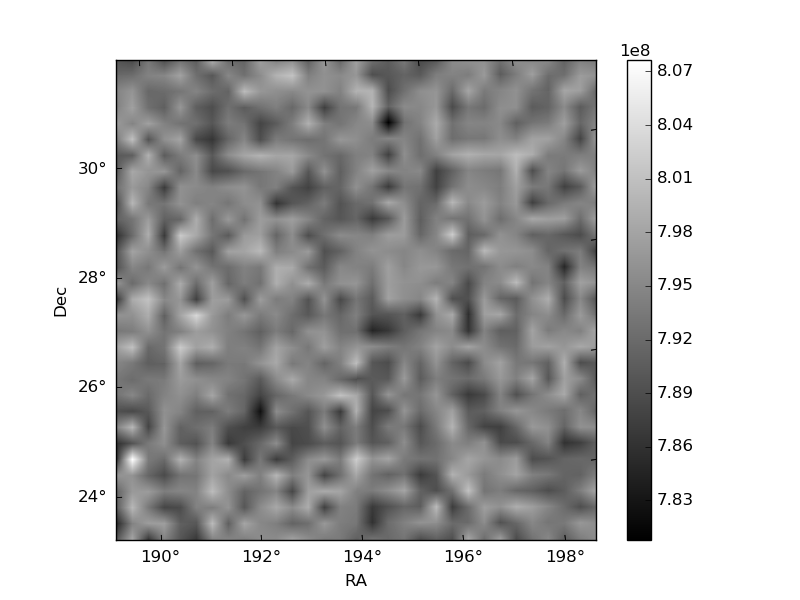
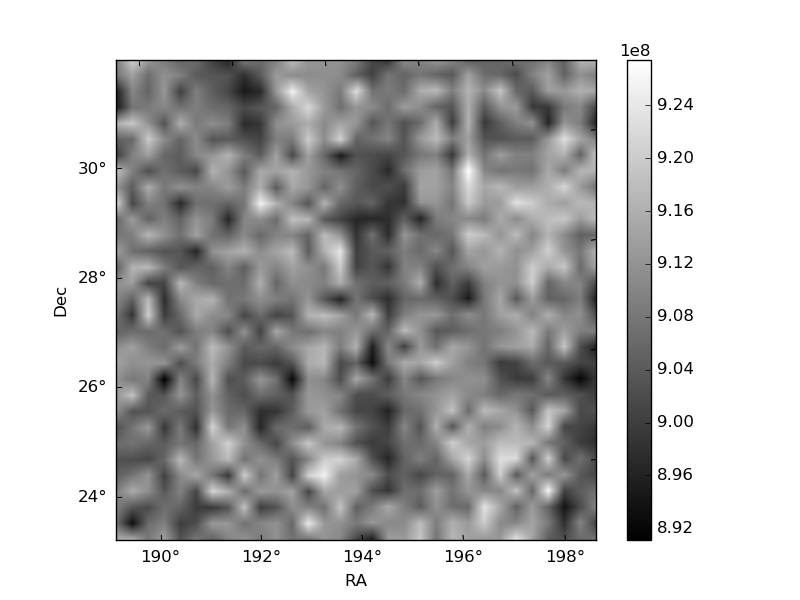
Histogram calculated using DETX and DETY for each event in the final _common_clean file
| Quadrant A | 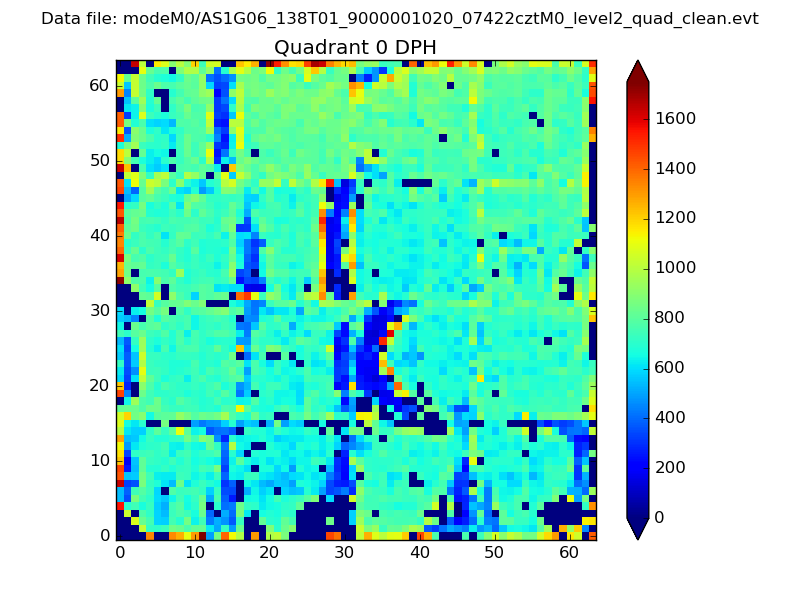 |
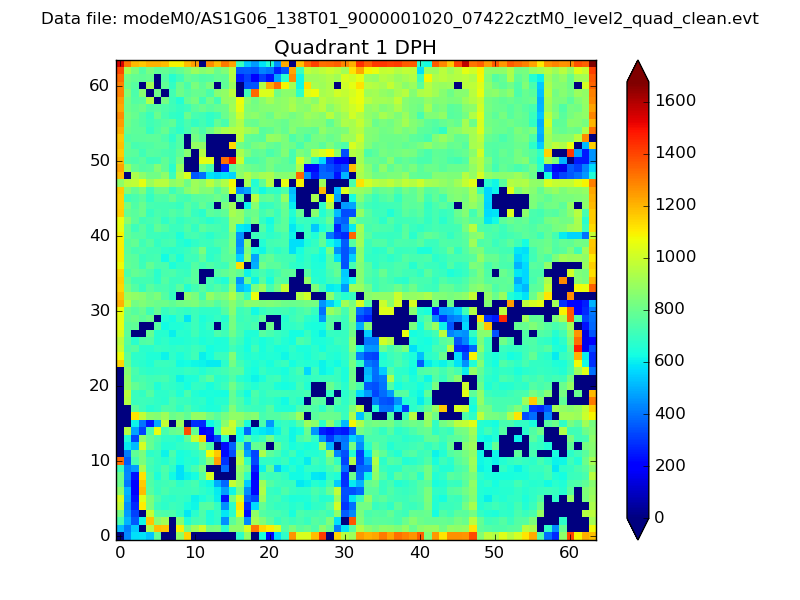 |
Quadrant B |
|---|---|---|---|
| Quadrant D |  |
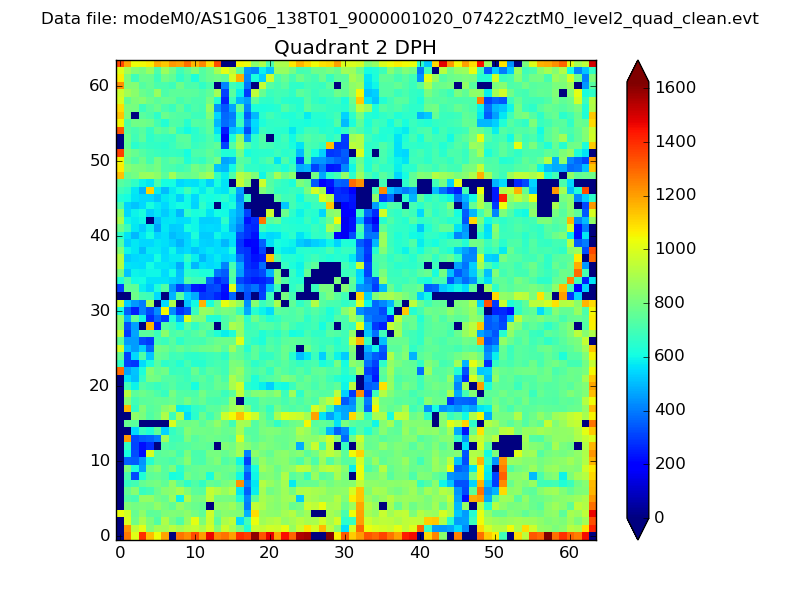 |
Quadrant C |
| Plot type | Count rate plots | Images |
|---|---|---|
| Comparison with Poisson distribution Blue bars denote a histogram of data divided into 1 sec bins. Red curve is a Poisson curve with rate = median count rate of data. |
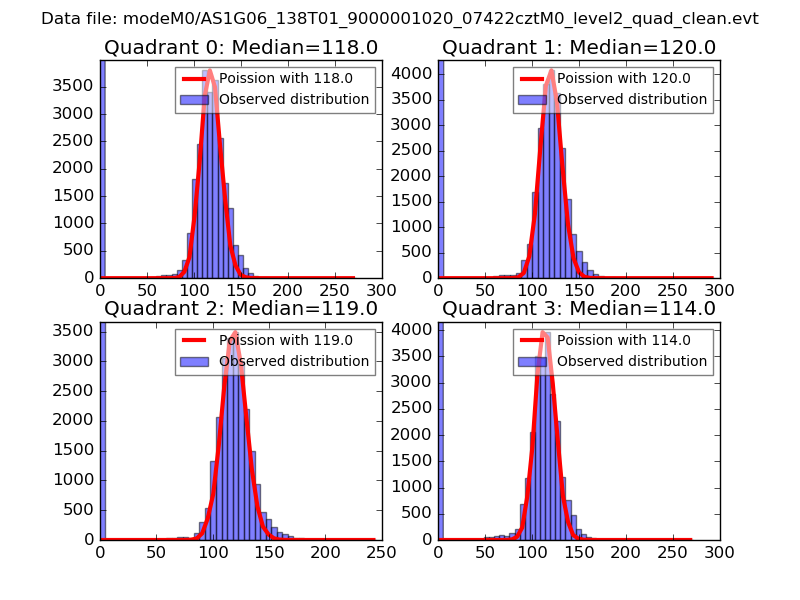 |
 |
| Quadrant-wise count rates Data is divided into 100 sec bins |
 |
|
| Module-wise count rates for Quadrant A Data is divided into 100 sec bins |
 |
 |
| Module-wise count rates for Quadrant B Data is divided into 100 sec bins |
 |
 |
| Module-wise count rates for Quadrant C Data is divided into 100 sec bins |
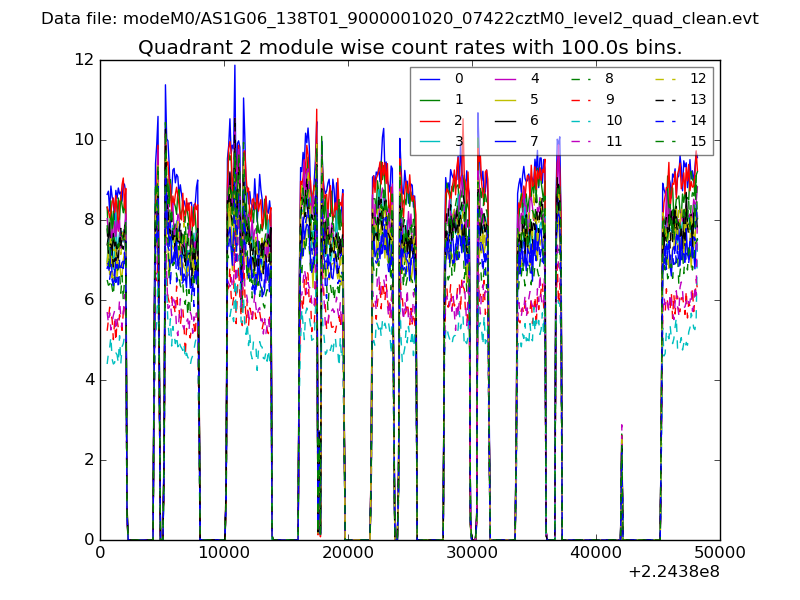 |
 |
| Module-wise count rates for Quadrant D Data is divided into 100 sec bins |
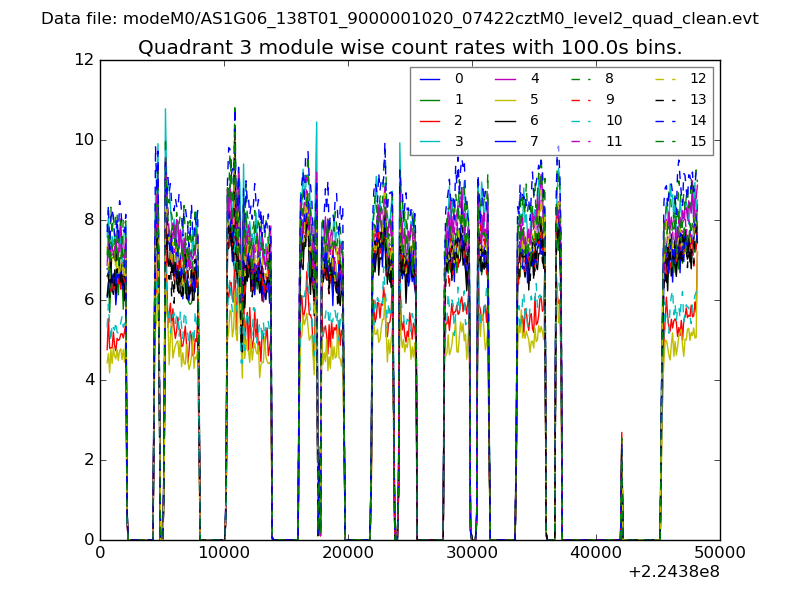 |
 |
| Parameter | Plot |
|---|---|
| CZT HV Monitor | 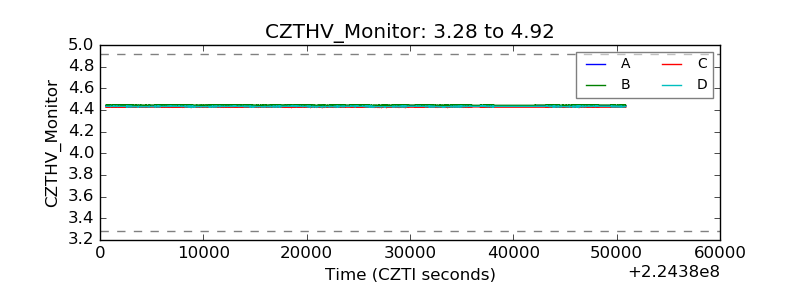 |
| D_VDD | 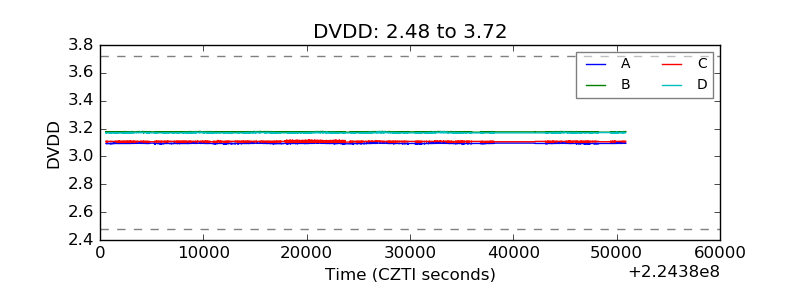 |
| Temperature 1 | 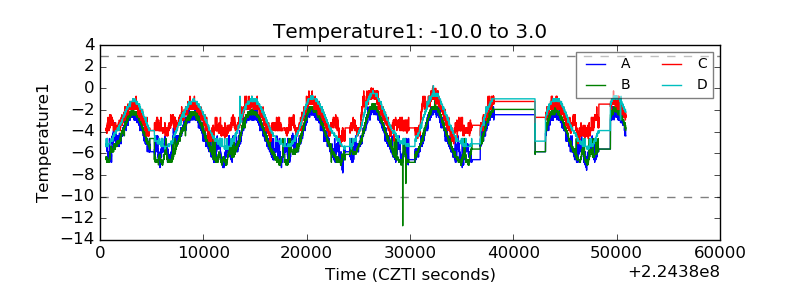 |
| Veto HV Monitor | 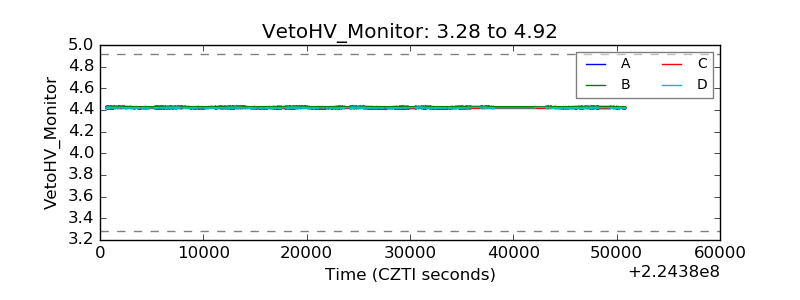 |
| Veto LLD | 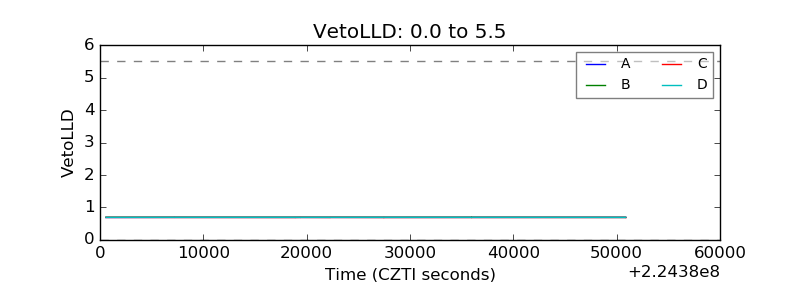 |
| Alpha Counter | 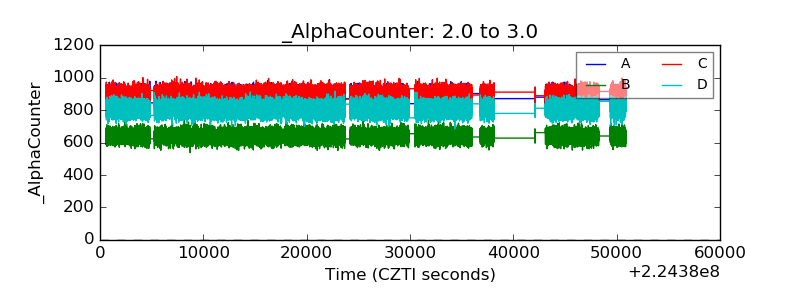 |
| _CPM_Rate | 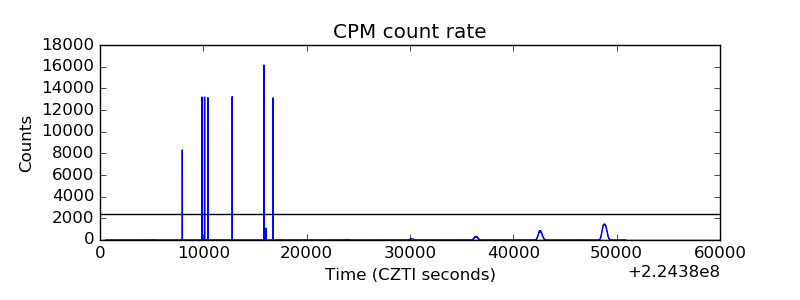 |
| CZT Counter | 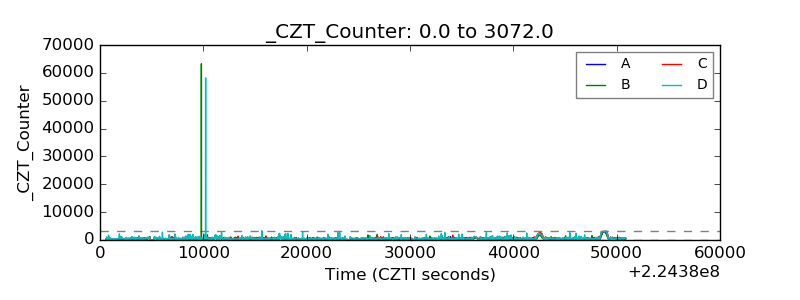 |
| +2.5 Volts monitor |  |
| +5 Volts monitor |  |
| _ROLL_ROT | 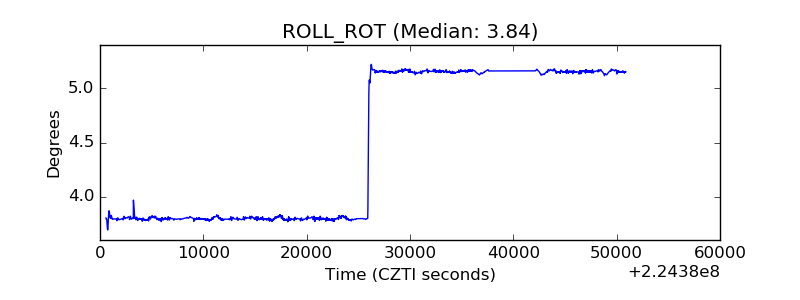 |
| _Roll_DEC | 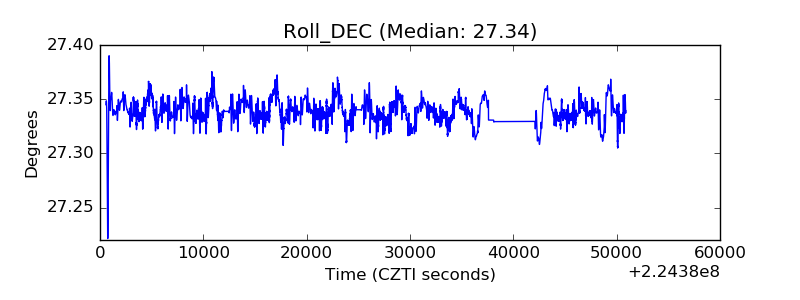 |
| _Roll_RA | 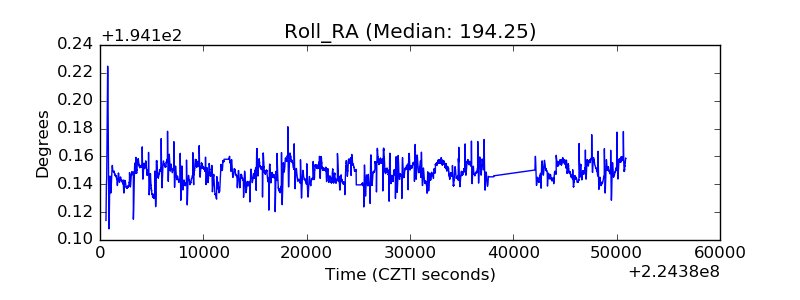 |
| Veto Counter | 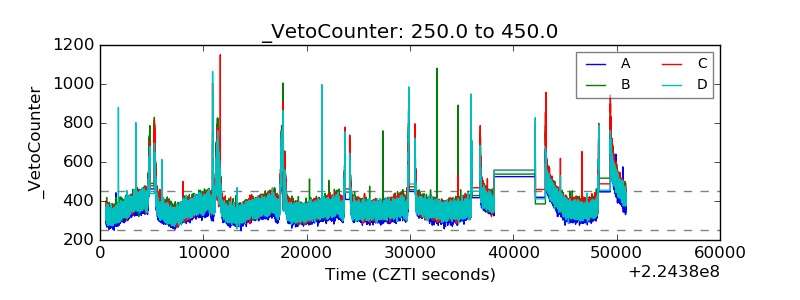 |