| Param | Original file | Final file |
|---|---|---|
| Filename | modeM0/AS1G06_138T01_9000001020_07423cztM0_level2.evt | modeM0/AS1G06_138T01_9000001020_07423cztM0_level2_quad_clean.evt |
| Size (bytes) | 175,464,000 | 14,662,080 |
| Size | 167.3 MB | 14.0 MB |
| Events in quadrant A | 1,199,096 | 69,185 |
| Events in quadrant B | 1,275,081 | 69,704 |
| Events in quadrant C | 1,297,234 | 68,633 |
| Events in quadrant D | 1,380,147 | 65,964 |
| Mode M0 | |||
|---|---|---|---|
| Quadrant | BADHDUFLAG | Total packets | Discarded packets |
| A | 0 | 5030 | 1 |
| B | 0 | 5272 | 1 |
| C | 0 | 5395 | 1 |
| D | 0 | 5655 | 1 |
| Mode M9 | |||
|---|---|---|---|
| Quadrant | BADHDUFLAG | Total packets | Discarded packets |
| A | 0 | 6 | 0 |
| B | 0 | 6 | 0 |
| C | 0 | 6 | 0 |
| D | 0 | 7 | 0 |
| Mode SS | |||
|---|---|---|---|
| Quadrant | BADHDUFLAG | Total packets | Discarded packets |
| A | 0 | 48 | 0 |
| B | 0 | 48 | 0 |
| C | 0 | 48 | 0 |
| D | 0 | 48 | 0 |
| Quadrant | Total seconds | Saturated seconds | Saturation percentage |
|---|---|---|---|
| A | 2352 | 13 | 0.552721% |
| B | 2352 | 23 | 0.977891% |
| C | 2352 | 7 | 0.297619% |
| D | 2352 | 9 | 0.382653% |
Noise dominated data is calculated using 1-second bins in cleaned event files. If a bin has >2000 counts, and if more than 50% of those come from <1% of pixels, then it is considered to be noise-dominated and hence unusable.
| Quadrant | # 1 sec bins | Bins with >0 counts | Bins with >2000 counts | High rate bins dominated by noise | Noise dominated (total time) | Noise dominated (detector-on time) | Marked lightcurve |
|---|---|---|---|---|---|---|---|
| A | 2352 | 2352 | 1 | 1 | 0.04% | 0.04% | 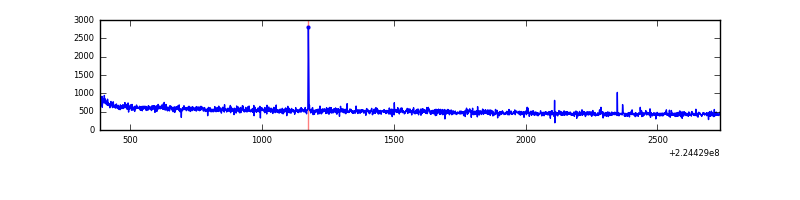 |
| B | 2352 | 2352 | 1 | 1 | 0.04% | 0.04% | 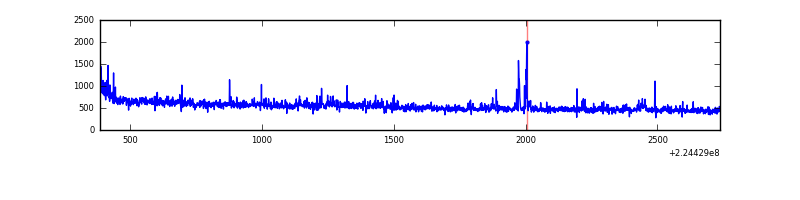 |
| C | 2352 | 2352 | 0 | 0 | 0.00% | 0.00% | 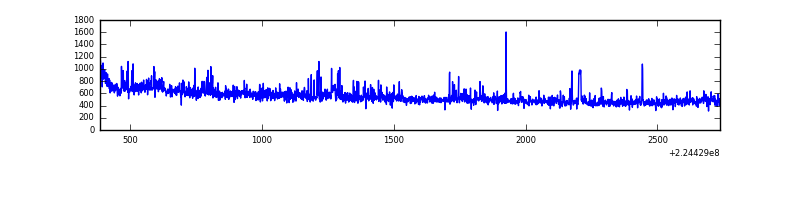 |
| D | 2352 | 2352 | 2 | 2 | 0.09% | 0.09% | 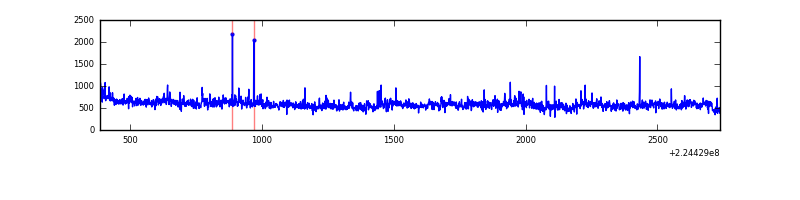 |
Top three noisy pixels from each quadrant. If the there are fewer than three noisy pixels in the level2.evt file, extra rows are filled as -1
| Pixel properties | Quadrant properties | ||||||
|---|---|---|---|---|---|---|---|
| Quadrant | DetID | PixID | Counts | Sigma | Mean | Median | Sigma |
| A | 15 | 234 | 7357 | 111.15 | 308 | 303 | 63.5 |
| A | 0 | 226 | 3137 | 44.66 | 308 | 303 | 63.5 |
| A | 3 | 1 | 2942 | 41.58 | 308 | 303 | 63.5 |
| B | 0 | 214 | 47152 | 780.58 | 308 | 302 | 60.0 |
| B | 10 | 245 | 24530 | 403.67 | 308 | 302 | 60.0 |
| B | 12 | 111 | 5477 | 86.22 | 308 | 302 | 60.0 |
| C | 9 | 68 | 125583 | 1785.48 | 300 | 302 | 70.2 |
| C | 13 | 61 | 2193 | 26.95 | 300 | 302 | 70.2 |
| C | 14 | 67 | 902 | 8.55 | 300 | 302 | 70.2 |
| D | 8 | 195 | 162180 | 2146.71 | 302 | 293 | 75.4 |
| D | 2 | 216 | 23436 | 306.89 | 302 | 293 | 75.4 |
| D | 5 | 233 | 14568 | 189.29 | 302 | 293 | 75.4 |
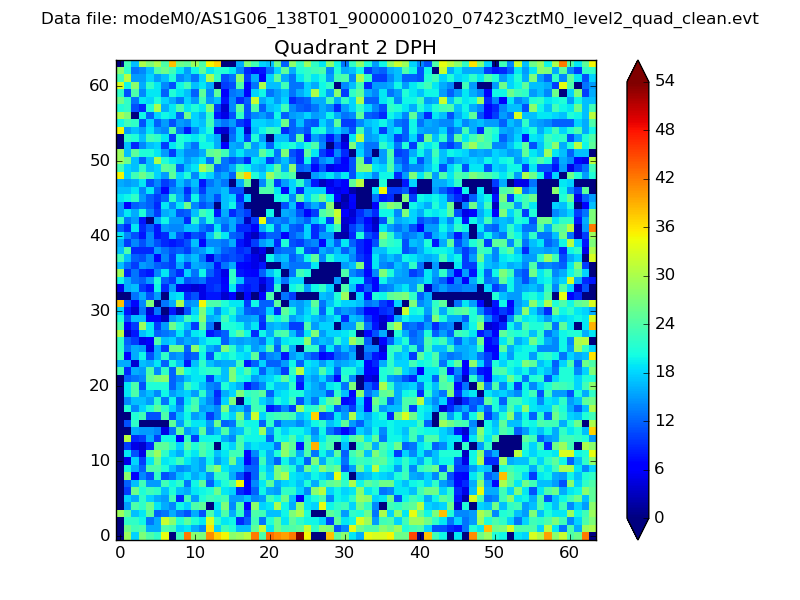
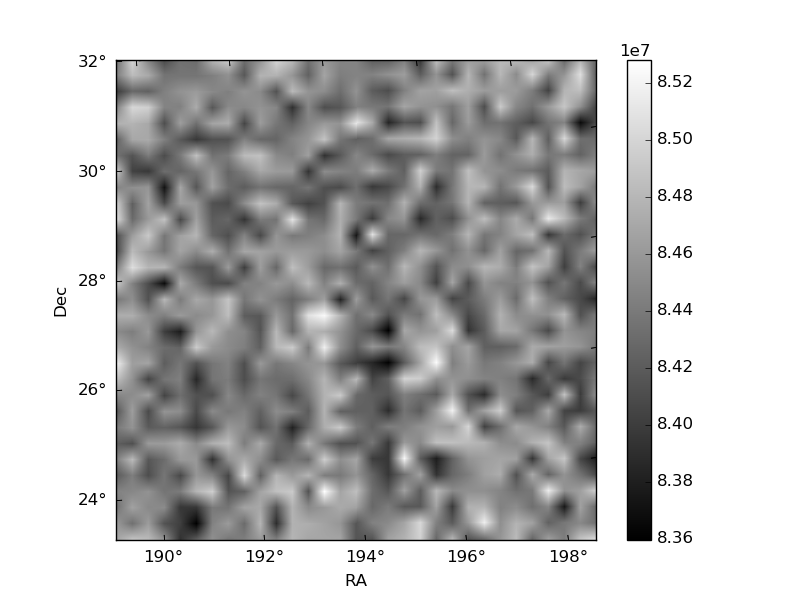
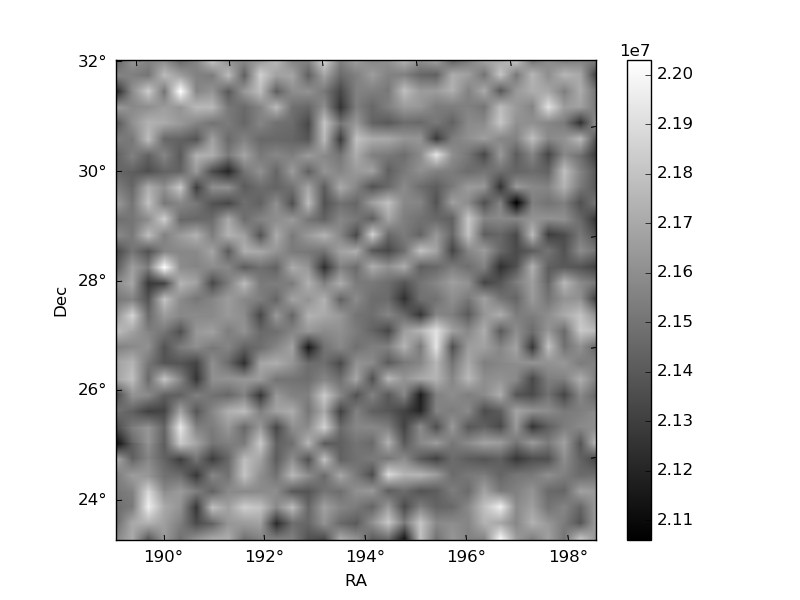
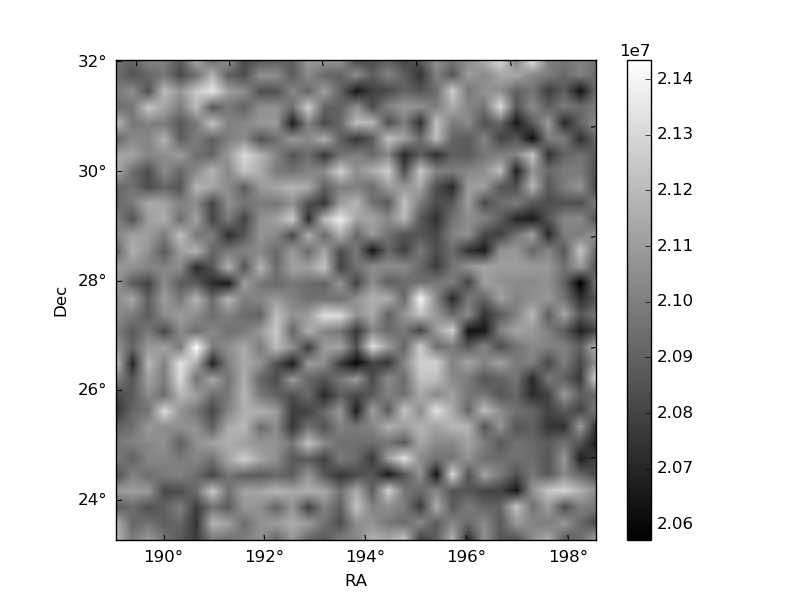
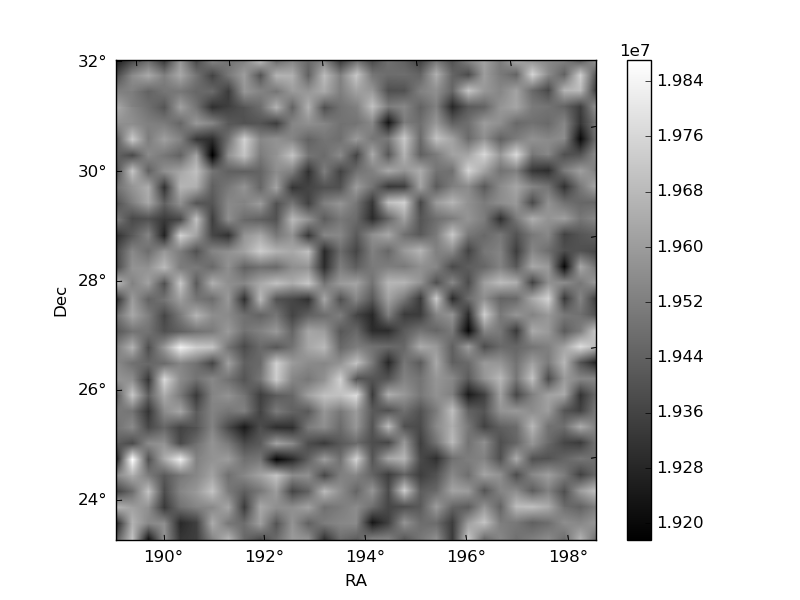
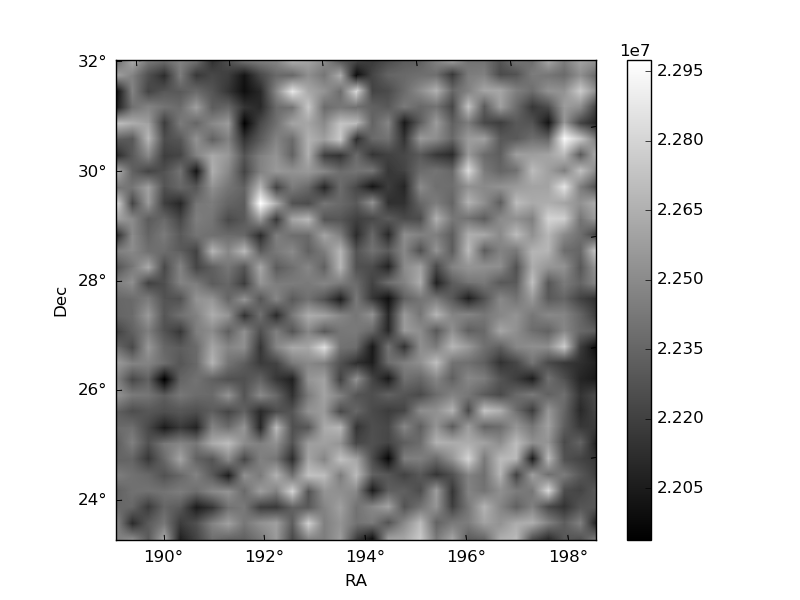
Histogram calculated using DETX and DETY for each event in the final _common_clean file
| Quadrant A | 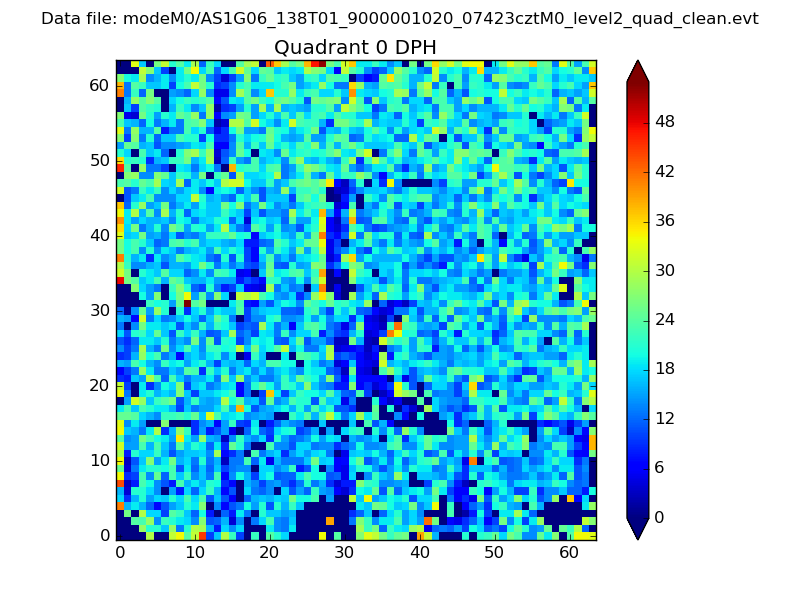 |
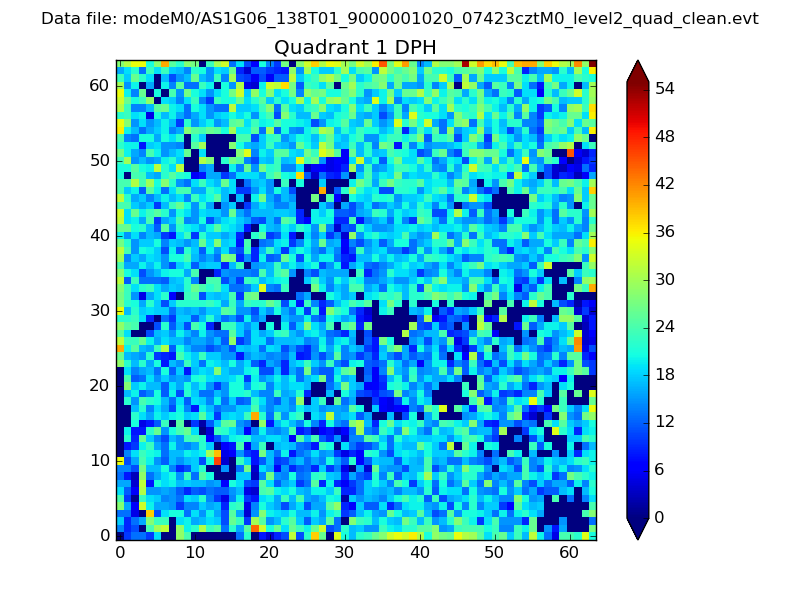 |
Quadrant B |
|---|---|---|---|
| Quadrant D | 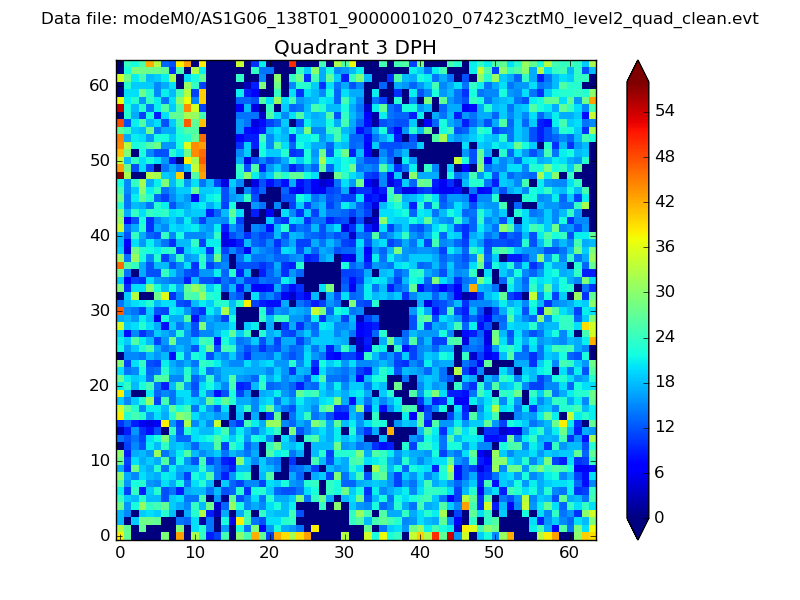 |
 |
Quadrant C |
| Plot type | Count rate plots | Images |
|---|---|---|
| Comparison with Poisson distribution Blue bars denote a histogram of data divided into 1 sec bins. Red curve is a Poisson curve with rate = median count rate of data. |
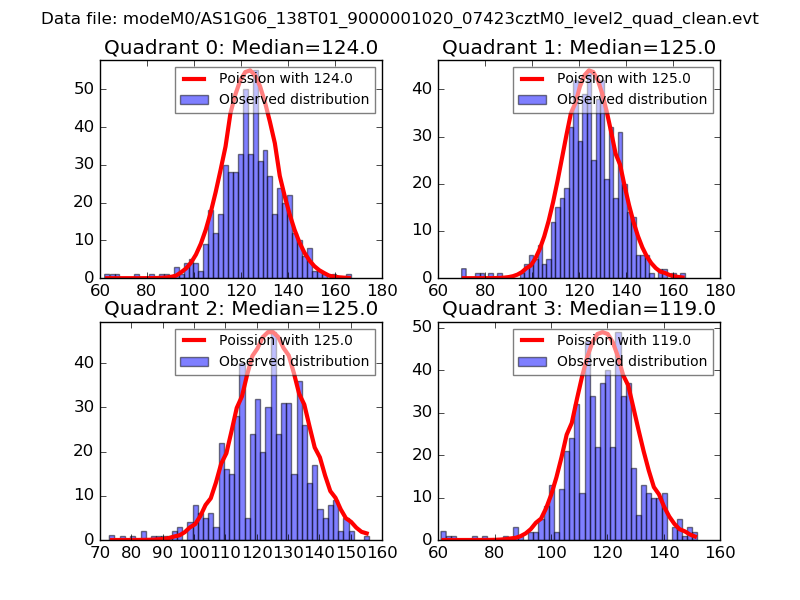 |
 |
| Quadrant-wise count rates Data is divided into 100 sec bins |
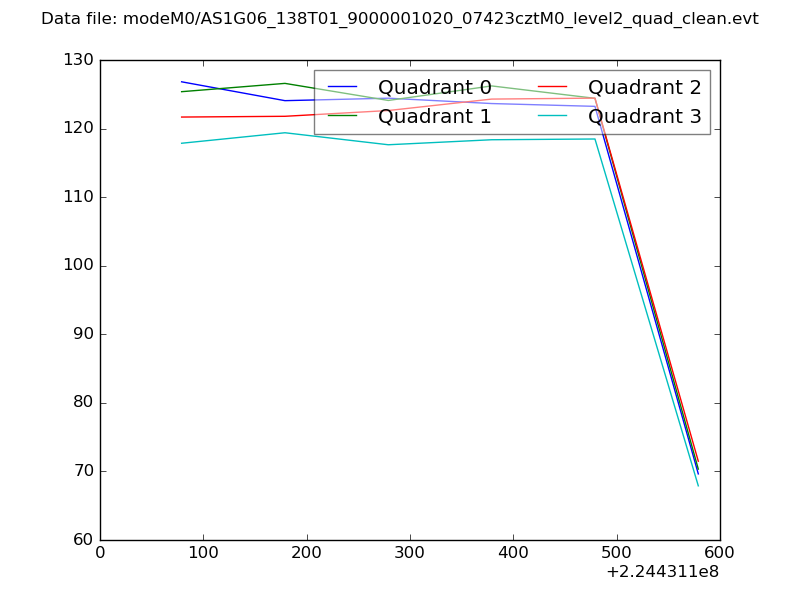 |
|
| Module-wise count rates for Quadrant A Data is divided into 100 sec bins |
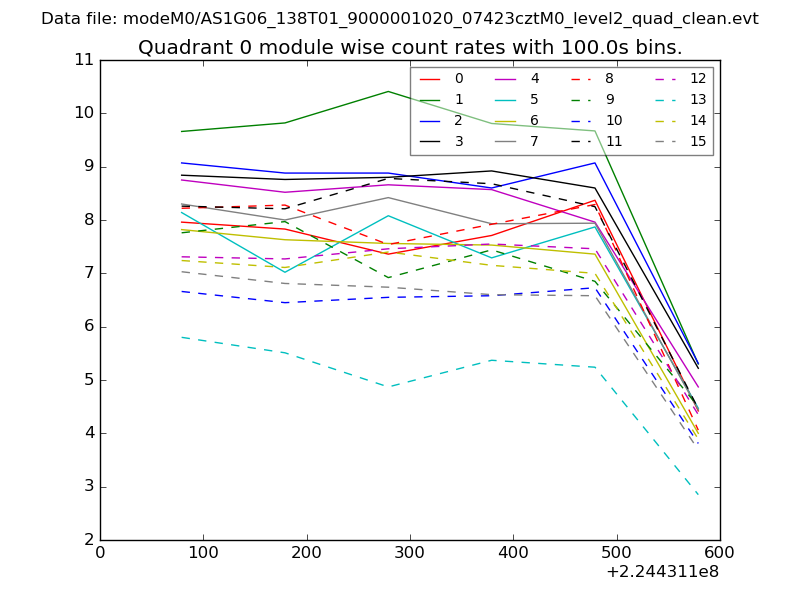 |
 |
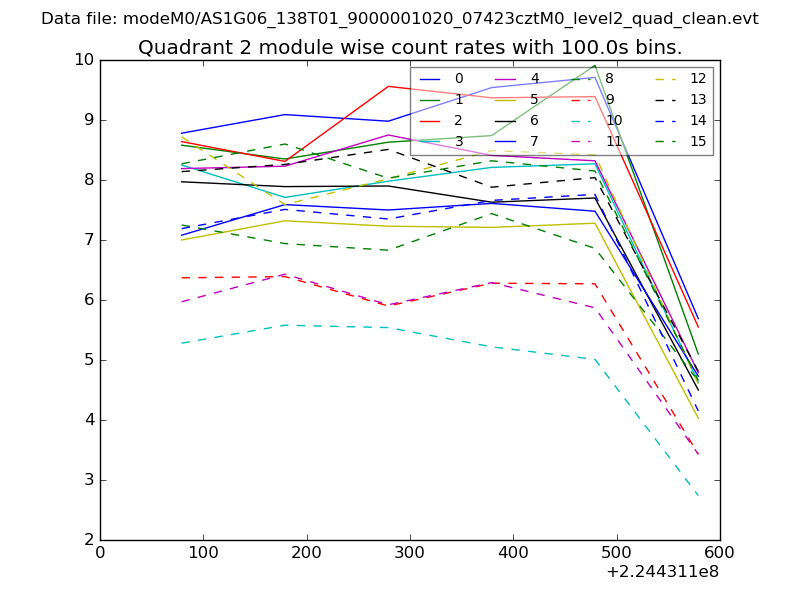
| Module-wise count rates for Quadrant B Data is divided into 100 sec bins |
 |
 |
| Module-wise count rates for Quadrant C Data is divided into 100 sec bins |
 |
 |
| Module-wise count rates for Quadrant D Data is divided into 100 sec bins |
 |
 |
| Parameter | Plot |
|---|---|
| CZT HV Monitor | 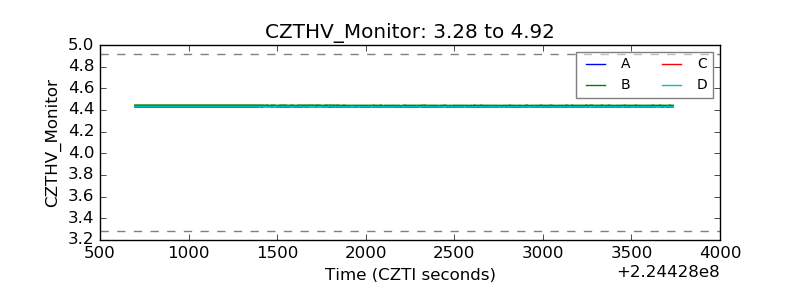 |
| D_VDD | 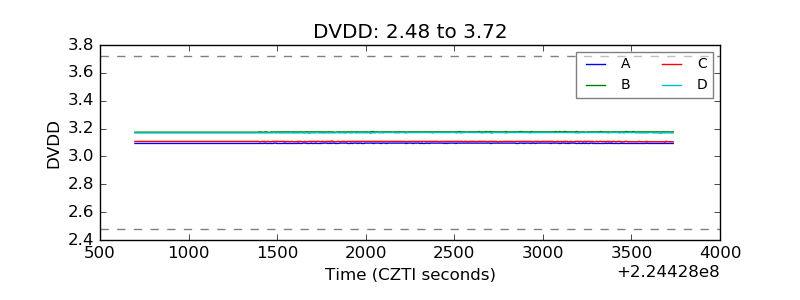 |
| Temperature 1 | 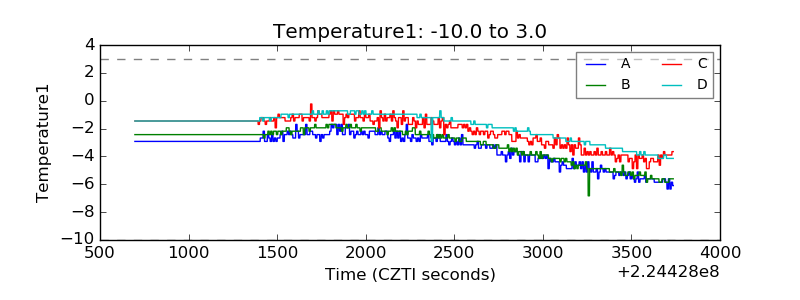 |
| Veto HV Monitor | 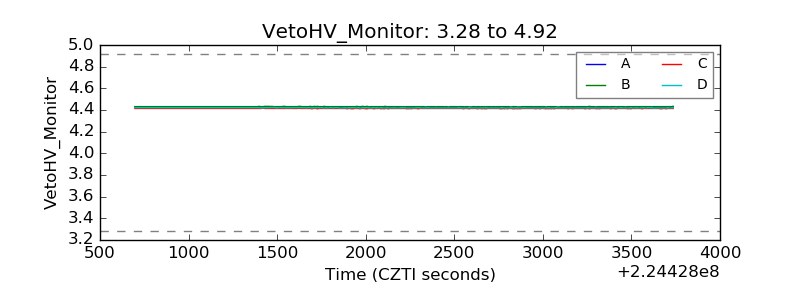 |
| Veto LLD |  |
| Alpha Counter | 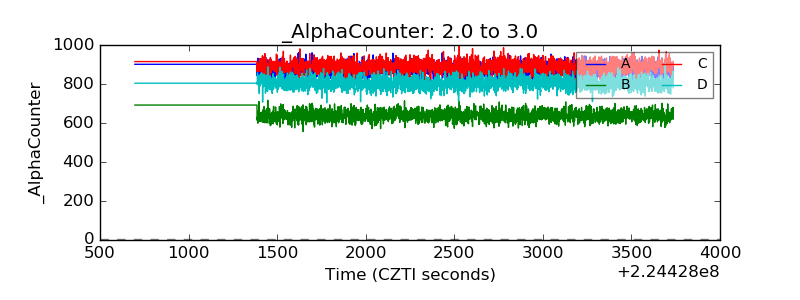 |
| _CPM_Rate | 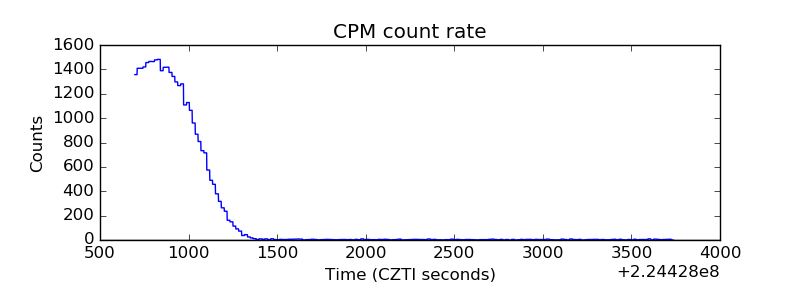 |
| CZT Counter | 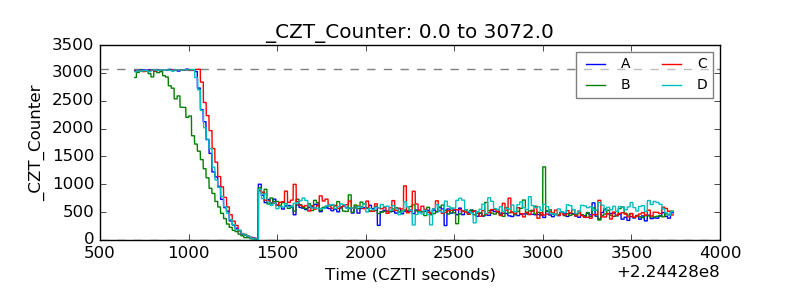 |
| +2.5 Volts monitor | 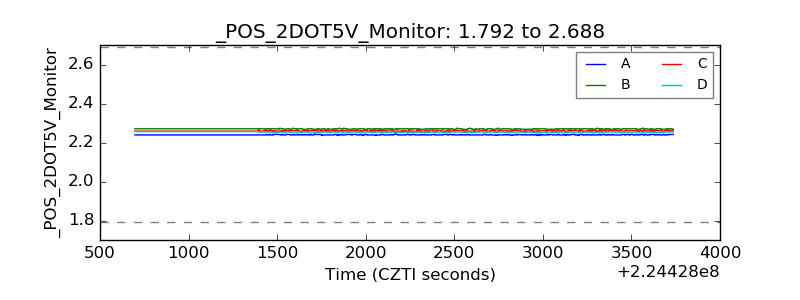 |
| +5 Volts monitor |  |
| _ROLL_ROT |  |
| _Roll_DEC | 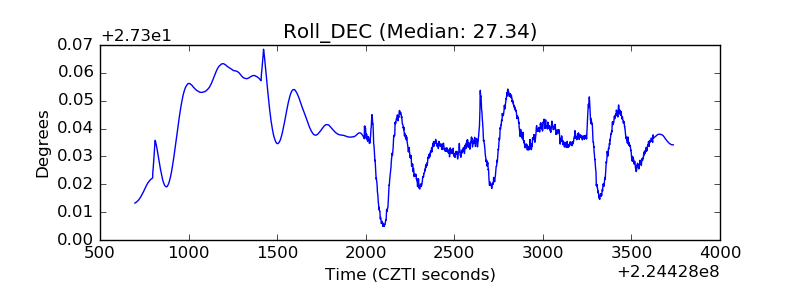 |
| _Roll_RA | 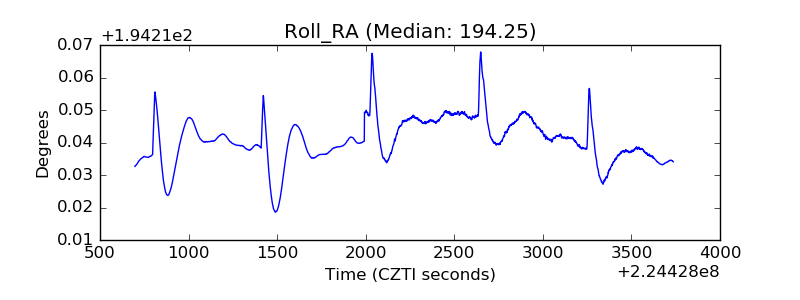 |
| Veto Counter |  |