| Param | Original file | Final file |
|---|---|---|
| Filename | modeM0/AS1A02_150T04_9000001022cztM0_level2.fits | modeM0/AS1A02_150T04_9000001022cztM0_level2_quad_clean.evt |
| Size (bytes) | 476,242,560 | 489,084,480 |
| Size | 454.2 MB | 466.4 MB |
| Events in quadrant A | 2,854,804 | 2,905,574 |
| Events in quadrant B | 2,782,864 | 2,938,838 |
| Events in quadrant C | 2,849,560 | 2,860,007 |
| Events in quadrant D | 2,465,776 | 2,637,997 |
| Mode SS | |||
|---|---|---|---|
| Quadrant | BADHDUFLAG | Total packets | Discarded packets |
| A | 0 | 1030 | 0 |
| B | 0 | 1030 | 0 |
| C | 0 | 1030 | 0 |
| D | 0 | 1030 | 0 |
| Mode M9 | |||
|---|---|---|---|
| Quadrant | BADHDUFLAG | Total packets | Discarded packets |
| A | 0 | 75 | 0 |
| B | 0 | 75 | 0 |
| C | 0 | 75 | 0 |
| D | 0 | 75 | 0 |
| Mode M0 | |||
|---|---|---|---|
| Quadrant | BADHDUFLAG | Total packets | Discarded packets |
| A | 0 | 107032 | 0 |
| B | 0 | 110470 | 0 |
| C | 0 | 120940 | 0 |
| D | 0 | 114307 | 0 |
| Quadrant | Total seconds | Saturated seconds | Saturation percentage |
|---|---|---|---|
| A | 50572 | 762 | 1.506763% |
| B | 50572 | 878 | 1.736139% |
| C | 50572 | 525 | 1.038124% |
| D | 50572 | 896 | 1.771731% |
Noise dominated data is calculated using 1-second bins in cleaned event files. If a bin has >2000 counts, and if more than 50% of those come from <1% of pixels, then it is considered to be noise-dominated and hence unusable.
| Quadrant | # 1 sec bins | Bins with >0 counts | Bins with >2000 counts | High rate bins dominated by noise | Noise dominated (total time) | Noise dominated (detector-on time) | Marked lightcurve |
|---|---|---|---|---|---|---|---|
| A | 58093 | 50572 | 0 | 0 | 0.00% | 0.00% | 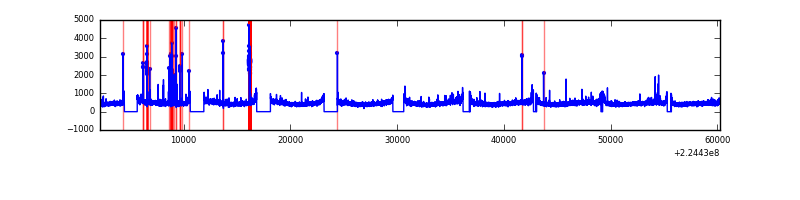 |
| B | 58093 | 50573 | 0 | 0 | 0.00% | 0.00% | 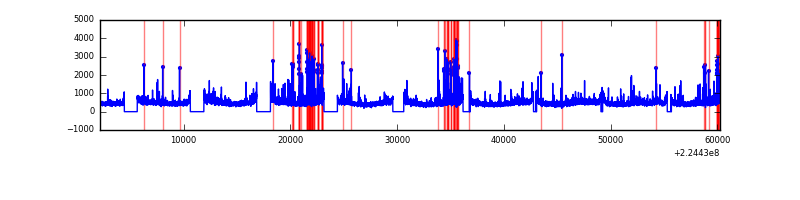 |
| C | 58093 | 50574 | 0 | 0 | 0.00% | 0.00% | 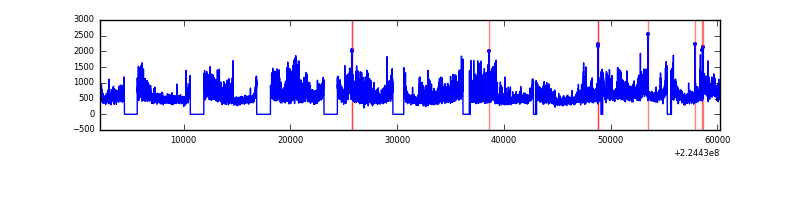 |
| D | 58093 | 50563 | 0 | 0 | 0.00% | 0.00% |  |
Top three noisy pixels from each quadrant. If the there are fewer than three noisy pixels in the level2.evt file, extra rows are filled as -1
| Pixel properties | Quadrant properties | ||||||
|---|---|---|---|---|---|---|---|
| Quadrant | DetID | PixID | Counts | Sigma | Mean | Median | Sigma |
| A | 0 | 29 | 2770 | 11.0 | 741 | 690 | 189.1 |
| A | 7 | 110 | 2287 | 8.45 | 741 | 690 | 189.1 |
| A | 0 | 30 | 2125 | 7.59 | 741 | 690 | 189.1 |
| B | 2 | 9 | 2426 | 11.69 | 732 | 695 | 148.0 |
| B | 2 | 8 | 1861 | 7.88 | 732 | 695 | 148.0 |
| B | 14 | 254 | 1857 | 7.85 | 732 | 695 | 148.0 |
| C | 1 | 80 | 2089 | 6.96 | 752 | 697 | 200.0 |
| C | 1 | 81 | 2034 | 6.68 | 752 | 697 | 200.0 |
| C | 9 | 188 | 1968 | 6.35 | 752 | 697 | 200.0 |
| D | 3 | 14 | 1855 | 6.41 | 703 | 638 | 189.9 |
| D | 7 | 5 | 1791 | 6.07 | 703 | 638 | 189.9 |
| D | 6 | 231 | 1783 | 6.03 | 703 | 638 | 189.9 |
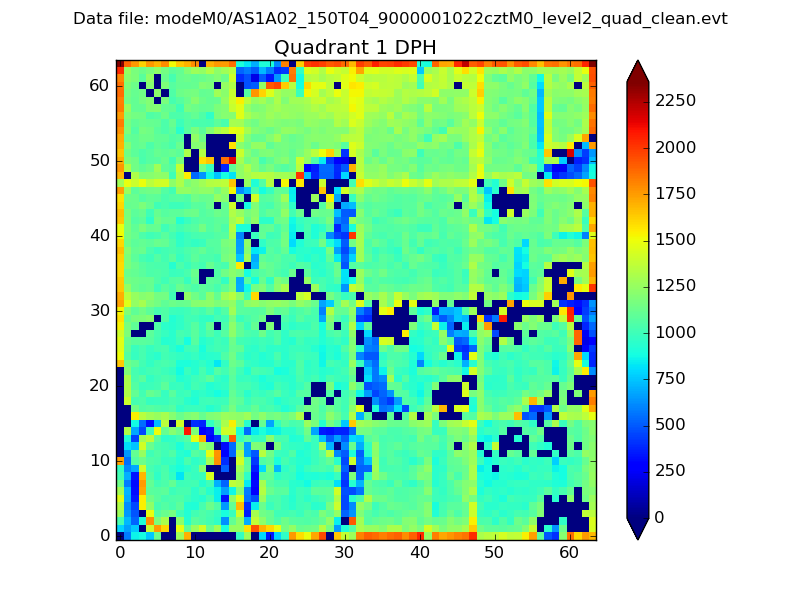
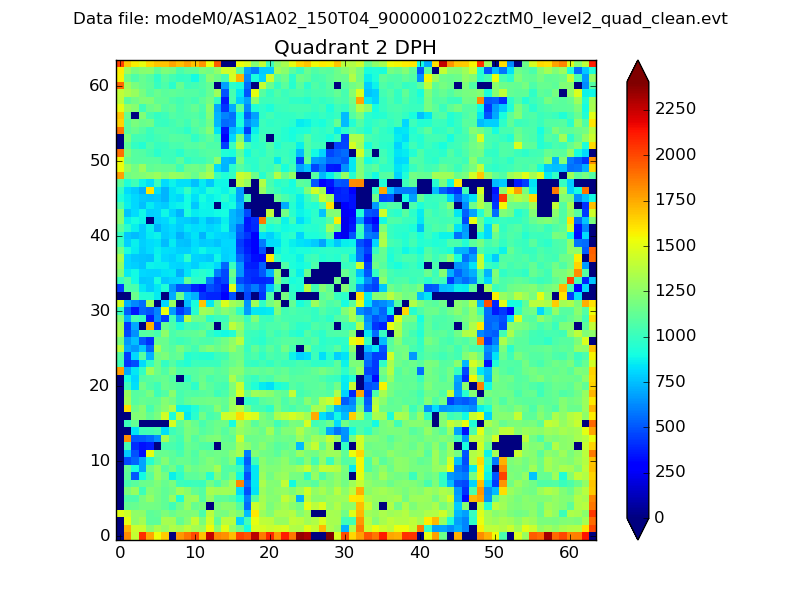
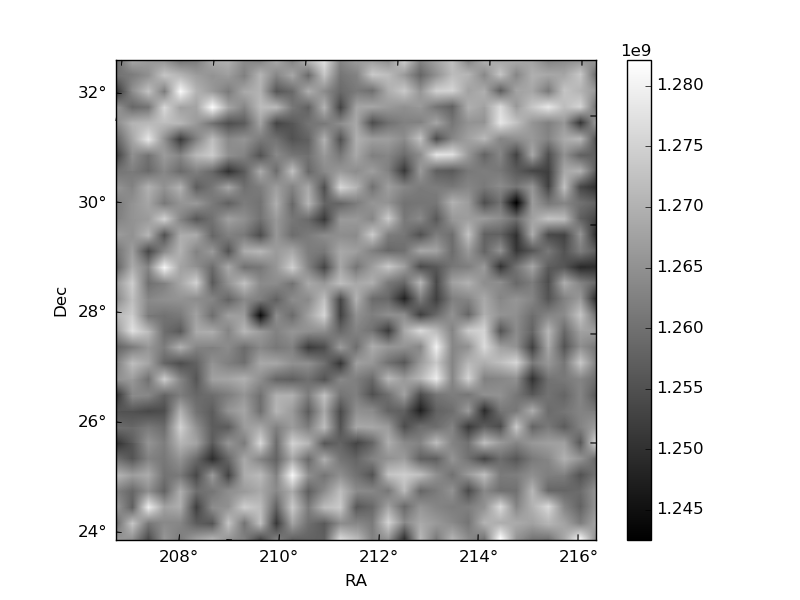
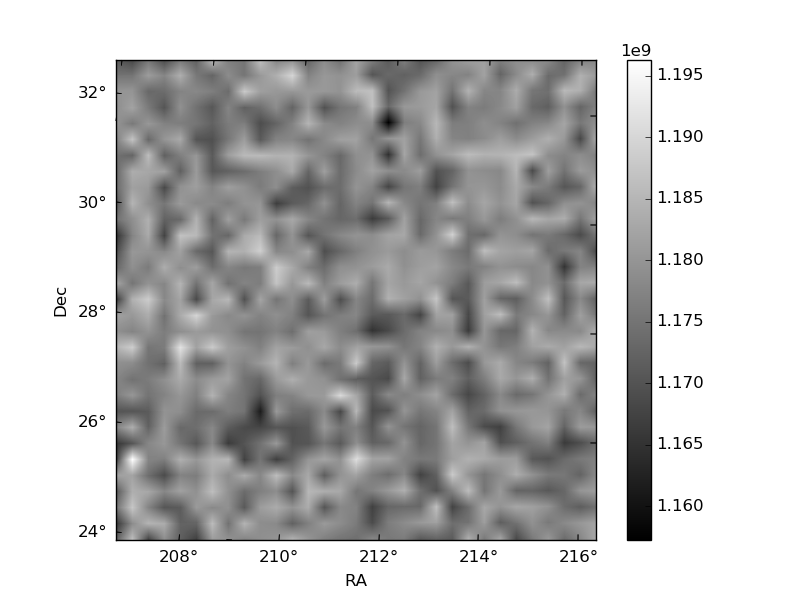
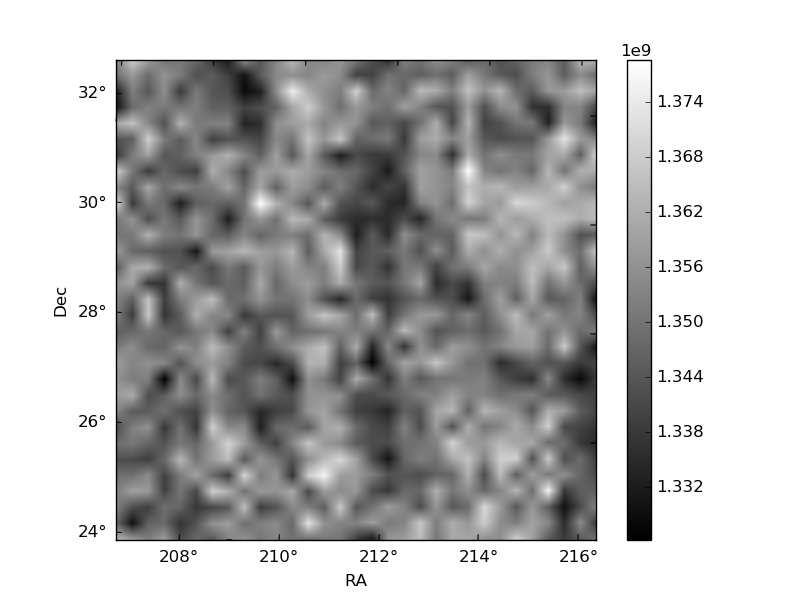
Histogram calculated using DETX and DETY for each event in the final _common_clean file
| Quadrant A | 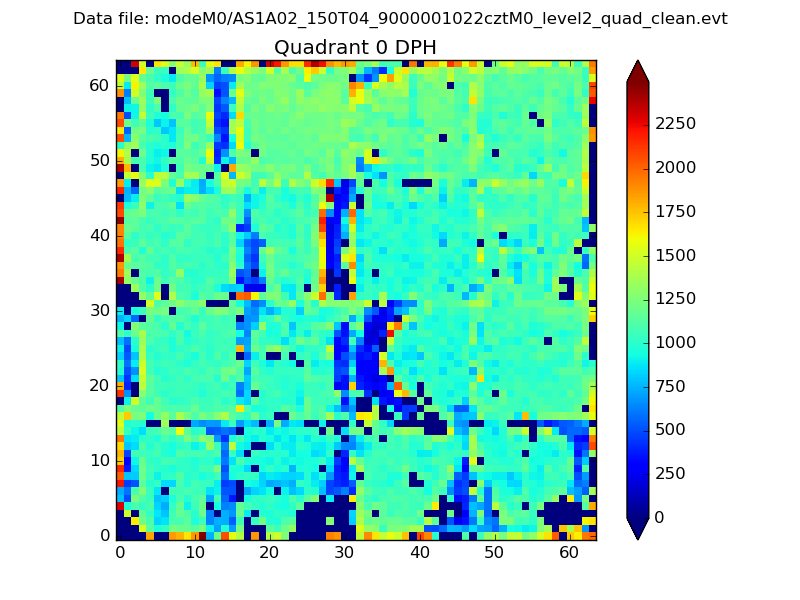 |
 |
Quadrant B |
|---|---|---|---|
| Quadrant D | 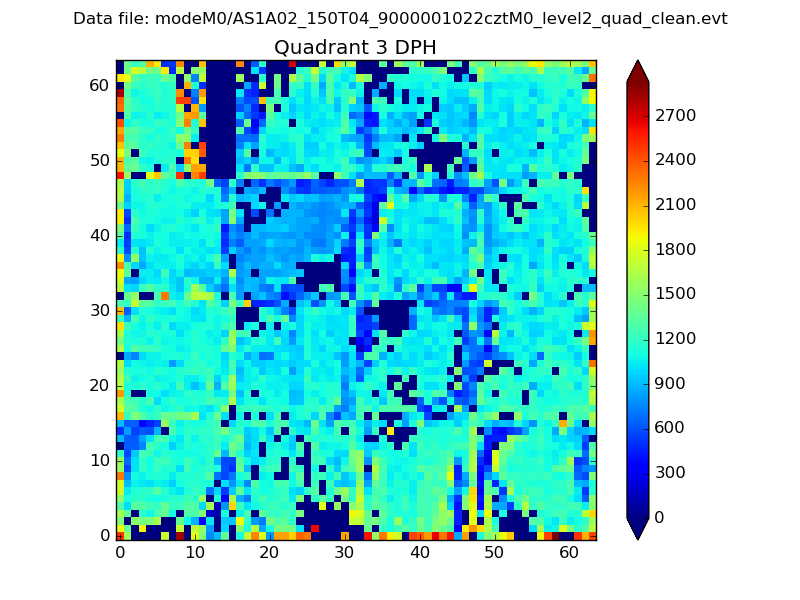 |
 |
Quadrant C |
| Plot type | Count rate plots | Images |
|---|---|---|
| Comparison with Poisson distribution Blue bars denote a histogram of data divided into 1 sec bins. Red curve is a Poisson curve with rate = median count rate of data. |
 |
 |
| Quadrant-wise count rates Data is divided into 100 sec bins |
 |
|
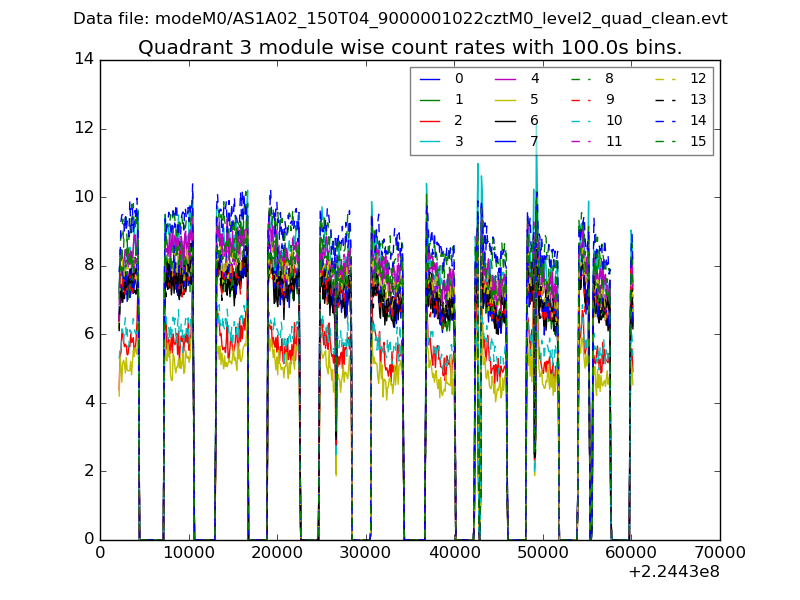
| Module-wise count rates for Quadrant A Data is divided into 100 sec bins |
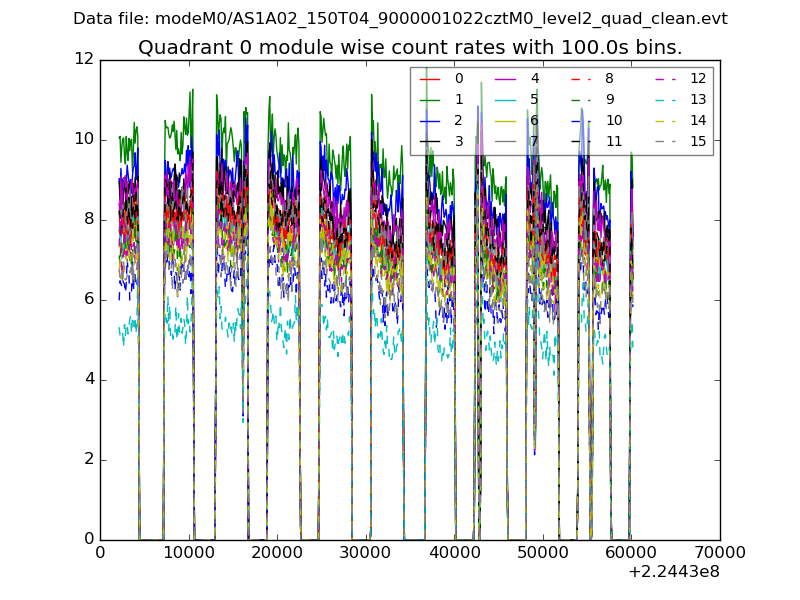 |
 |
| Module-wise count rates for Quadrant B Data is divided into 100 sec bins |
 |
 |
| Module-wise count rates for Quadrant C Data is divided into 100 sec bins |
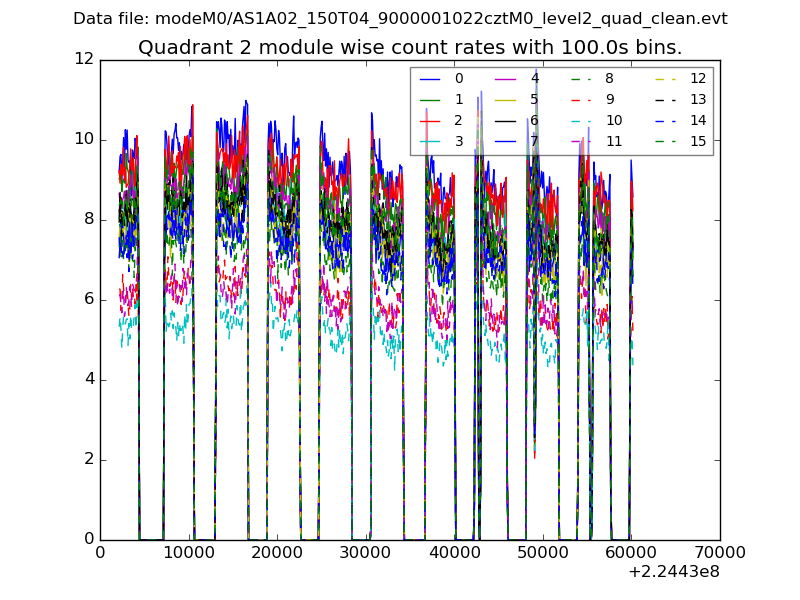 |
 |
| Module-wise count rates for Quadrant D Data is divided into 100 sec bins |
 |
 |
| Parameter | Plot |
|---|---|
| CZT HV Monitor |  |
| D_VDD | 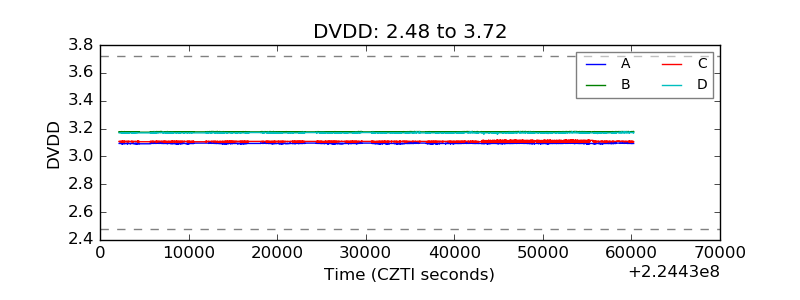 |
| Temperature 1 | 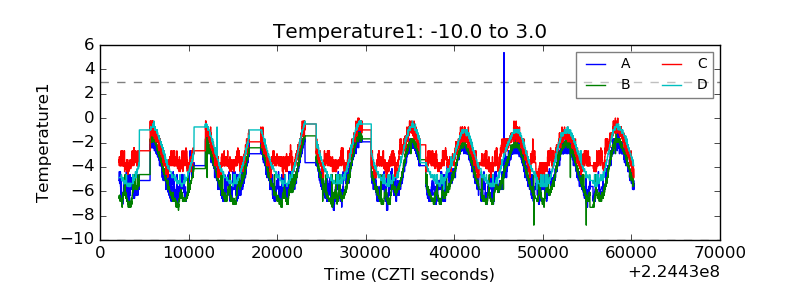 |
| Veto HV Monitor | 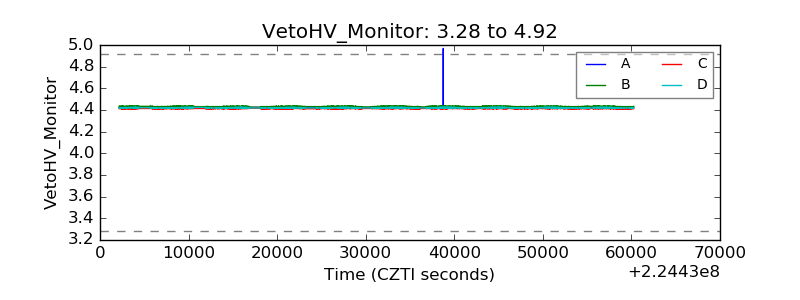 |
| Veto LLD | 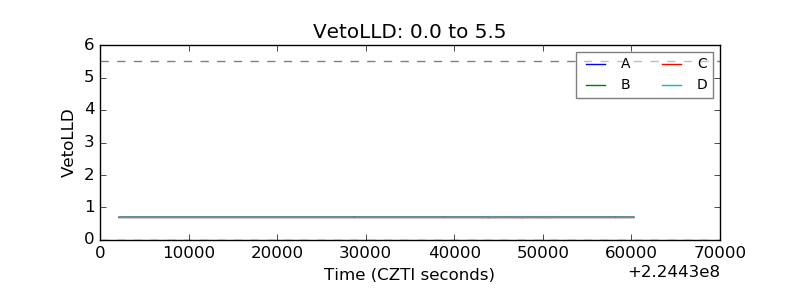 |
| Alpha Counter | 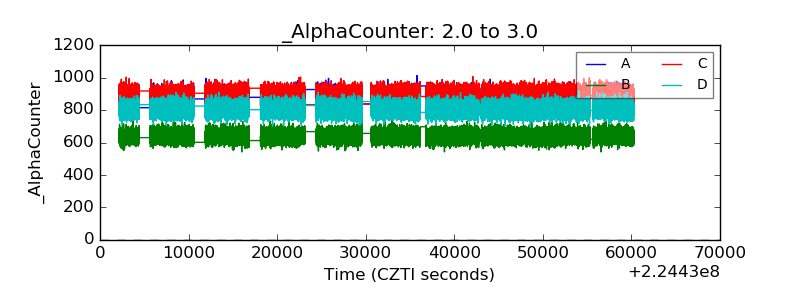 |
| _CPM_Rate | 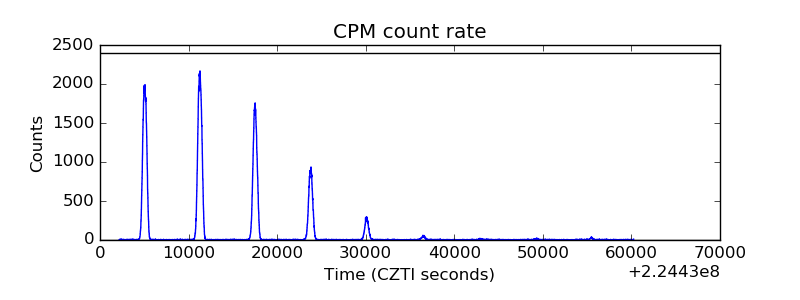 |
| CZT Counter |  |
| +2.5 Volts monitor |  |
| +5 Volts monitor | 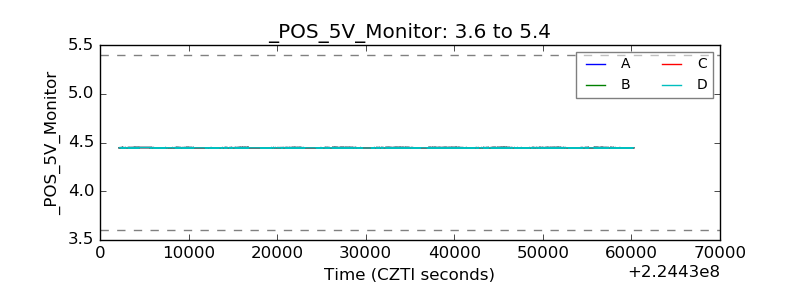 |
| _ROLL_ROT | 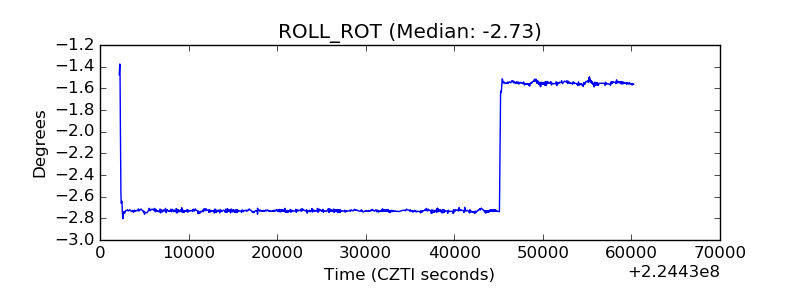 |
| _Roll_DEC |  |
| _Roll_RA | 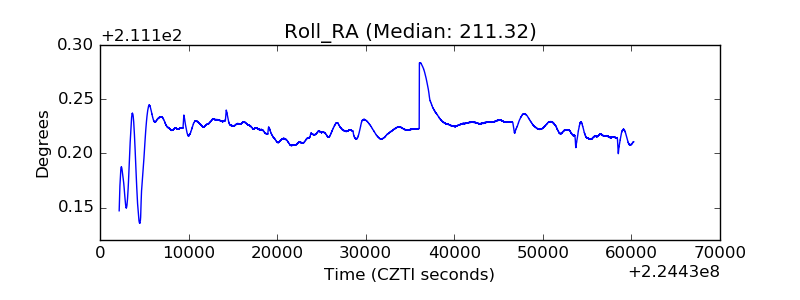 |
| Veto Counter |  |