| Param | Original file | Final file |
|---|---|---|
| Filename | modeM0/AS1A02_150T04_9000001022_07425cztM0_level2.evt | modeM0/AS1A02_150T04_9000001022_07425cztM0_level2_quad_clean.evt |
| Size (bytes) | 421,344,000 | 82,419,840 |
| Size | 401.8 MB | 78.6 MB |
| Events in quadrant A | 3,074,571 | 512,079 |
| Events in quadrant B | 3,025,482 | 534,087 |
| Events in quadrant C | 3,211,165 | 535,089 |
| Events in quadrant D | 3,058,662 | 512,926 |
| Mode SS | |||
|---|---|---|---|
| Quadrant | BADHDUFLAG | Total packets | Discarded packets |
| A | 0 | 116 | 0 |
| B | 0 | 116 | 0 |
| C | 0 | 116 | 0 |
| D | 0 | 116 | 0 |
| Mode M9 | |||
|---|---|---|---|
| Quadrant | BADHDUFLAG | Total packets | Discarded packets |
| A | 0 | 13 | 0 |
| B | 0 | 13 | 0 |
| C | 0 | 13 | 0 |
| D | 0 | 13 | 0 |
| Mode M0 | |||
|---|---|---|---|
| Quadrant | BADHDUFLAG | Total packets | Discarded packets |
| A | 0 | 12847 | 2 |
| B | 0 | 12722 | 1 |
| C | 0 | 13345 | 1 |
| D | 0 | 12898 | 1 |
| Quadrant | Total seconds | Saturated seconds | Saturation percentage |
|---|---|---|---|
| A | 5748 | 186 | 3.235908% |
| B | 5748 | 83 | 1.443981% |
| C | 5748 | 59 | 1.026444% |
| D | 5748 | 98 | 1.704941% |
Noise dominated data is calculated using 1-second bins in cleaned event files. If a bin has >2000 counts, and if more than 50% of those come from <1% of pixels, then it is considered to be noise-dominated and hence unusable.
| Quadrant | # 1 sec bins | Bins with >0 counts | Bins with >2000 counts | High rate bins dominated by noise | Noise dominated (total time) | Noise dominated (detector-on time) | Marked lightcurve |
|---|---|---|---|---|---|---|---|
| A | 7043 | 5749 | 106 | 106 | 1.51% | 1.84% | 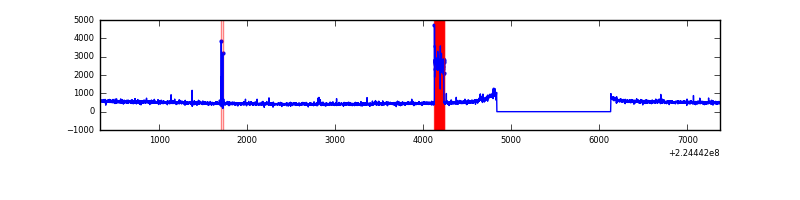 |
| B | 7043 | 5749 | 1 | 1 | 0.01% | 0.02% | 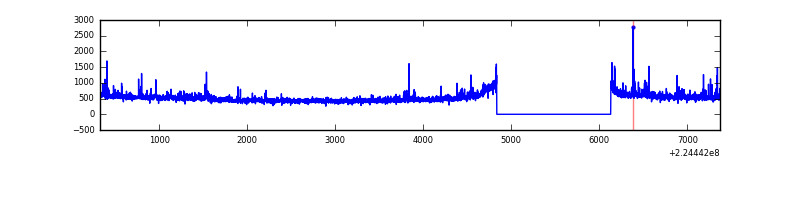 |
| C | 7043 | 5749 | 0 | 0 | 0.00% | 0.00% |  |
| D | 7043 | 5749 | 25 | 25 | 0.35% | 0.43% | 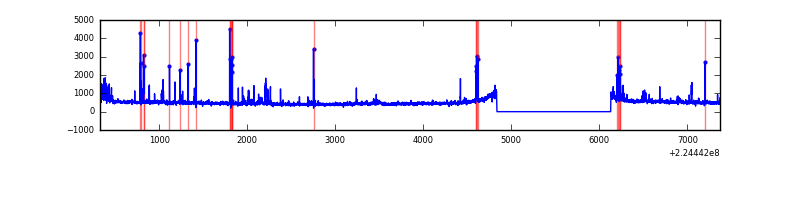 |
Top three noisy pixels from each quadrant. If the there are fewer than three noisy pixels in the level2.evt file, extra rows are filled as -1
| Pixel properties | Quadrant properties | ||||||
|---|---|---|---|---|---|---|---|
| Quadrant | DetID | PixID | Counts | Sigma | Mean | Median | Sigma |
| A | 15 | 234 | 303881 | 2096.82 | 716 | 702 | 144.6 |
| A | 0 | 226 | 7067 | 44.02 | 716 | 702 | 144.6 |
| A | 12 | 194 | 6314 | 38.81 | 716 | 702 | 144.6 |
| B | 10 | 245 | 73613 | 527.38 | 733 | 716 | 138.2 |
| B | 0 | 214 | 55847 | 398.85 | 733 | 716 | 138.2 |
| B | 4 | 173 | 17574 | 121.96 | 733 | 716 | 138.2 |
| C | 9 | 68 | 403802 | 2418.8 | 718 | 724 | 166.6 |
| C | 12 | 4 | 5831 | 30.64 | 718 | 724 | 166.6 |
| C | 13 | 61 | 5511 | 28.72 | 718 | 724 | 166.6 |
| D | 13 | 105 | 85906 | 489.19 | 713 | 694 | 174.2 |
| D | 2 | 136 | 73317 | 416.92 | 713 | 694 | 174.2 |
| D | 2 | 14 | 70459 | 400.51 | 713 | 694 | 174.2 |
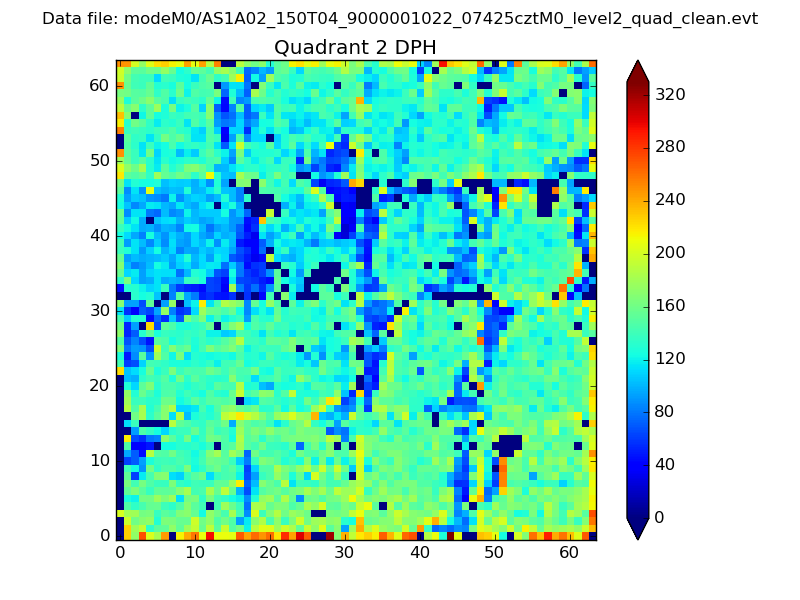
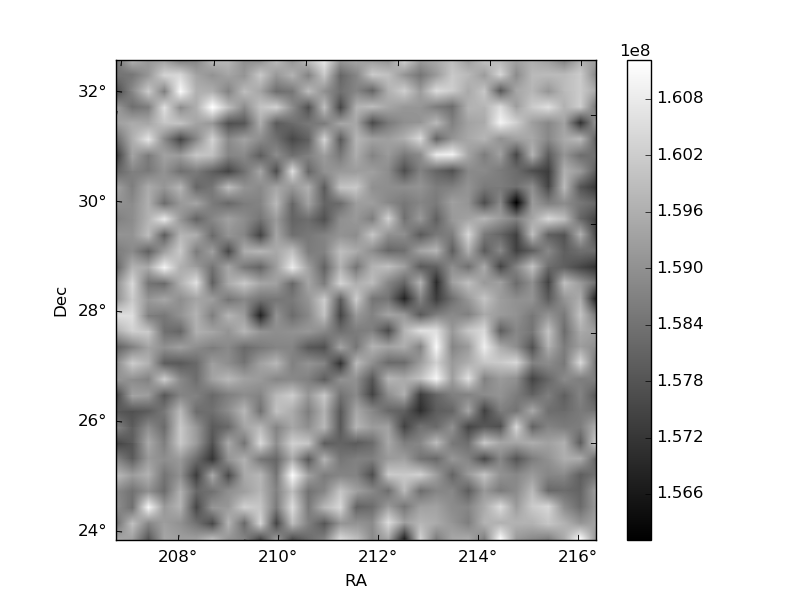
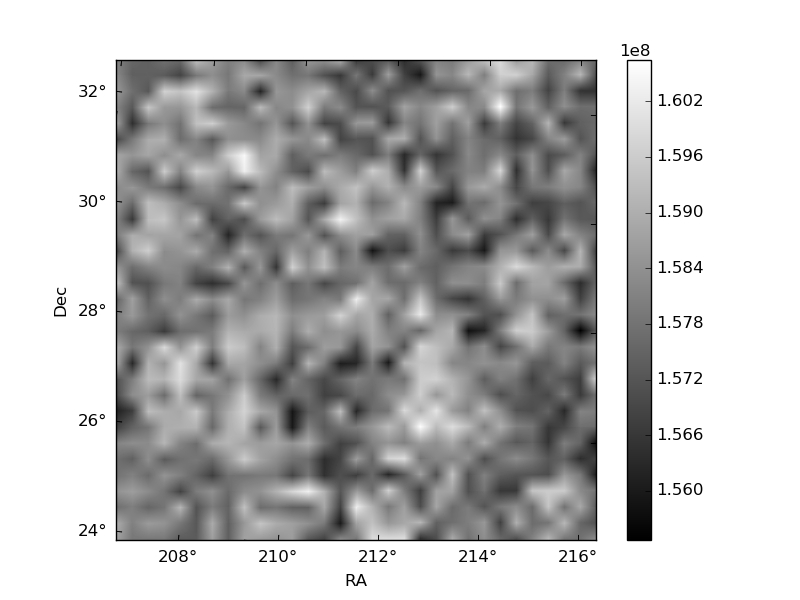
Histogram calculated using DETX and DETY for each event in the final _common_clean file
| Quadrant A | 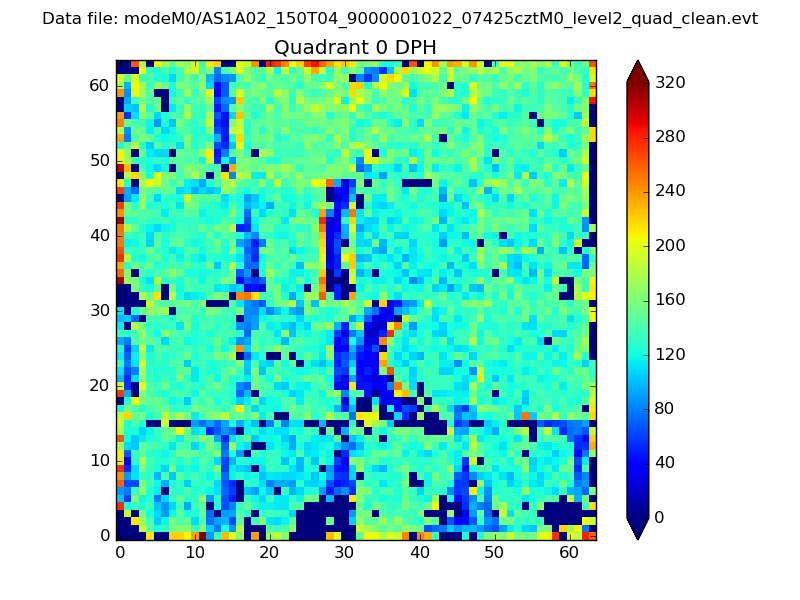 |
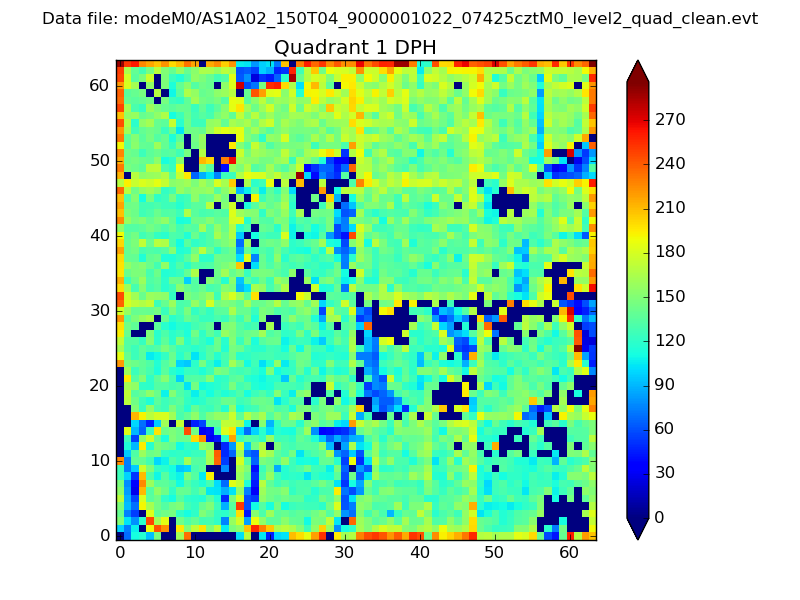 |
Quadrant B |
|---|---|---|---|
| Quadrant D | 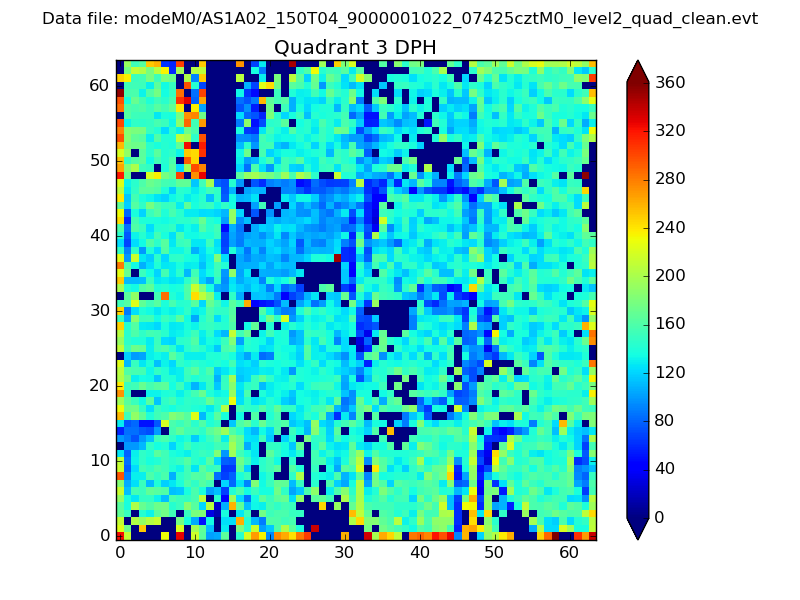 |
 |
Quadrant C |
| Plot type | Count rate plots | Images |
|---|---|---|
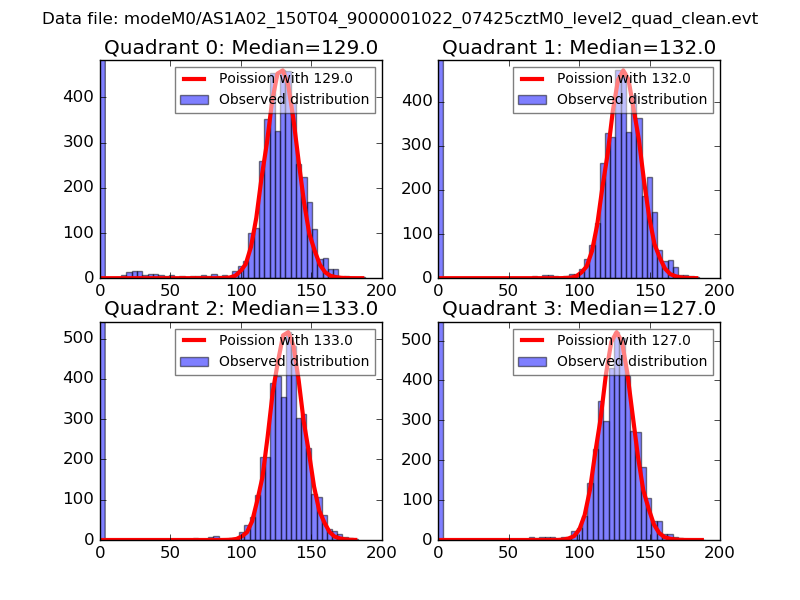
| Comparison with Poisson distribution Blue bars denote a histogram of data divided into 1 sec bins. Red curve is a Poisson curve with rate = median count rate of data. |
 |
 |
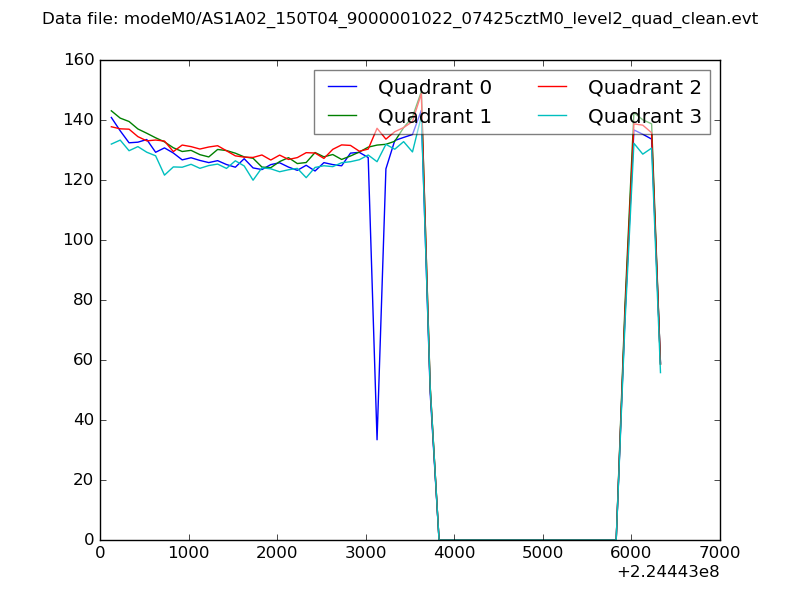
| Quadrant-wise count rates Data is divided into 100 sec bins |
 |
|
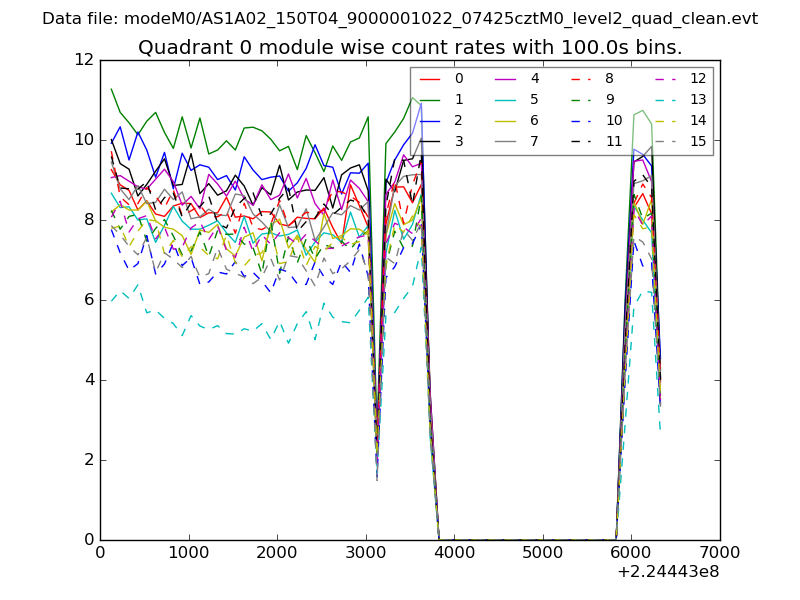
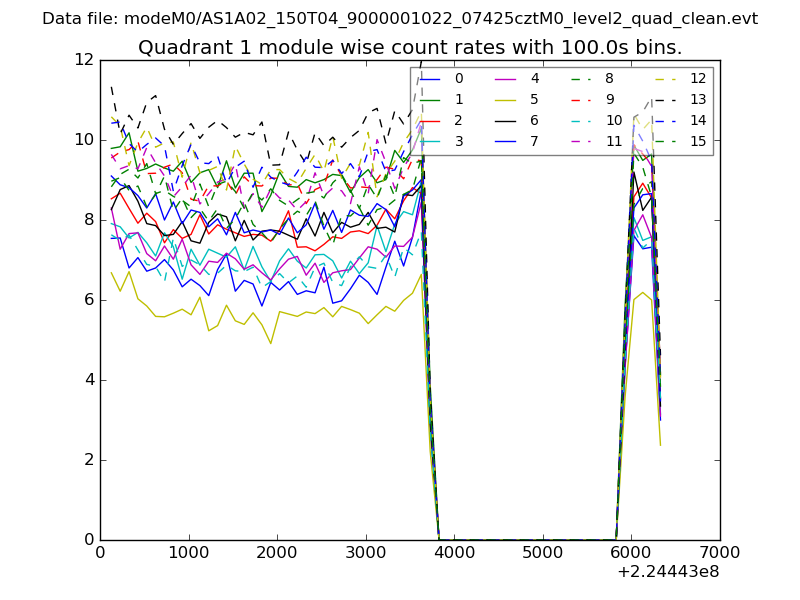
| Module-wise count rates for Quadrant A Data is divided into 100 sec bins |
 |
 |
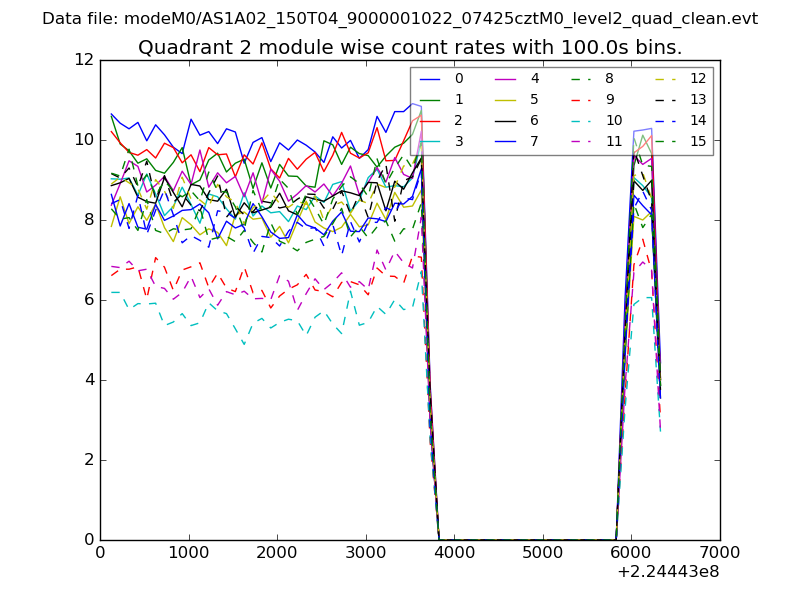
| Module-wise count rates for Quadrant B Data is divided into 100 sec bins |
 |
 |
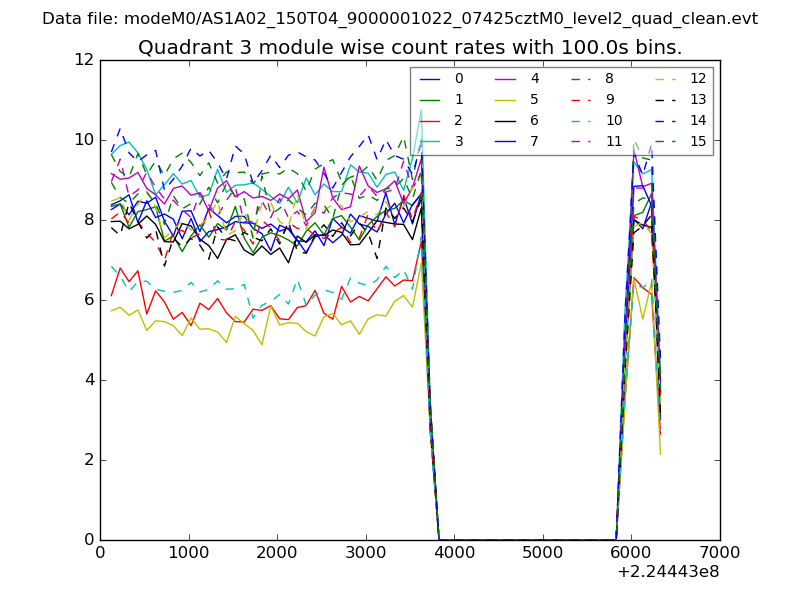
| Module-wise count rates for Quadrant C Data is divided into 100 sec bins |
 |
 |
| Module-wise count rates for Quadrant D Data is divided into 100 sec bins |
 |
 |
| Parameter | Plot |
|---|---|
| CZT HV Monitor | 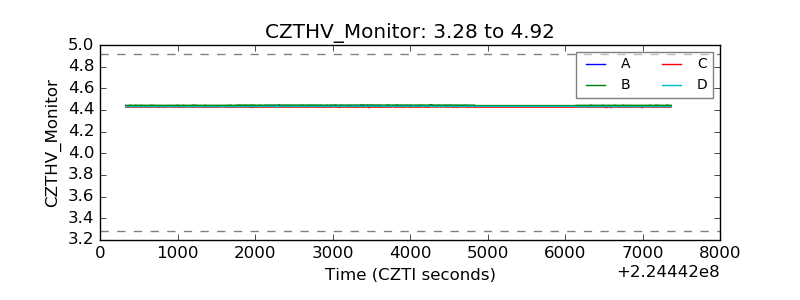 |
| D_VDD | 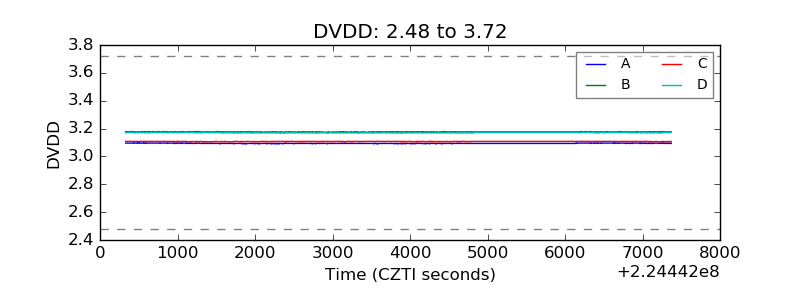 |
| Temperature 1 | 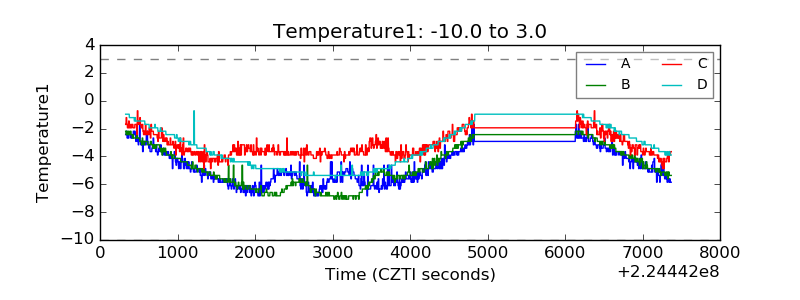 |
| Veto HV Monitor | 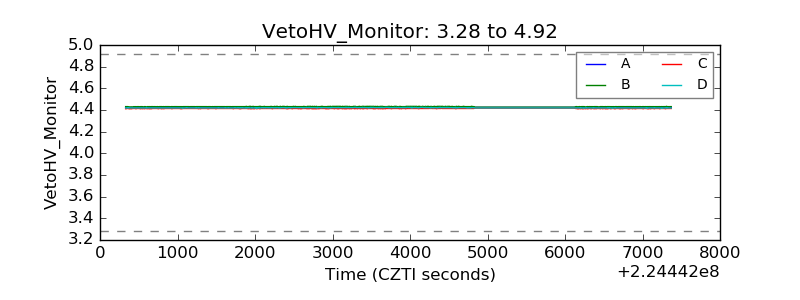 |
| Veto LLD | 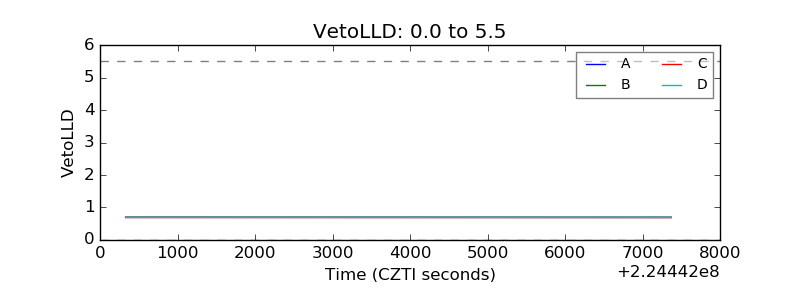 |
| Alpha Counter | 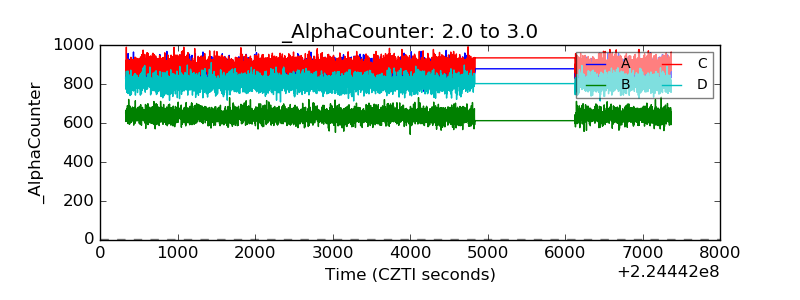 |
| _CPM_Rate | 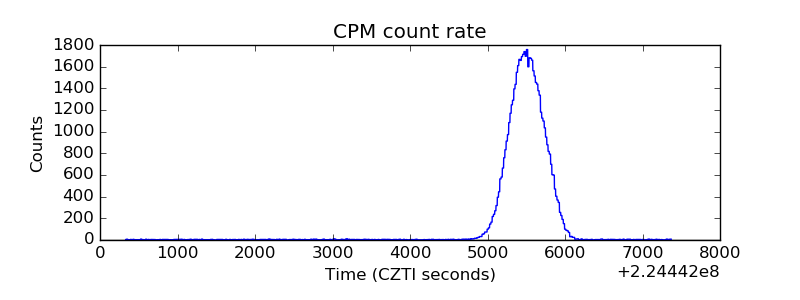 |
| CZT Counter | 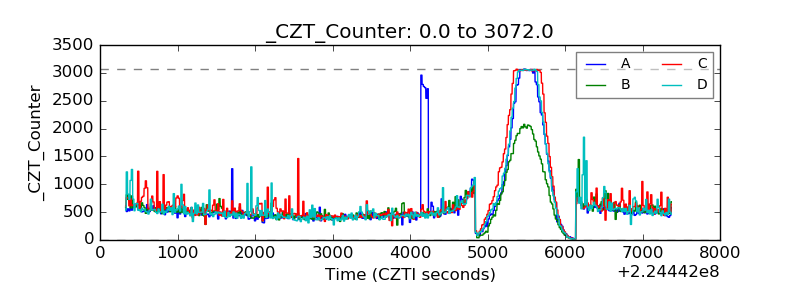 |
| +2.5 Volts monitor |  |
| +5 Volts monitor |  |
| _ROLL_ROT | 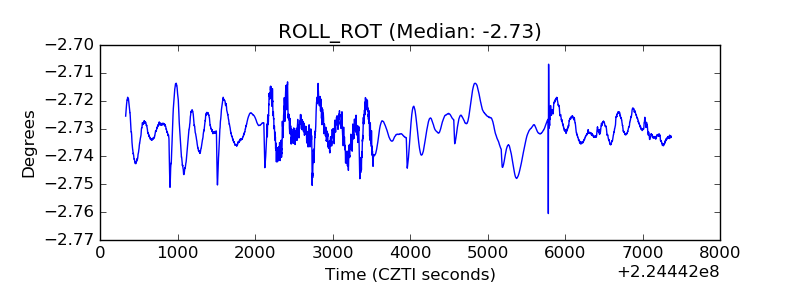 |
| _Roll_DEC | 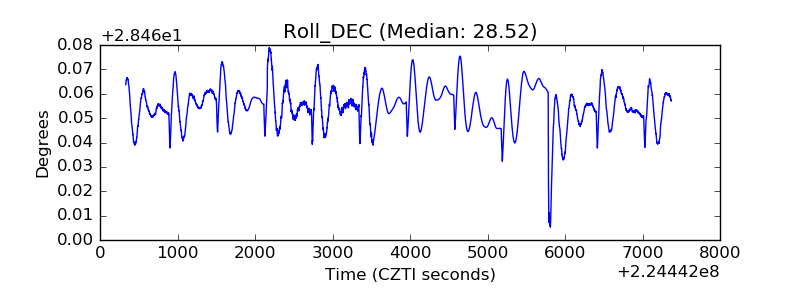 |
| _Roll_RA | 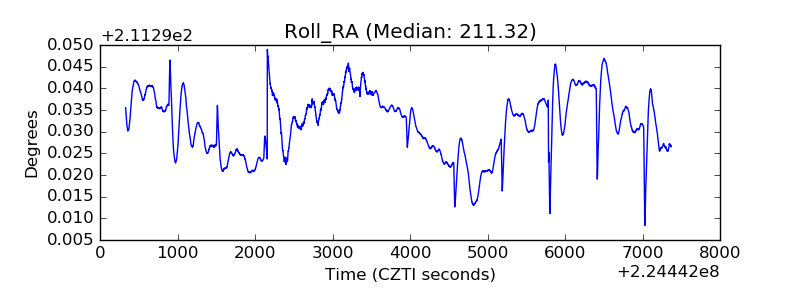 |
| Veto Counter | 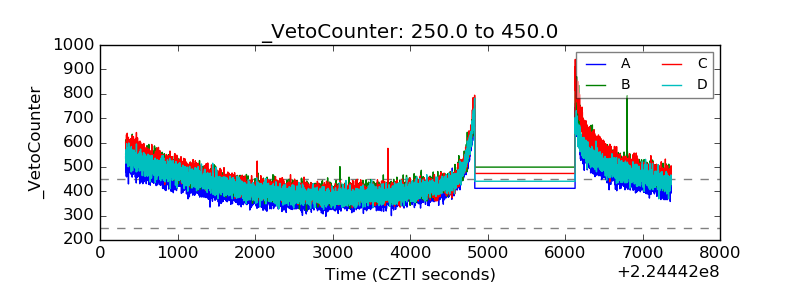 |