| Param | Original file | Final file |
|---|---|---|
| Filename | modeM0/AS1A02_150T04_9000001022_07426cztM0_level2.evt | modeM0/AS1A02_150T04_9000001022_07426cztM0_level2_quad_clean.evt |
| Size (bytes) | 506,286,720 | 92,986,560 |
| Size | 482.8 MB | 88.7 MB |
| Events in quadrant A | 3,161,618 | 588,220 |
| Events in quadrant B | 4,028,880 | 597,851 |
| Events in quadrant C | 4,233,859 | 598,781 |
| Events in quadrant D | 3,465,288 | 575,432 |
| Mode SS | |||
|---|---|---|---|
| Quadrant | BADHDUFLAG | Total packets | Discarded packets |
| A | 0 | 134 | 0 |
| B | 0 | 134 | 0 |
| C | 0 | 134 | 0 |
| D | 0 | 134 | 0 |
| Mode M9 | |||
|---|---|---|---|
| Quadrant | BADHDUFLAG | Total packets | Discarded packets |
| A | 0 | 26 | 0 |
| B | 0 | 26 | 0 |
| C | 0 | 26 | 0 |
| D | 0 | 26 | 0 |
| Mode M0 | |||
|---|---|---|---|
| Quadrant | BADHDUFLAG | Total packets | Discarded packets |
| A | 0 | 13810 | 3 |
| B | 0 | 16268 | 2 |
| C | 0 | 16932 | 2 |
| D | 0 | 14711 | 2 |
| Quadrant | Total seconds | Saturated seconds | Saturation percentage |
|---|---|---|---|
| A | 6535 | 117 | 1.790360% |
| B | 6535 | 215 | 3.289977% |
| C | 6535 | 101 | 1.545524% |
| D | 6535 | 148 | 2.264728% |
Noise dominated data is calculated using 1-second bins in cleaned event files. If a bin has >2000 counts, and if more than 50% of those come from <1% of pixels, then it is considered to be noise-dominated and hence unusable.
| Quadrant | # 1 sec bins | Bins with >0 counts | Bins with >2000 counts | High rate bins dominated by noise | Noise dominated (total time) | Noise dominated (detector-on time) | Marked lightcurve |
|---|---|---|---|---|---|---|---|
| A | 9095 | 6537 | 1 | 1 | 0.01% | 0.02% | 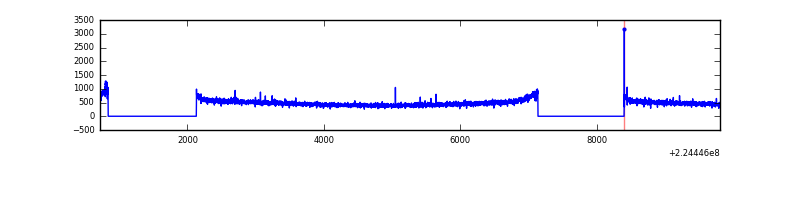 |
| B | 9095 | 6537 | 68 | 68 | 0.75% | 1.04% |  |
| C | 9095 | 6537 | 2 | 2 | 0.02% | 0.03% | 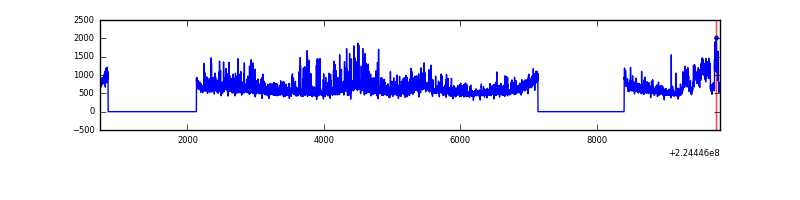 |
| D | 9095 | 6537 | 41 | 41 | 0.45% | 0.63% | 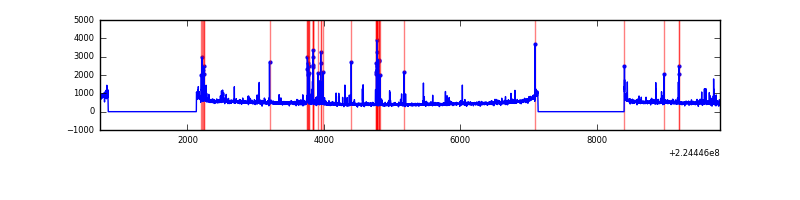 |
Top three noisy pixels from each quadrant. If the there are fewer than three noisy pixels in the level2.evt file, extra rows are filled as -1
| Pixel properties | Quadrant properties | ||||||
|---|---|---|---|---|---|---|---|
| Quadrant | DetID | PixID | Counts | Sigma | Mean | Median | Sigma |
| A | 15 | 234 | 13910 | 78.53 | 816 | 799 | 167.0 |
| A | 0 | 226 | 7948 | 42.82 | 816 | 799 | 167.0 |
| A | 12 | 194 | 7135 | 37.95 | 816 | 799 | 167.0 |
| B | 10 | 245 | 663424 | 4189.27 | 825 | 804 | 158.2 |
| B | 0 | 214 | 58642 | 365.67 | 825 | 804 | 158.2 |
| B | 4 | 170 | 36357 | 224.78 | 825 | 804 | 158.2 |
| C | 9 | 68 | 1072015 | 5708.33 | 810 | 815 | 187.7 |
| C | 13 | 61 | 6216 | 28.78 | 810 | 815 | 187.7 |
| C | 14 | 67 | 2028 | 6.46 | 810 | 815 | 187.7 |
| D | 2 | 14 | 201828 | 1018.53 | 806 | 783 | 197.4 |
| D | 2 | 136 | 68003 | 340.55 | 806 | 783 | 197.4 |
| D | 5 | 233 | 47885 | 238.63 | 806 | 783 | 197.4 |
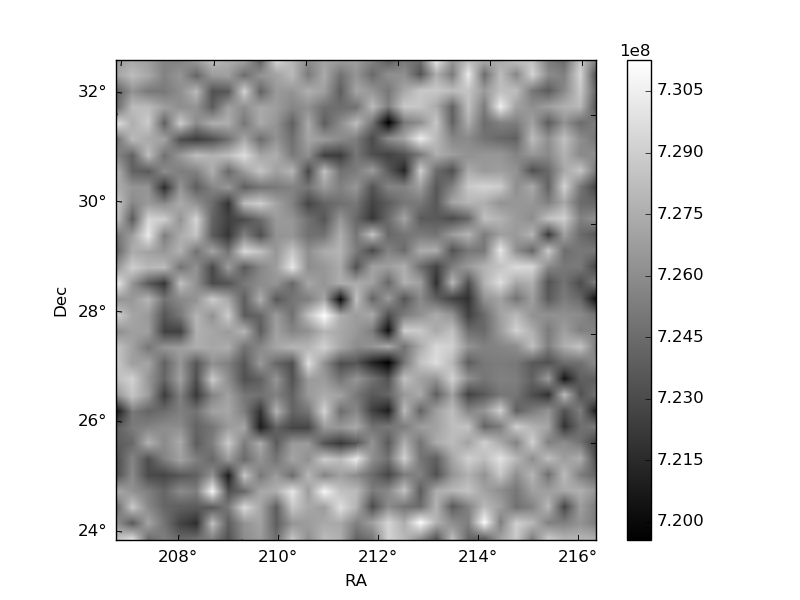
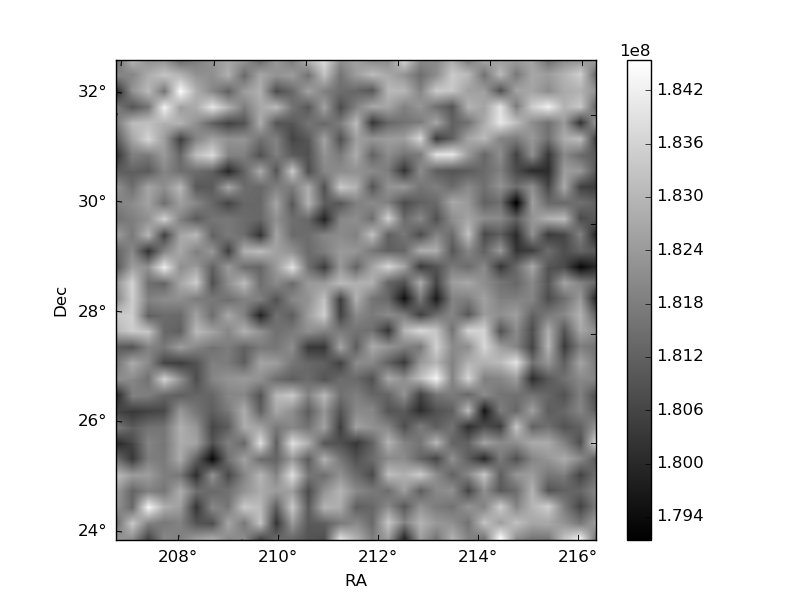
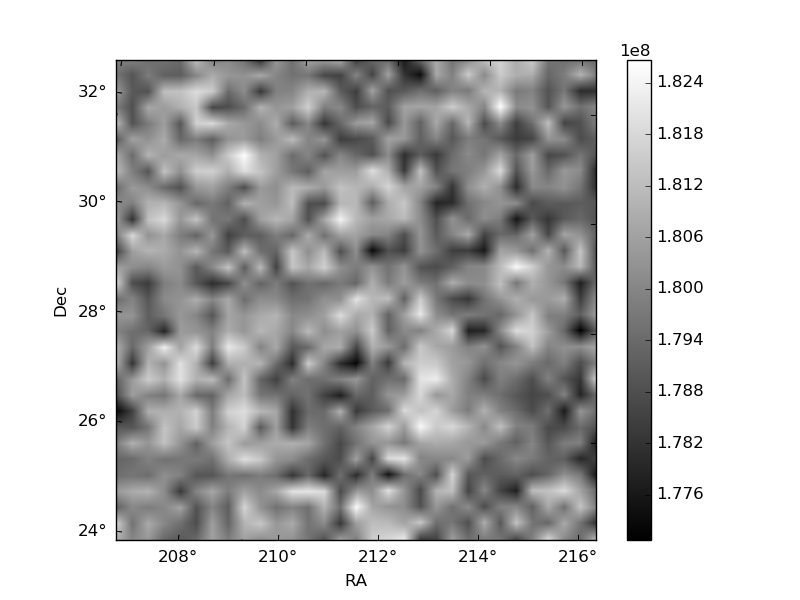
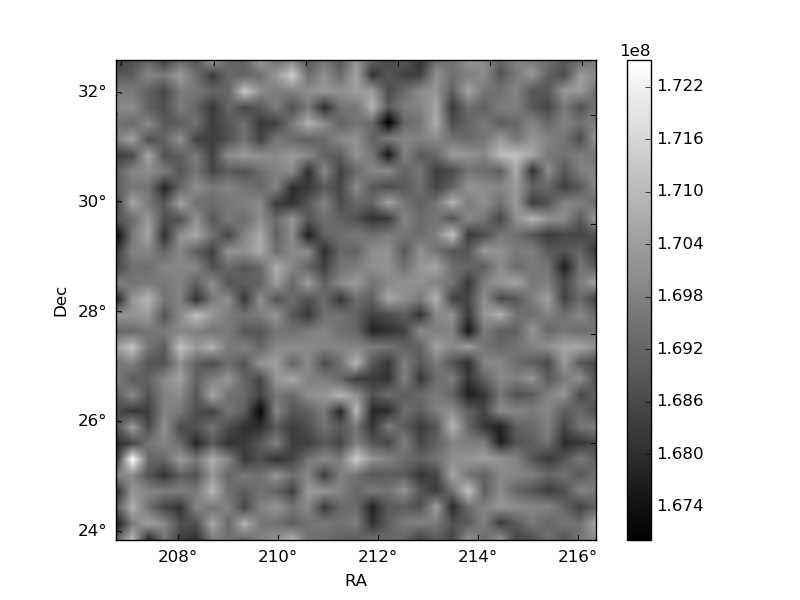
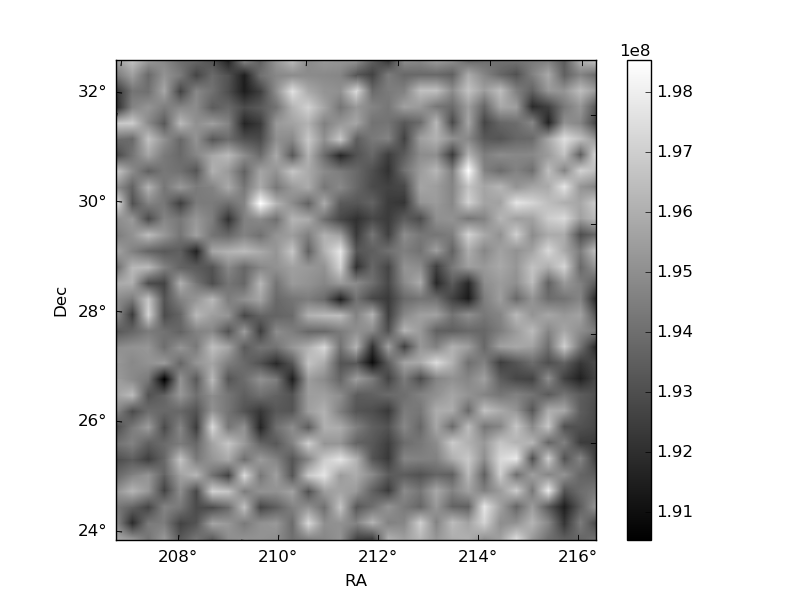
Histogram calculated using DETX and DETY for each event in the final _common_clean file
| Quadrant A | 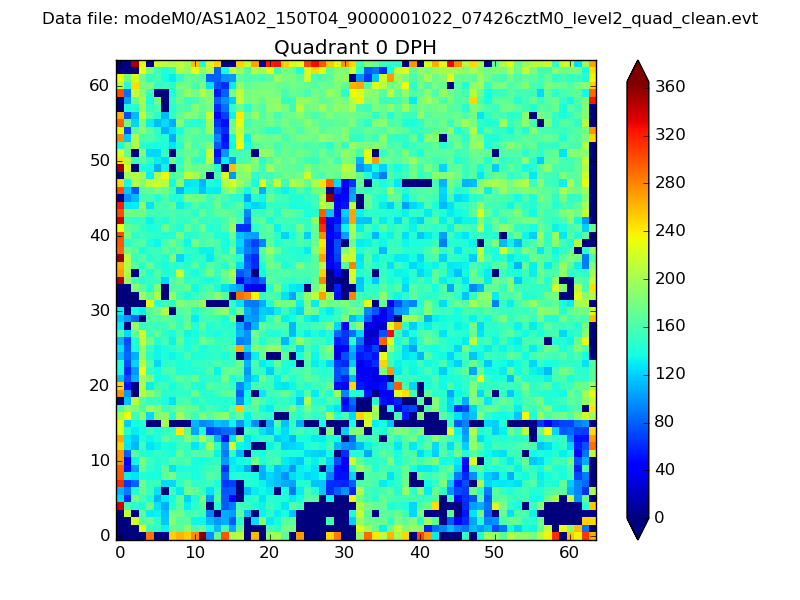 |
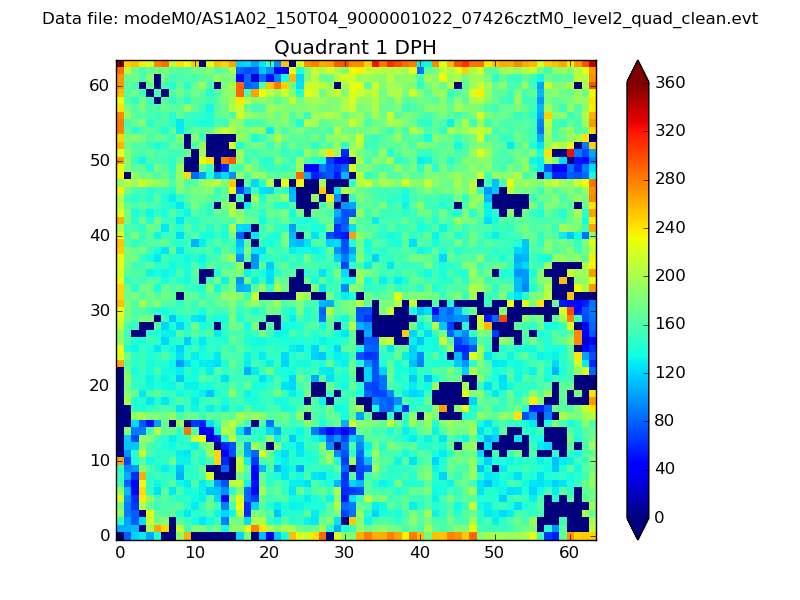 |
Quadrant B |
|---|---|---|---|
| Quadrant D | 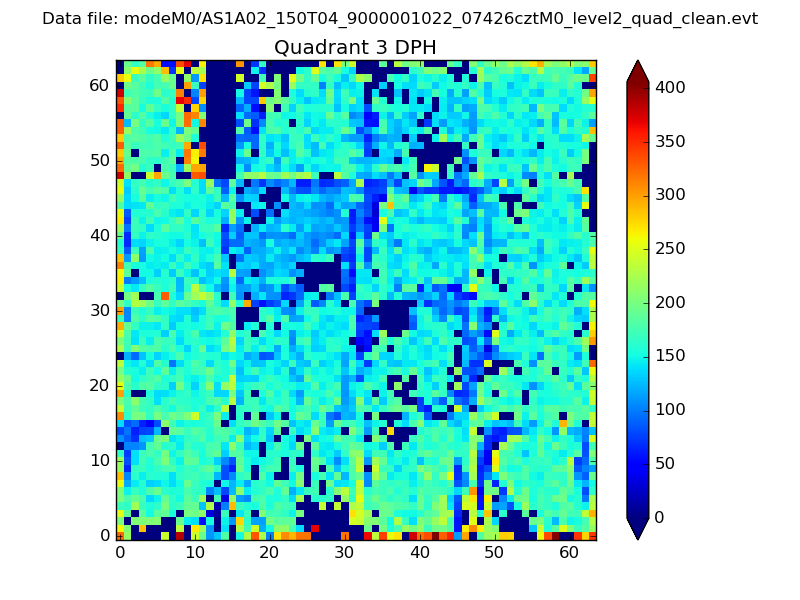 |
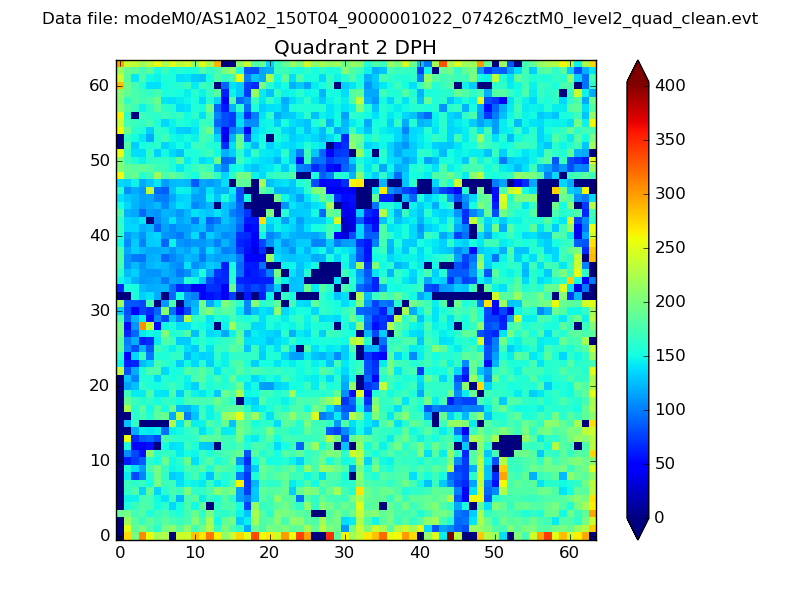 |
Quadrant C |
| Plot type | Count rate plots | Images |
|---|---|---|
| Comparison with Poisson distribution Blue bars denote a histogram of data divided into 1 sec bins. Red curve is a Poisson curve with rate = median count rate of data. |
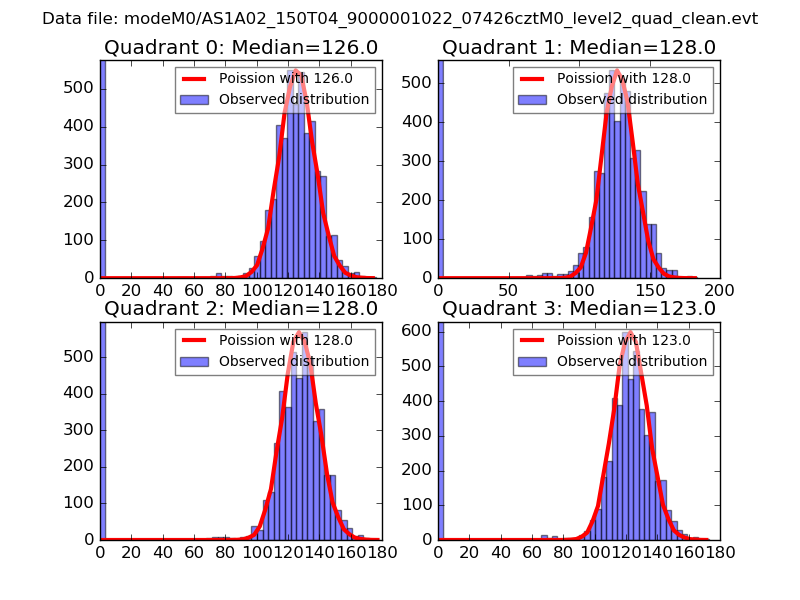 |
 |
| Quadrant-wise count rates Data is divided into 100 sec bins |
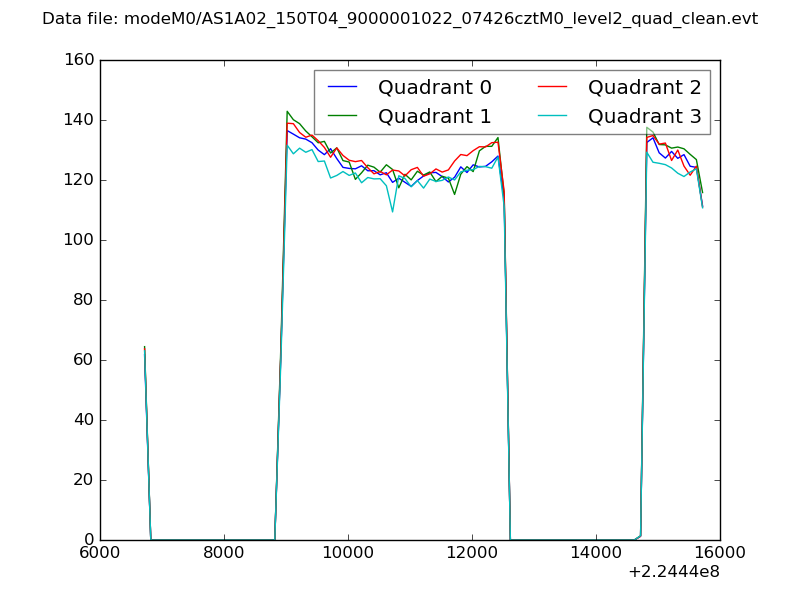 |
|
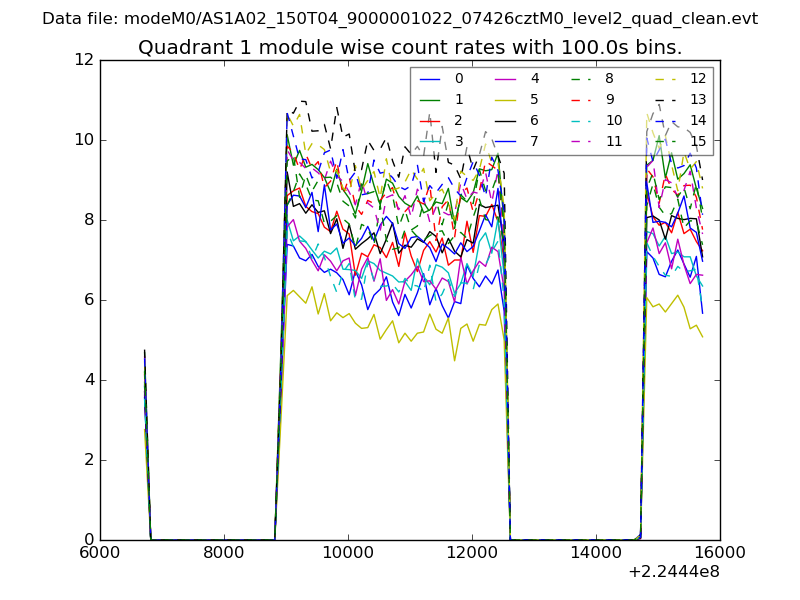
| Module-wise count rates for Quadrant A Data is divided into 100 sec bins |
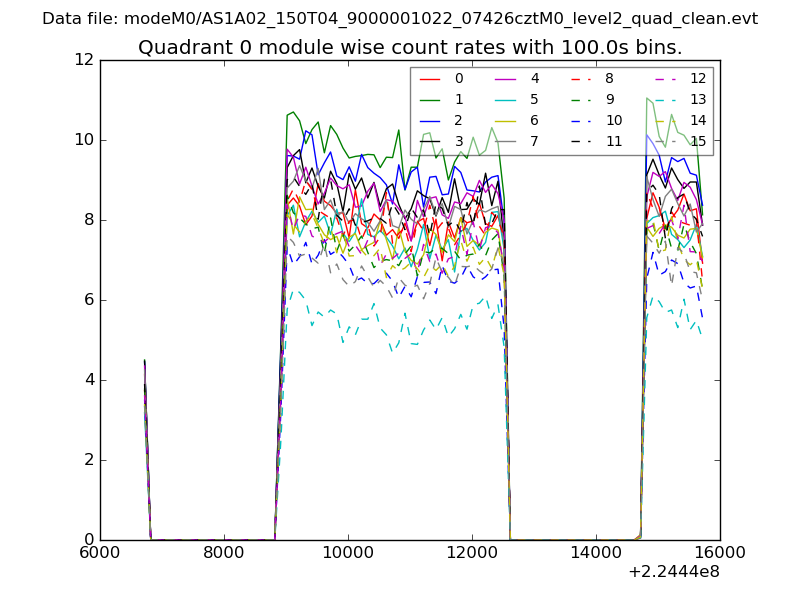 |
 |
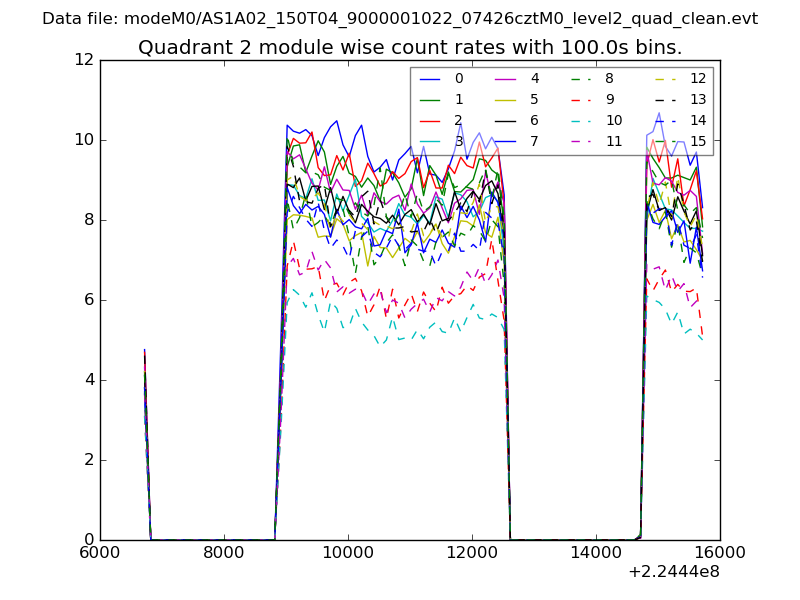
| Module-wise count rates for Quadrant B Data is divided into 100 sec bins |
 |
 |
| Module-wise count rates for Quadrant C Data is divided into 100 sec bins |
 |
 |
| Module-wise count rates for Quadrant D Data is divided into 100 sec bins |
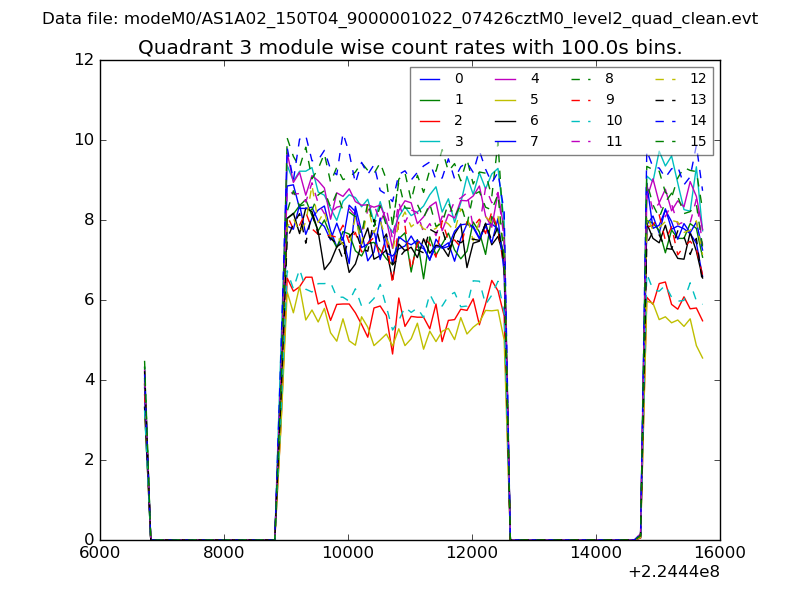 |
 |
| Parameter | Plot |
|---|---|
| CZT HV Monitor | 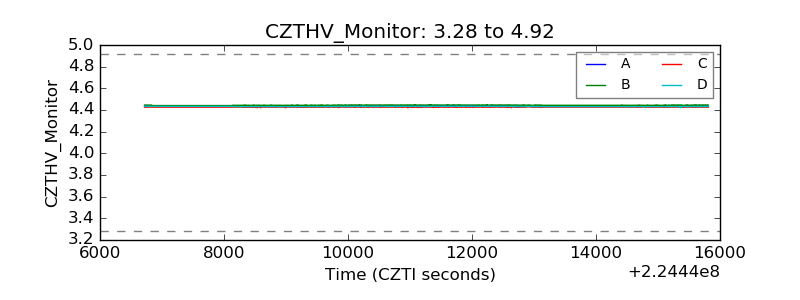 |
| D_VDD | 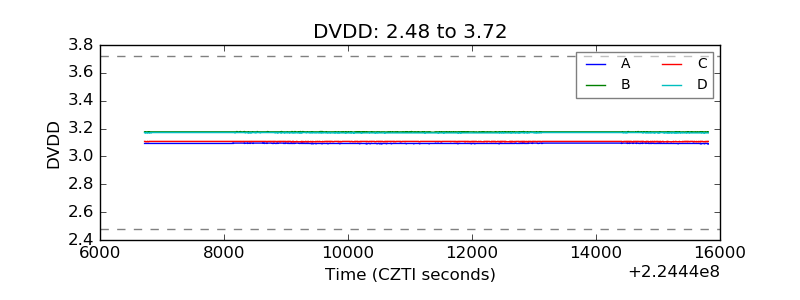 |
| Temperature 1 | 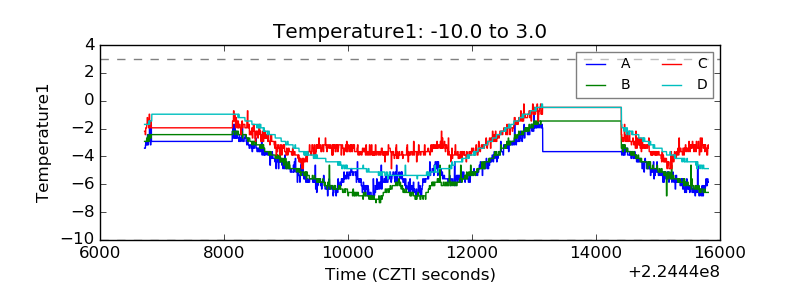 |
| Veto HV Monitor |  |
| Veto LLD | 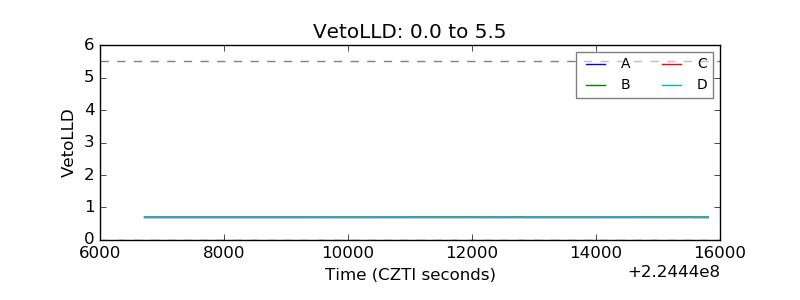 |
| Alpha Counter | 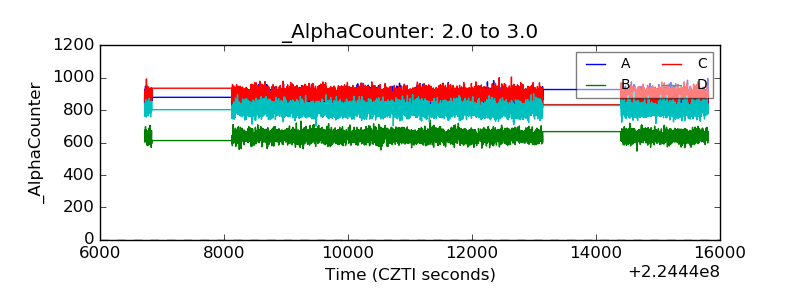 |
| _CPM_Rate | 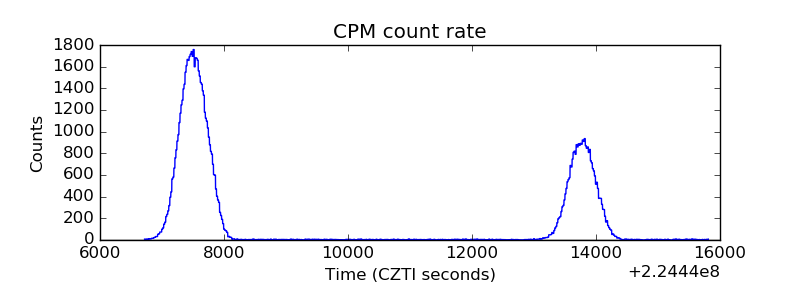 |
| CZT Counter | 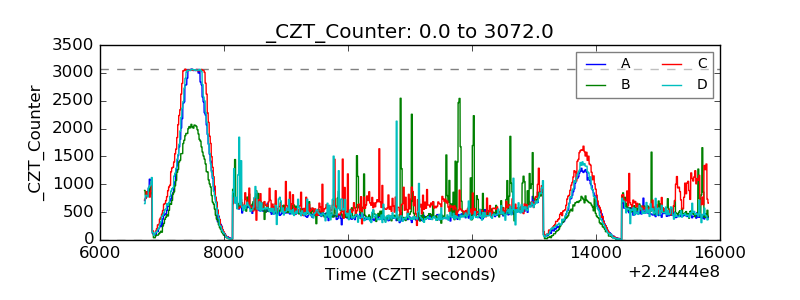 |
| +2.5 Volts monitor |  |
| +5 Volts monitor |  |
| _ROLL_ROT | 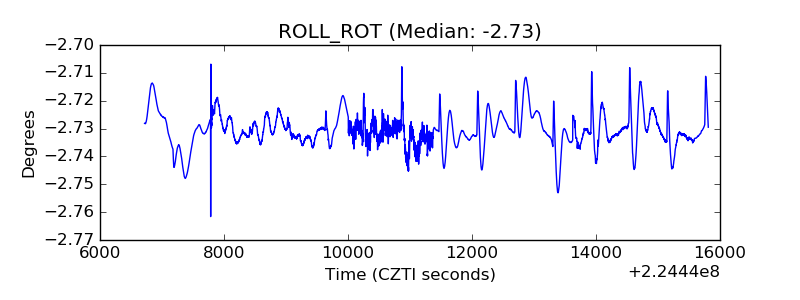 |
| _Roll_DEC | 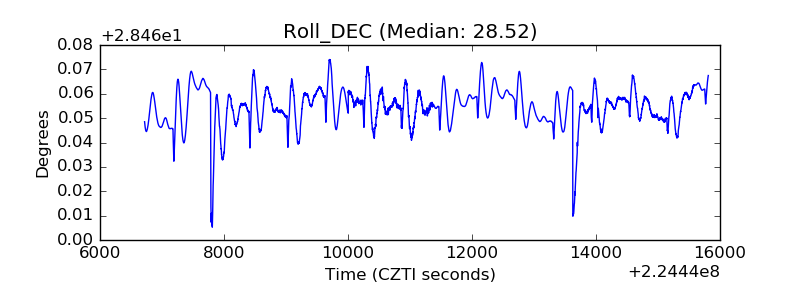 |
| _Roll_RA | 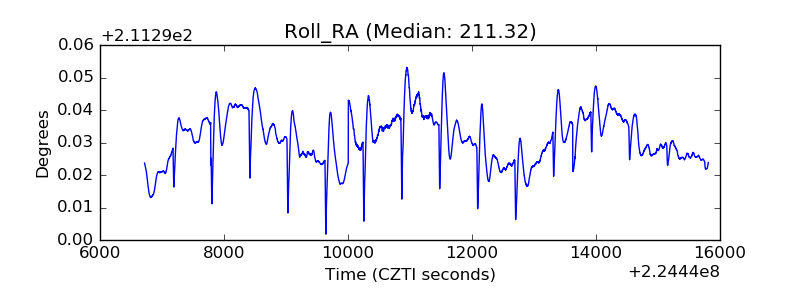 |
| Veto Counter | 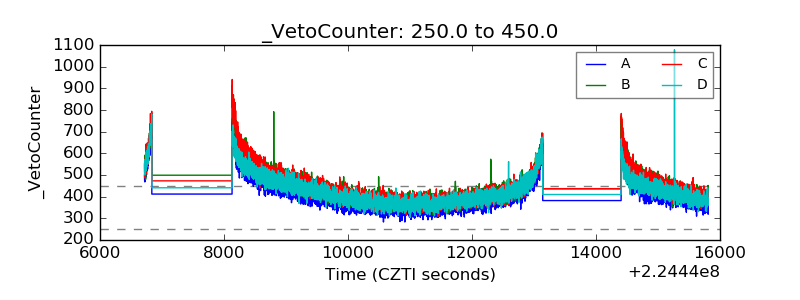 |