| Param | Original file | Final file |
|---|---|---|
| Filename | modeM0/AS1A02_150T04_9000001022_07427cztM0_level2.evt | modeM0/AS1A02_150T04_9000001022_07427cztM0_level2_quad_clean.evt |
| Size (bytes) | 477,253,440 | 95,307,840 |
| Size | 455.1 MB | 90.9 MB |
| Events in quadrant A | 3,051,164 | 605,959 |
| Events in quadrant B | 3,233,510 | 621,343 |
| Events in quadrant C | 3,813,624 | 616,355 |
| Events in quadrant D | 3,908,067 | 583,330 |
| Mode SS | |||
|---|---|---|---|
| Quadrant | BADHDUFLAG | Total packets | Discarded packets |
| A | 0 | 130 | 0 |
| B | 0 | 130 | 0 |
| C | 0 | 130 | 0 |
| D | 0 | 130 | 0 |
| Mode M9 | |||
|---|---|---|---|
| Quadrant | BADHDUFLAG | Total packets | Discarded packets |
| A | 0 | 20 | 0 |
| B | 0 | 20 | 0 |
| C | 0 | 20 | 0 |
| D | 0 | 21 | 0 |
| Mode M0 | |||
|---|---|---|---|
| Quadrant | BADHDUFLAG | Total packets | Discarded packets |
| A | 0 | 13664 | 3 |
| B | 0 | 14051 | 2 |
| C | 0 | 15633 | 2 |
| D | 0 | 15884 | 2 |
| Quadrant | Total seconds | Saturated seconds | Saturation percentage |
|---|---|---|---|
| A | 6593 | 30 | 0.455028% |
| B | 6593 | 36 | 0.546034% |
| C | 6593 | 33 | 0.500531% |
| D | 6593 | 159 | 2.411649% |
Noise dominated data is calculated using 1-second bins in cleaned event files. If a bin has >2000 counts, and if more than 50% of those come from <1% of pixels, then it is considered to be noise-dominated and hence unusable.
| Quadrant | # 1 sec bins | Bins with >0 counts | Bins with >2000 counts | High rate bins dominated by noise | Noise dominated (total time) | Noise dominated (detector-on time) | Marked lightcurve |
|---|---|---|---|---|---|---|---|
| A | 7619 | 6595 | 1 | 1 | 0.01% | 0.02% | 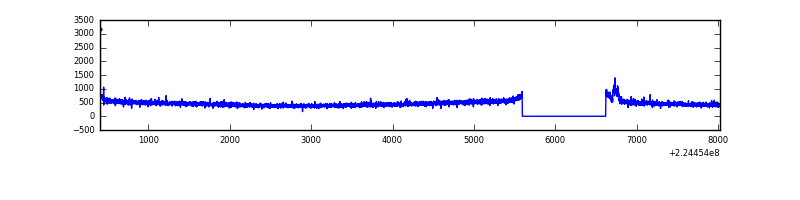 |
| B | 7619 | 6595 | 2 | 2 | 0.03% | 0.03% | 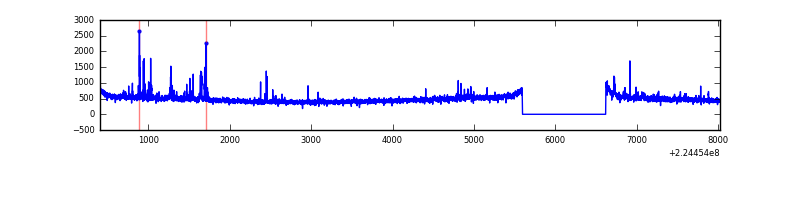 |
| C | 7619 | 6595 | 2 | 2 | 0.03% | 0.03% | 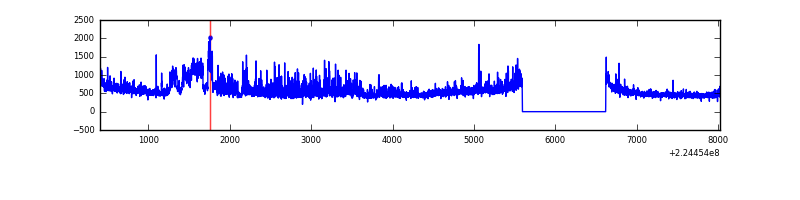 |
| D | 7619 | 6595 | 124 | 124 | 1.63% | 1.88% | 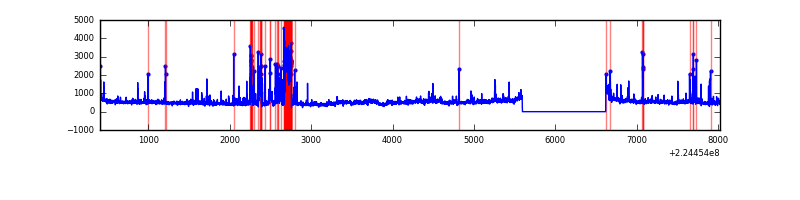 |
Top three noisy pixels from each quadrant. If the there are fewer than three noisy pixels in the level2.evt file, extra rows are filled as -1
| Pixel properties | Quadrant properties | ||||||
|---|---|---|---|---|---|---|---|
| Quadrant | DetID | PixID | Counts | Sigma | Mean | Median | Sigma |
| A | 15 | 234 | 32314 | 198.85 | 781 | 766 | 158.6 |
| A | 0 | 226 | 7268 | 40.98 | 781 | 766 | 158.6 |
| A | 12 | 194 | 7011 | 39.36 | 781 | 766 | 158.6 |
| B | 10 | 245 | 51662 | 333.68 | 793 | 772 | 152.5 |
| B | 0 | 214 | 38799 | 249.34 | 793 | 772 | 152.5 |
| B | 4 | 81 | 25954 | 165.11 | 793 | 772 | 152.5 |
| C | 9 | 68 | 799738 | 4468.99 | 771 | 776 | 178.8 |
| C | 13 | 61 | 5914 | 28.74 | 771 | 776 | 178.8 |
| C | 7 | 87 | 5161 | 24.53 | 771 | 776 | 178.8 |
| D | 2 | 16 | 346245 | 1843.87 | 761 | 738 | 187.4 |
| D | 2 | 14 | 305285 | 1625.28 | 761 | 738 | 187.4 |
| D | 7 | 223 | 136416 | 724.07 | 761 | 738 | 187.4 |
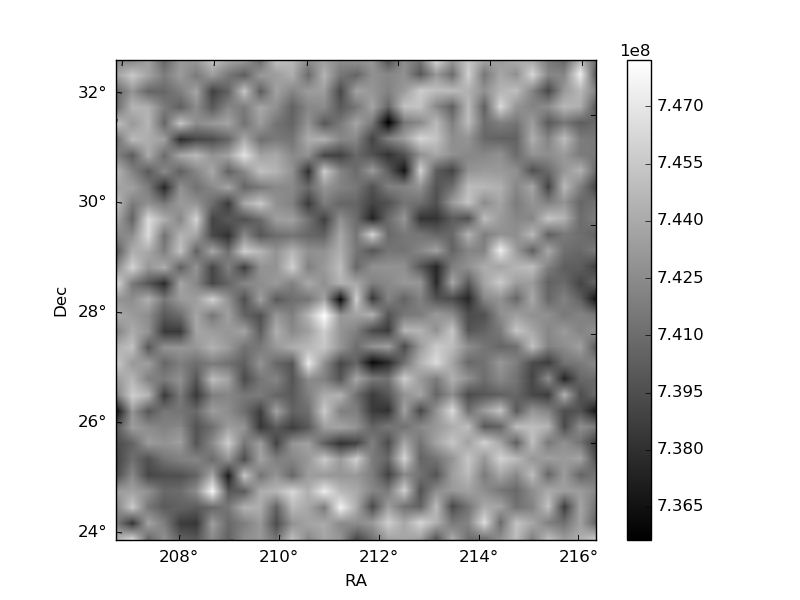
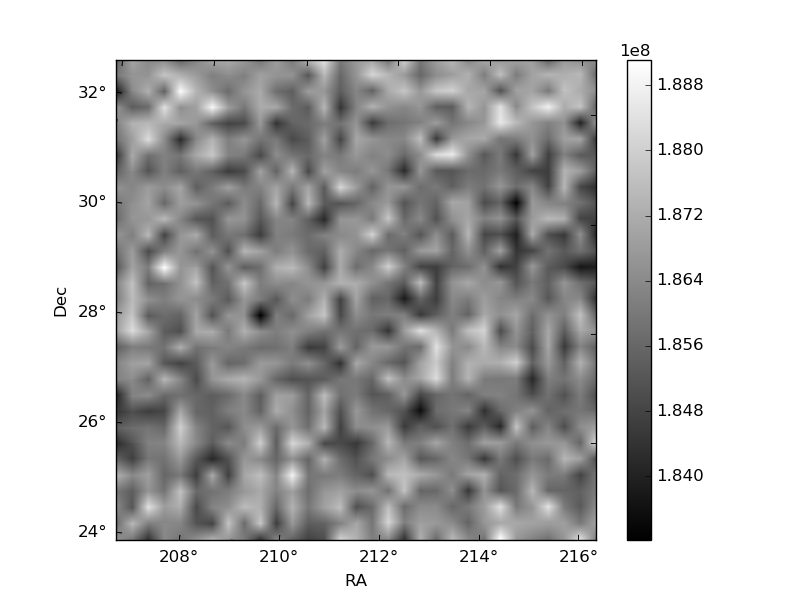
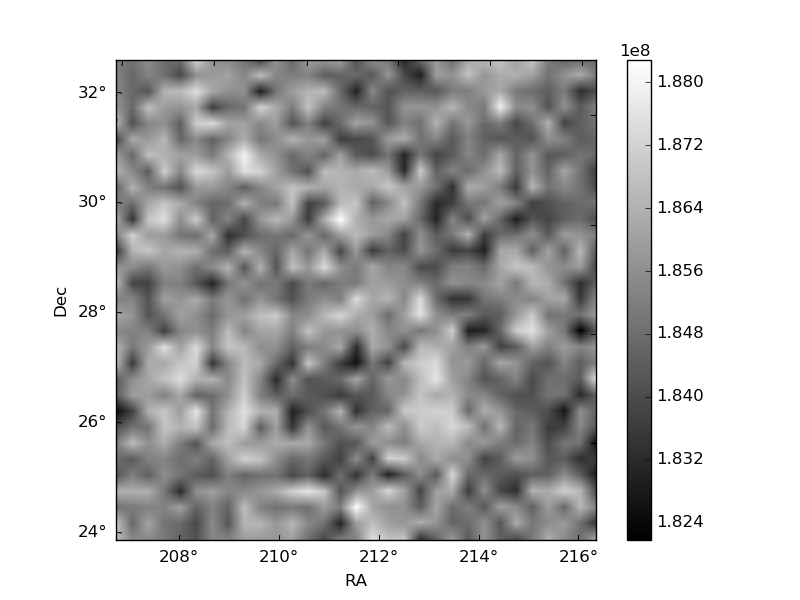
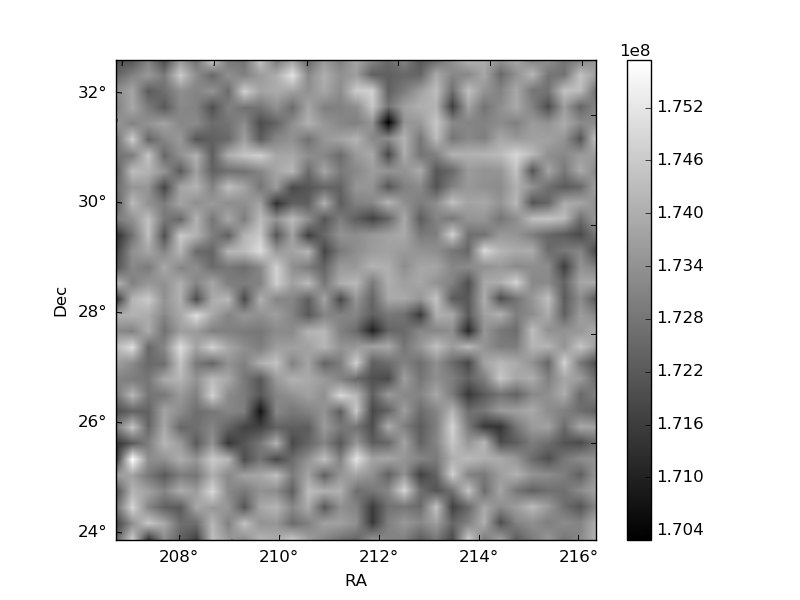
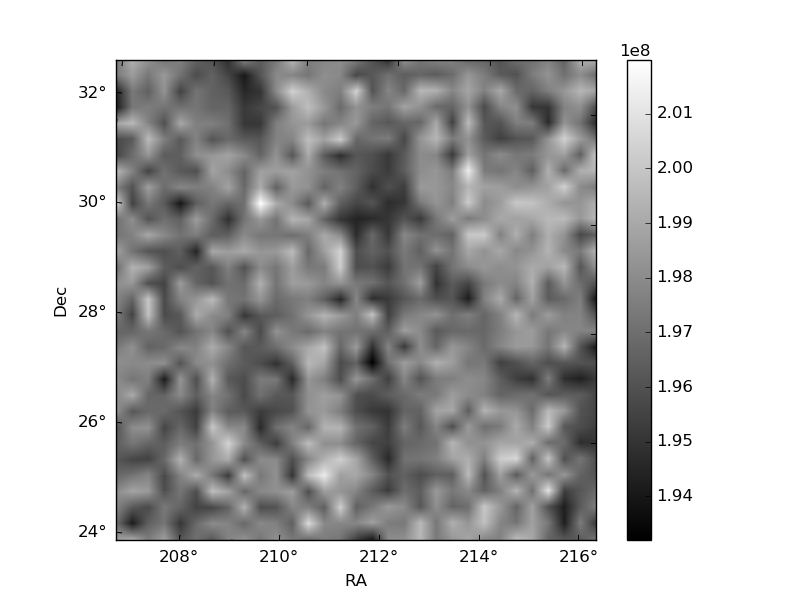
Histogram calculated using DETX and DETY for each event in the final _common_clean file
| Quadrant A | 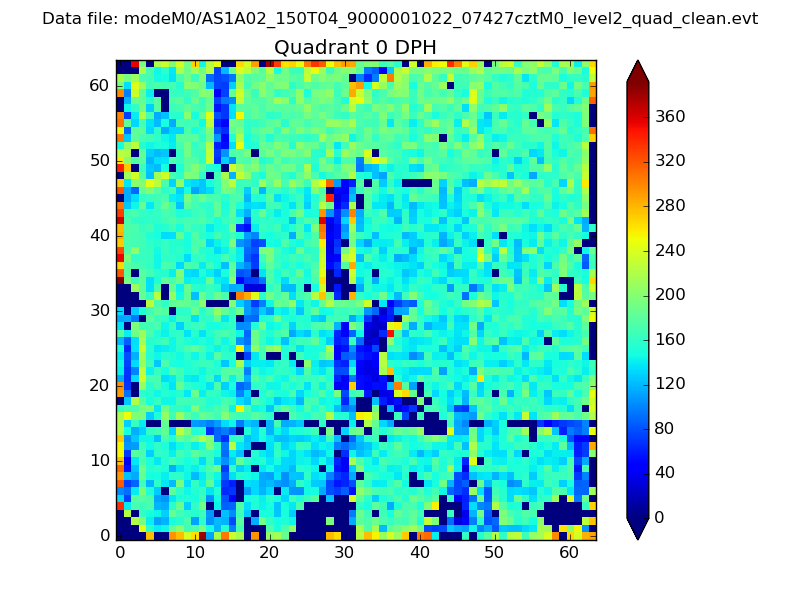 |
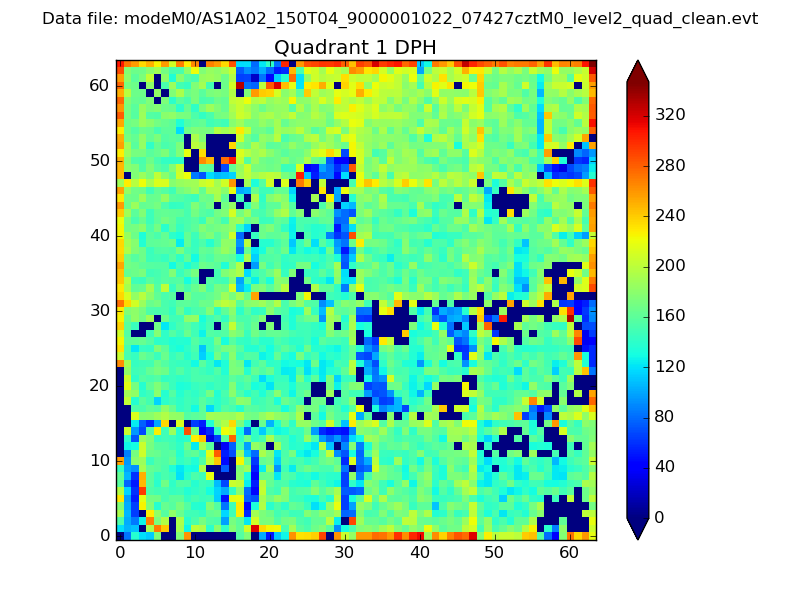 |
Quadrant B |
|---|---|---|---|
| Quadrant D | 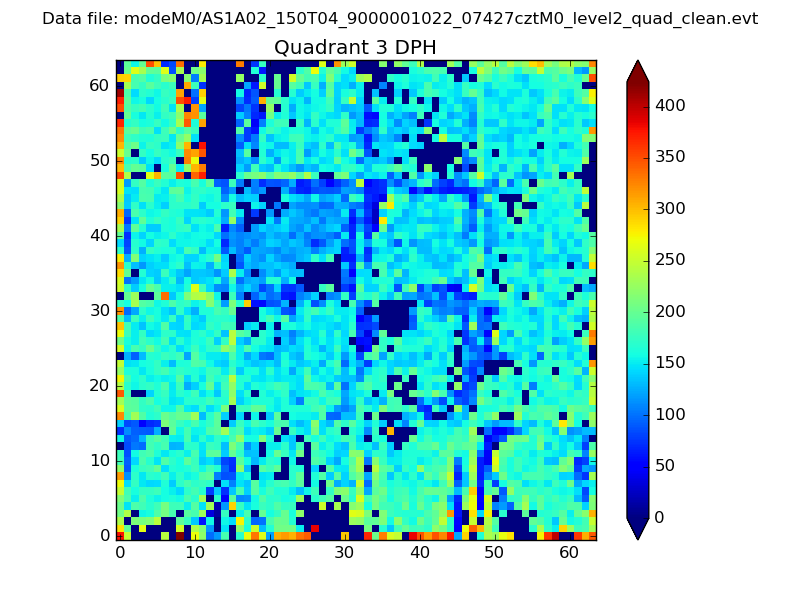 |
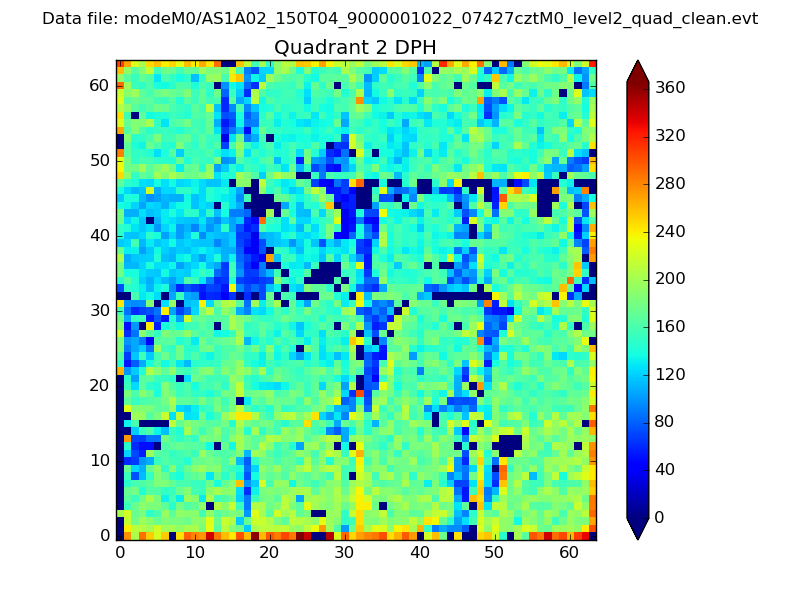 |
Quadrant C |
| Plot type | Count rate plots | Images |
|---|---|---|
| Comparison with Poisson distribution Blue bars denote a histogram of data divided into 1 sec bins. Red curve is a Poisson curve with rate = median count rate of data. |
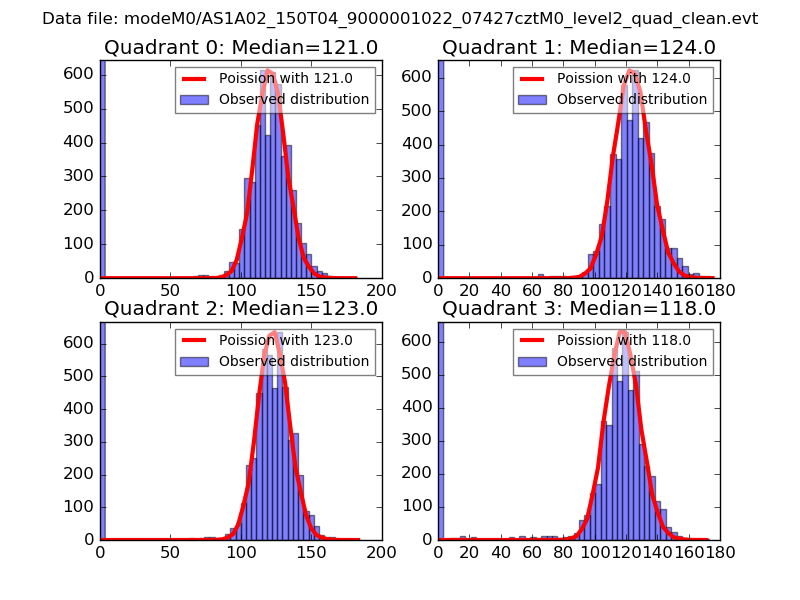 |
 |
| Quadrant-wise count rates Data is divided into 100 sec bins |
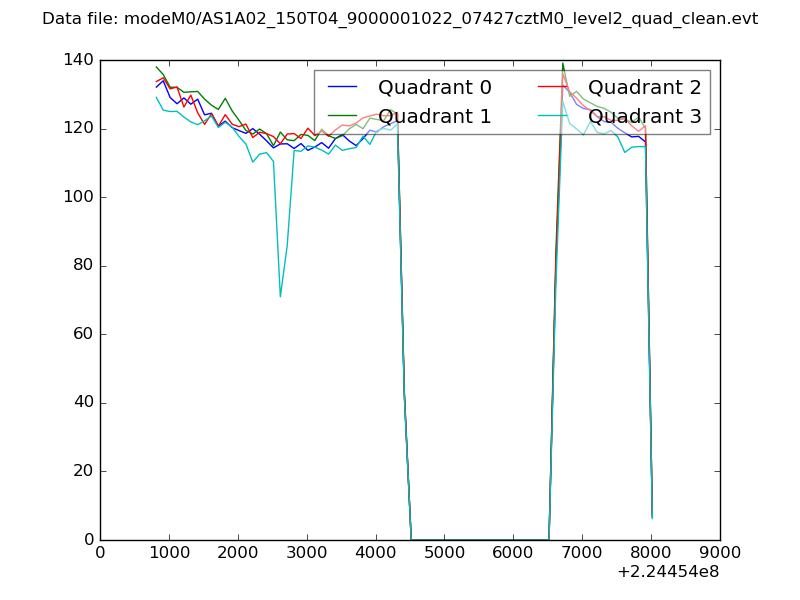 |
|
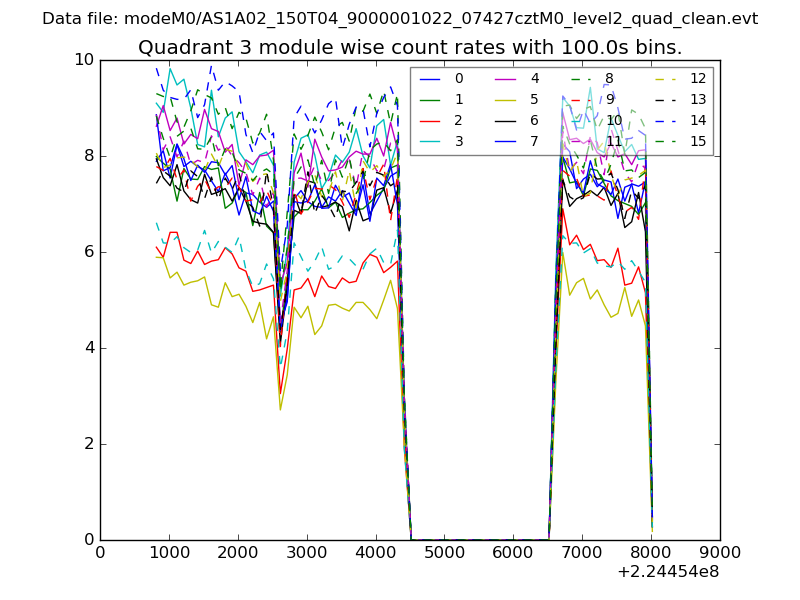
| Module-wise count rates for Quadrant A Data is divided into 100 sec bins |
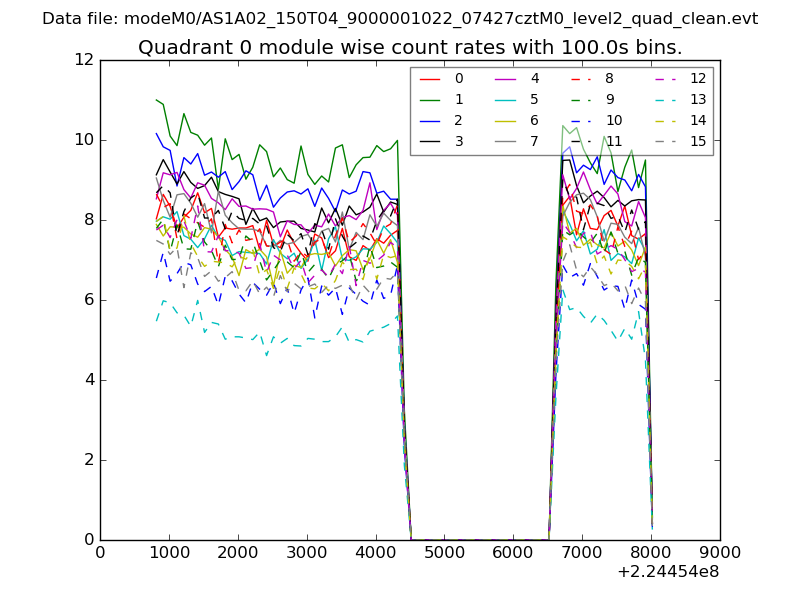 |
 |
| Module-wise count rates for Quadrant B Data is divided into 100 sec bins |
 |
 |
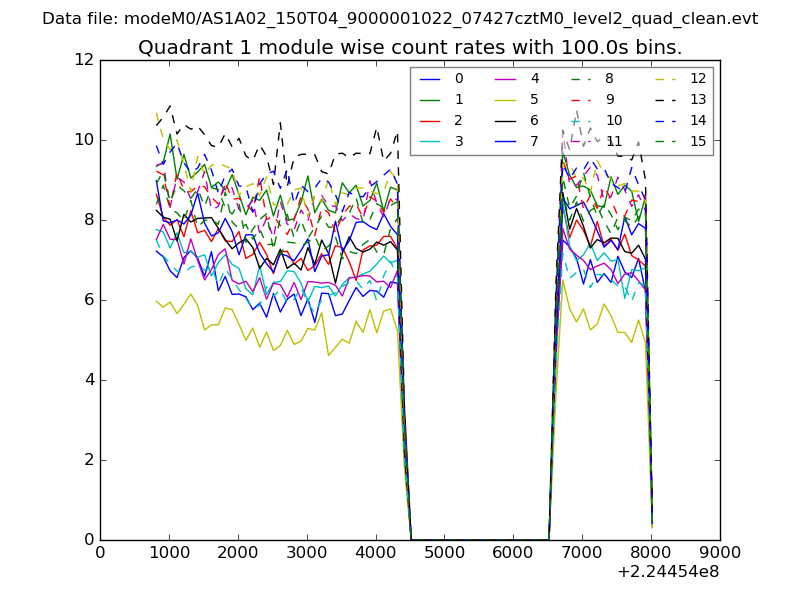
| Module-wise count rates for Quadrant C Data is divided into 100 sec bins |
 |
 |
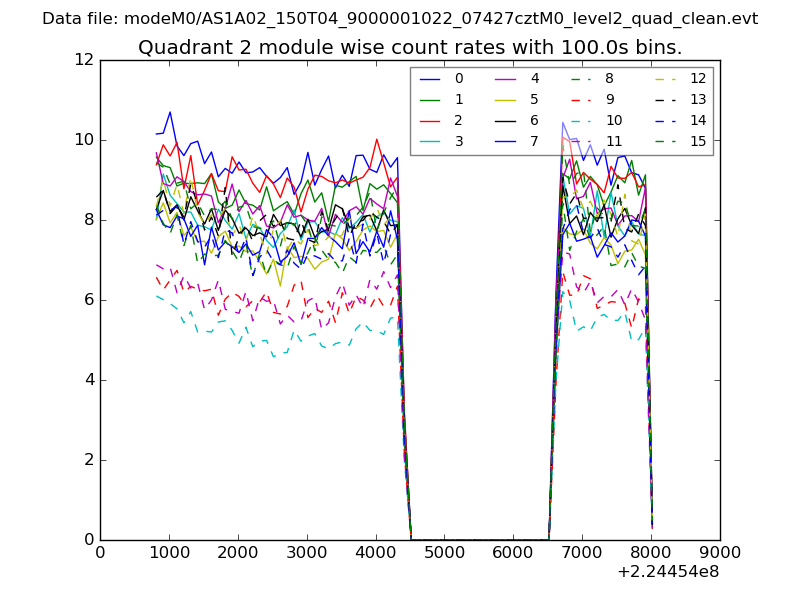
| Module-wise count rates for Quadrant D Data is divided into 100 sec bins |
 |
 |
| Parameter | Plot |
|---|---|
| CZT HV Monitor | 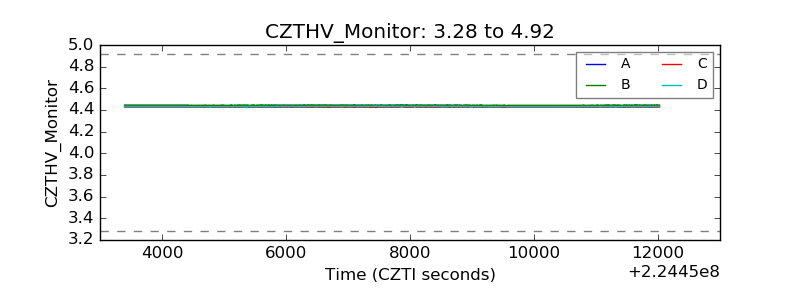 |
| D_VDD | 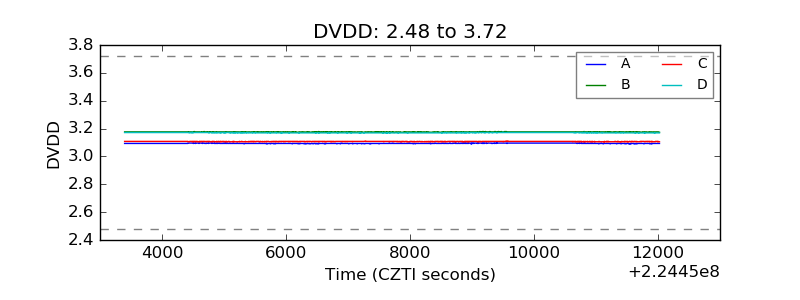 |
| Temperature 1 | 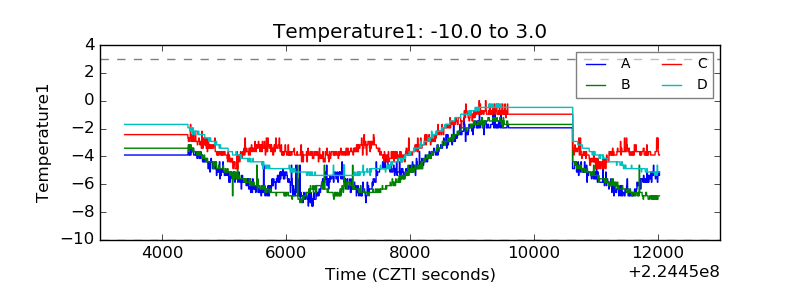 |
| Veto HV Monitor | 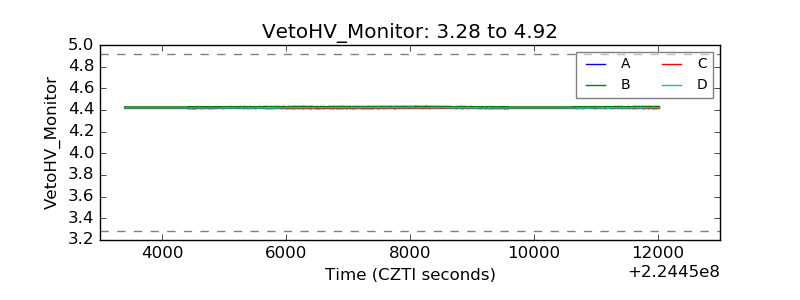 |
| Veto LLD | 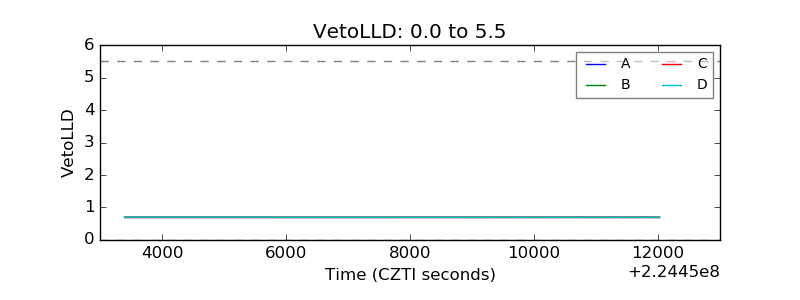 |
| Alpha Counter | 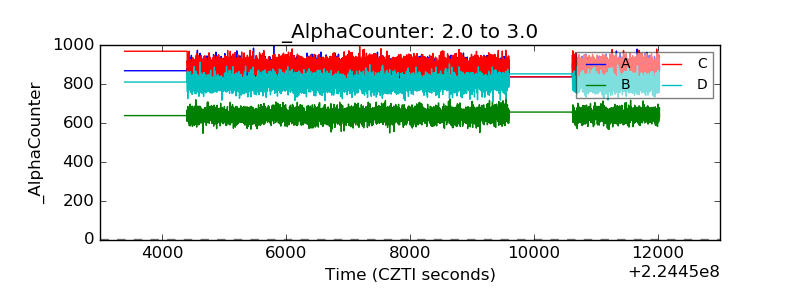 |
| _CPM_Rate | 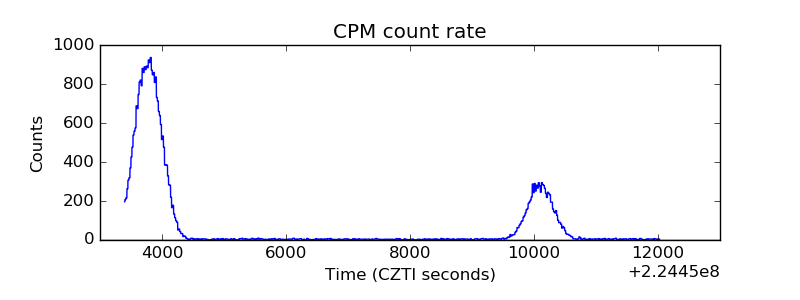 |
| CZT Counter | 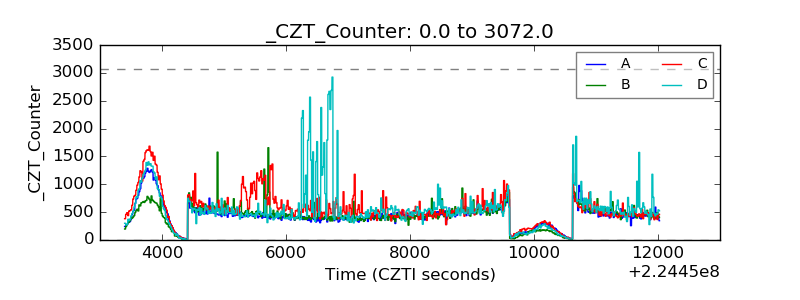 |
| +2.5 Volts monitor |  |
| +5 Volts monitor | 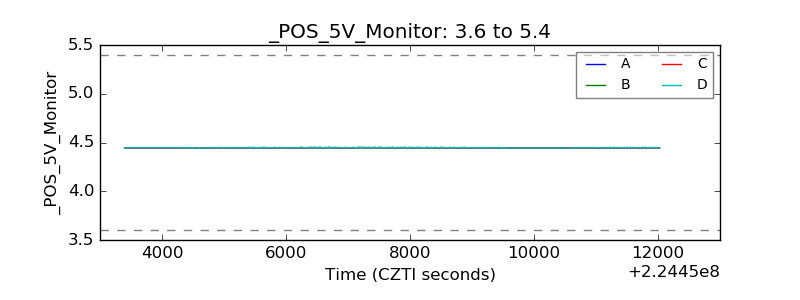 |
| _ROLL_ROT | 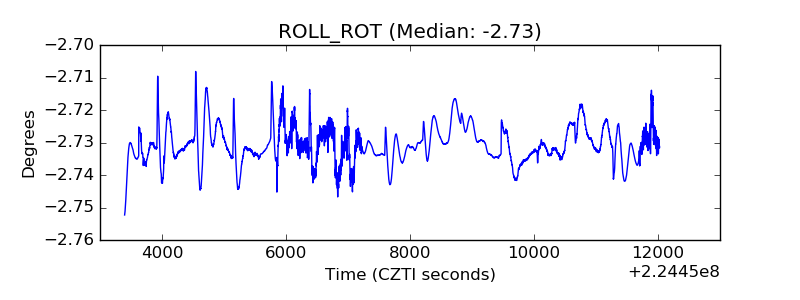 |
| _Roll_DEC | 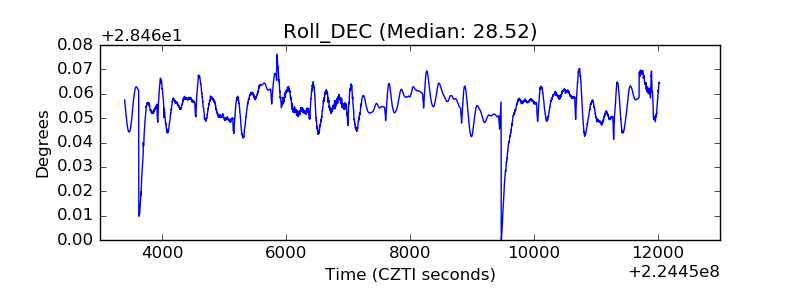 |
| _Roll_RA | 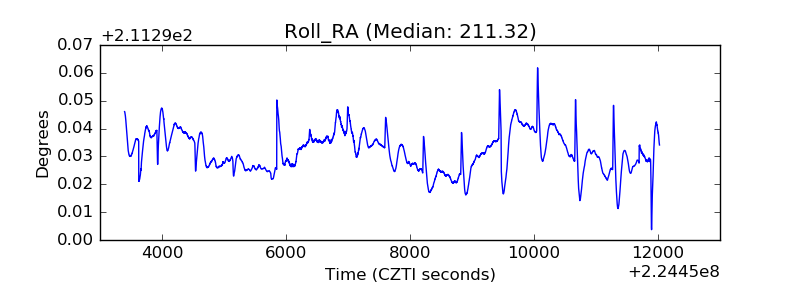 |
| Veto Counter | 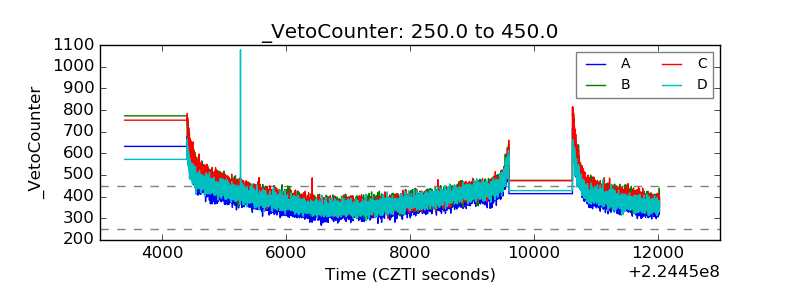 |