| Param | Original file | Final file |
|---|---|---|
| Filename | modeM0/AS1A02_150T04_9000001022_07429cztM0_level2.evt | modeM0/AS1A02_150T04_9000001022_07429cztM0_level2_quad_clean.evt |
| Size (bytes) | 528,264,000 | 100,036,800 |
| Size | 503.8 MB | 95.4 MB |
| Events in quadrant A | 3,530,001 | 623,713 |
| Events in quadrant B | 3,662,646 | 637,380 |
| Events in quadrant C | 4,203,359 | 634,226 |
| Events in quadrant D | 4,088,383 | 607,220 |
| Mode SS | |||
|---|---|---|---|
| Quadrant | BADHDUFLAG | Total packets | Discarded packets |
| A | 0 | 156 | 0 |
| B | 0 | 156 | 0 |
| C | 0 | 156 | 0 |
| D | 0 | 156 | 0 |
| Mode M9 | |||
|---|---|---|---|
| Quadrant | BADHDUFLAG | Total packets | Discarded packets |
| A | 0 | 10 | 0 |
| B | 0 | 10 | 0 |
| C | 0 | 10 | 0 |
| D | 0 | 10 | 0 |
| Mode M0 | |||
|---|---|---|---|
| Quadrant | BADHDUFLAG | Total packets | Discarded packets |
| A | 0 | 15927 | 3 |
| B | 0 | 16132 | 2 |
| C | 0 | 17197 | 2 |
| D | 0 | 17620 | 2 |
| Quadrant | Total seconds | Saturated seconds | Saturation percentage |
|---|---|---|---|
| A | 7579 | 106 | 1.398601% |
| B | 7579 | 153 | 2.018736% |
| C | 7579 | 88 | 1.161103% |
| D | 7579 | 98 | 1.293047% |
Noise dominated data is calculated using 1-second bins in cleaned event files. If a bin has >2000 counts, and if more than 50% of those come from <1% of pixels, then it is considered to be noise-dominated and hence unusable.
| Quadrant | # 1 sec bins | Bins with >0 counts | Bins with >2000 counts | High rate bins dominated by noise | Noise dominated (total time) | Noise dominated (detector-on time) | Marked lightcurve |
|---|---|---|---|---|---|---|---|
| A | 8514 | 7584 | 3 | 3 | 0.04% | 0.04% | 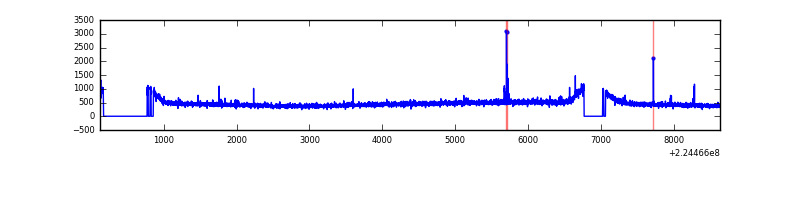 |
| B | 8514 | 7584 | 2 | 2 | 0.02% | 0.03% | 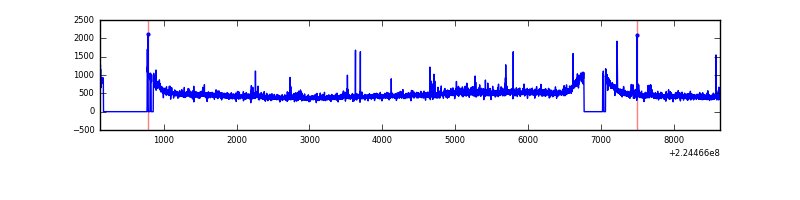 |
| C | 8514 | 7584 | 1 | 1 | 0.01% | 0.01% |  |
| D | 8514 | 7584 | 22 | 22 | 0.26% | 0.29% | 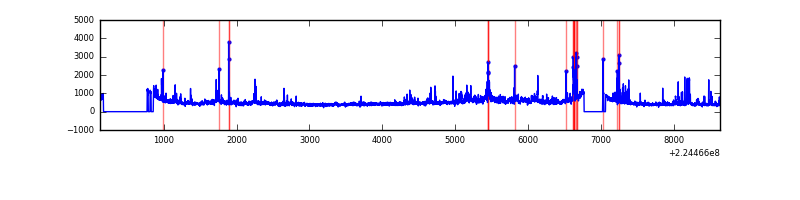 |
Top three noisy pixels from each quadrant. If the there are fewer than three noisy pixels in the level2.evt file, extra rows are filled as -1
| Pixel properties | Quadrant properties | ||||||
|---|---|---|---|---|---|---|---|
| Quadrant | DetID | PixID | Counts | Sigma | Mean | Median | Sigma |
| A | 4 | 2 | 30903 | 162.92 | 900 | 879 | 184.3 |
| A | 15 | 234 | 17302 | 89.11 | 900 | 879 | 184.3 |
| A | 13 | 248 | 12850 | 64.96 | 900 | 879 | 184.3 |
| B | 4 | 81 | 55166 | 303.83 | 913 | 889 | 178.6 |
| B | 0 | 214 | 54540 | 300.33 | 913 | 889 | 178.6 |
| B | 12 | 111 | 18728 | 99.86 | 913 | 889 | 178.6 |
| C | 9 | 68 | 732712 | 3523.02 | 882 | 887 | 207.7 |
| C | 14 | 205 | 9268 | 40.35 | 882 | 887 | 207.7 |
| C | 1 | 16 | 9006 | 39.09 | 882 | 887 | 207.7 |
| D | 13 | 169 | 305739 | 1412.03 | 873 | 847 | 215.9 |
| D | 8 | 195 | 201366 | 928.65 | 873 | 847 | 215.9 |
| D | 2 | 14 | 151340 | 696.97 | 873 | 847 | 215.9 |
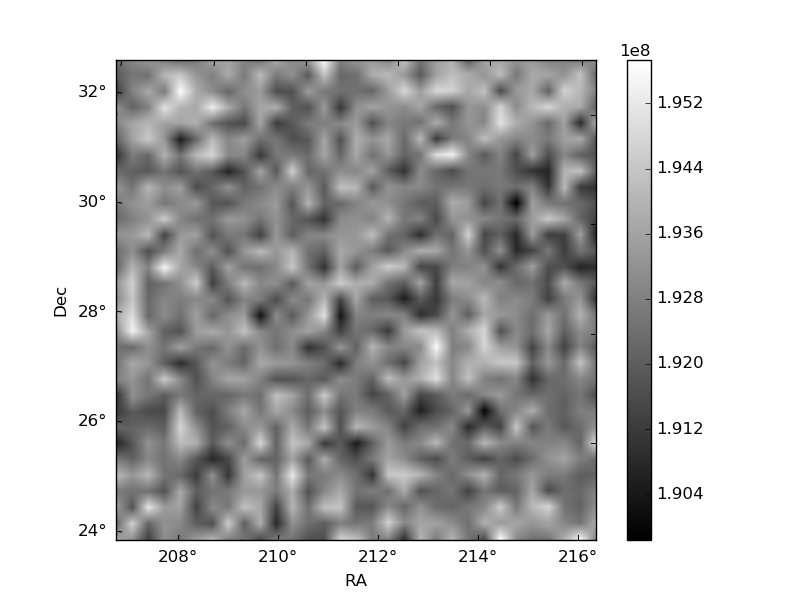
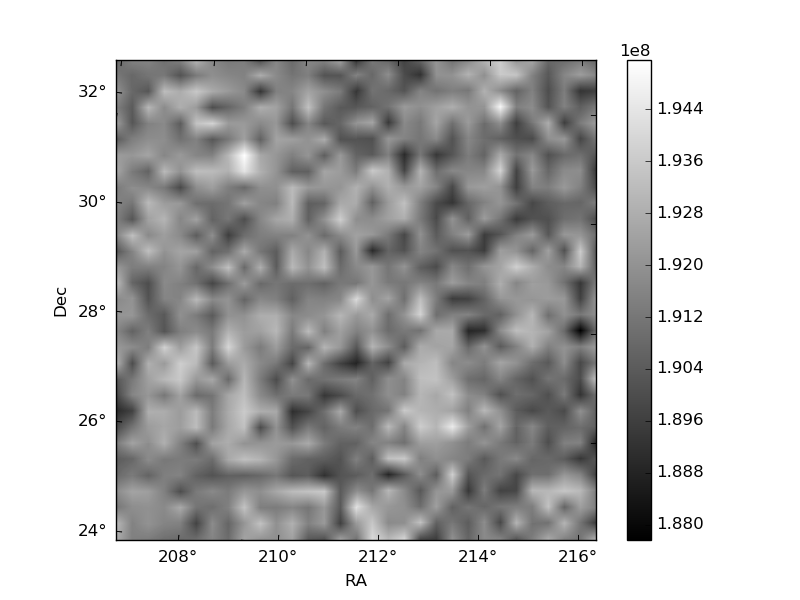
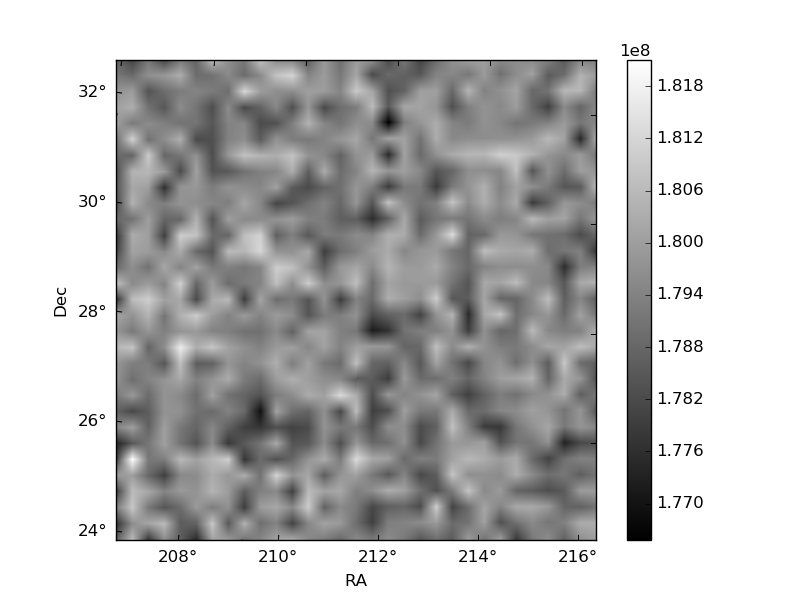
Histogram calculated using DETX and DETY for each event in the final _common_clean file
| Quadrant A |  |
 |
Quadrant B |
|---|---|---|---|
| Quadrant D |  |
 |
Quadrant C |
| Plot type | Count rate plots | Images |
|---|---|---|
| Comparison with Poisson distribution Blue bars denote a histogram of data divided into 1 sec bins. Red curve is a Poisson curve with rate = median count rate of data. |
 |
 |
| Quadrant-wise count rates Data is divided into 100 sec bins |
 |
|
| Module-wise count rates for Quadrant A Data is divided into 100 sec bins |
 |
 |
| Module-wise count rates for Quadrant B Data is divided into 100 sec bins |
 |
 |
| Module-wise count rates for Quadrant C Data is divided into 100 sec bins |
 |
 |
| Module-wise count rates for Quadrant D Data is divided into 100 sec bins |
 |
 |
| Parameter | Plot |
|---|---|
| CZT HV Monitor |  |
| D_VDD | 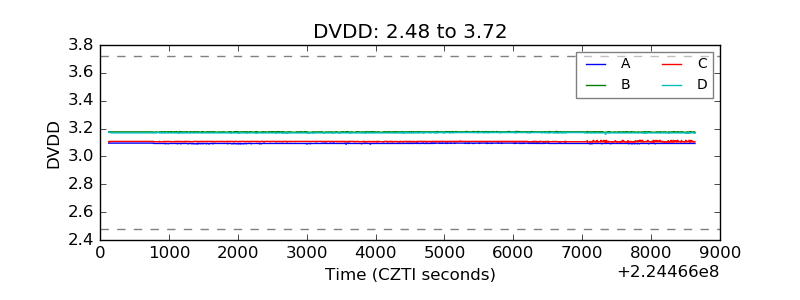 |
| Temperature 1 |  |
| Veto HV Monitor |  |
| Veto LLD |  |
| Alpha Counter |  |
| _CPM_Rate |  |
| CZT Counter |  |
| +2.5 Volts monitor |  |
| +5 Volts monitor |  |
| _ROLL_ROT |  |
| _Roll_DEC |  |
| _Roll_RA |  |
| Veto Counter |  |