| Param | Original file | Final file |
|---|---|---|
| Filename | modeM0/AS1A02_150T04_9000001022_07434cztM0_level2.evt | modeM0/AS1A02_150T04_9000001022_07434cztM0_level2_quad_clean.evt |
| Size (bytes) | 369,584,640 | 64,278,720 |
| Size | 352.5 MB | 61.3 MB |
| Events in quadrant A | 2,315,492 | 395,994 |
| Events in quadrant B | 2,441,009 | 406,440 |
| Events in quadrant C | 3,523,900 | 402,461 |
| Events in quadrant D | 2,569,817 | 388,369 |
| Mode SS | |||
|---|---|---|---|
| Quadrant | BADHDUFLAG | Total packets | Discarded packets |
| A | 0 | 102 | 0 |
| B | 0 | 102 | 0 |
| C | 0 | 102 | 0 |
| D | 0 | 102 | 0 |
| Mode M9 | |||
|---|---|---|---|
| Quadrant | BADHDUFLAG | Total packets | Discarded packets |
| A | 0 | 1 | 0 |
| B | 0 | 1 | 0 |
| C | 0 | 1 | 0 |
| D | 0 | 1 | 0 |
| Mode M0 | |||
|---|---|---|---|
| Quadrant | BADHDUFLAG | Total packets | Discarded packets |
| A | 0 | 10529 | 3 |
| B | 0 | 10701 | 2 |
| C | 0 | 14168 | 2 |
| D | 0 | 11319 | 2 |
| Quadrant | Total seconds | Saturated seconds | Saturation percentage |
|---|---|---|---|
| A | 5034 | 133 | 2.642034% |
| B | 5034 | 172 | 3.416766% |
| C | 5034 | 110 | 2.185141% |
| D | 5034 | 134 | 2.661899% |
Noise dominated data is calculated using 1-second bins in cleaned event files. If a bin has >2000 counts, and if more than 50% of those come from <1% of pixels, then it is considered to be noise-dominated and hence unusable.
| Quadrant | # 1 sec bins | Bins with >0 counts | Bins with >2000 counts | High rate bins dominated by noise | Noise dominated (total time) | Noise dominated (detector-on time) | Marked lightcurve |
|---|---|---|---|---|---|---|---|
| A | 5169 | 5036 | 0 | 0 | 0.00% | 0.00% |  |
| B | 5169 | 5036 | 0 | 0 | 0.00% | 0.00% | 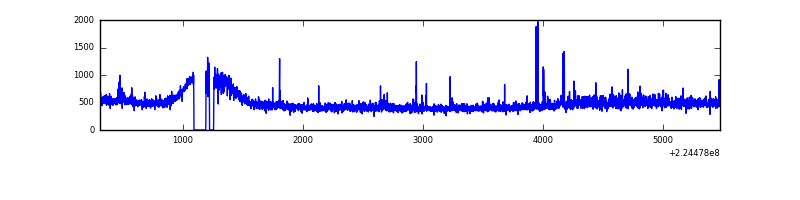 |
| C | 5169 | 5036 | 2 | 2 | 0.04% | 0.04% | 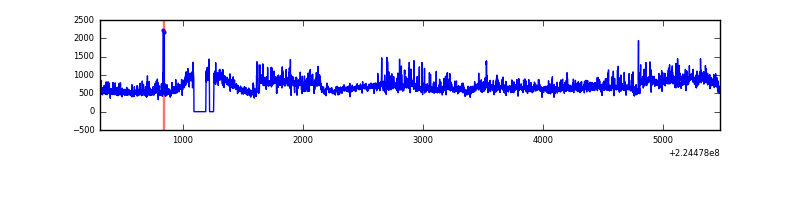 |
| D | 5169 | 5036 | 23 | 23 | 0.44% | 0.46% | 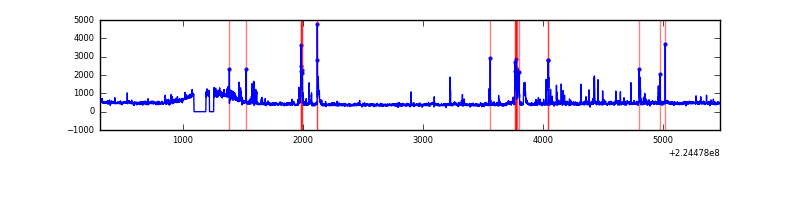 |
Top three noisy pixels from each quadrant. If the there are fewer than three noisy pixels in the level2.evt file, extra rows are filled as -1
| Pixel properties | Quadrant properties | ||||||
|---|---|---|---|---|---|---|---|
| Quadrant | DetID | PixID | Counts | Sigma | Mean | Median | Sigma |
| A | 15 | 239 | 10057 | 76.27 | 596 | 582 | 124.2 |
| A | 0 | 226 | 5856 | 42.45 | 596 | 582 | 124.2 |
| A | 12 | 194 | 5270 | 37.74 | 596 | 582 | 124.2 |
| B | 0 | 214 | 69057 | 578.47 | 602 | 587 | 118.4 |
| B | 4 | 81 | 22851 | 188.1 | 602 | 587 | 118.4 |
| B | 12 | 111 | 12448 | 100.21 | 602 | 587 | 118.4 |
| C | 9 | 68 | 1216181 | 8763.99 | 580 | 583 | 138.7 |
| C | 1 | 16 | 20596 | 144.29 | 580 | 583 | 138.7 |
| C | 8 | 128 | 13110 | 90.31 | 580 | 583 | 138.7 |
| D | 2 | 14 | 132074 | 911.58 | 581 | 562 | 144.3 |
| D | 12 | 233 | 66850 | 459.48 | 581 | 562 | 144.3 |
| D | 13 | 169 | 39845 | 272.29 | 581 | 562 | 144.3 |
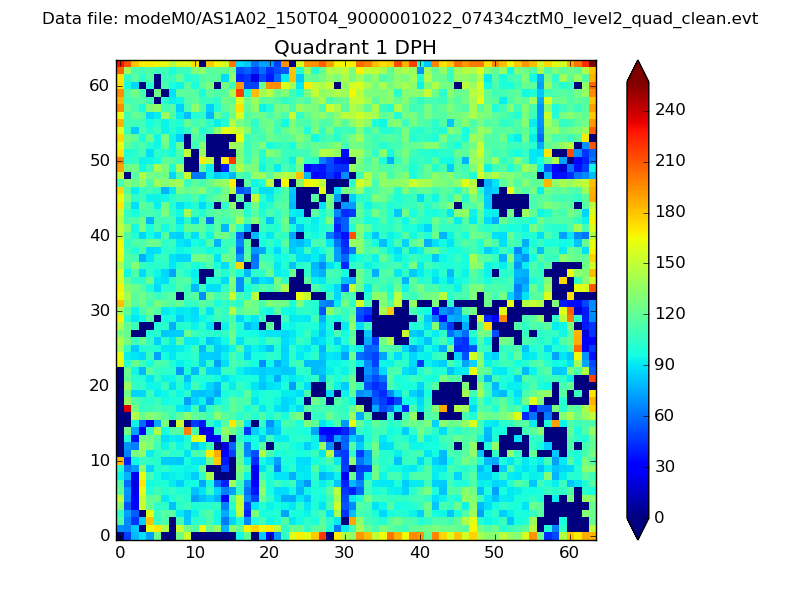
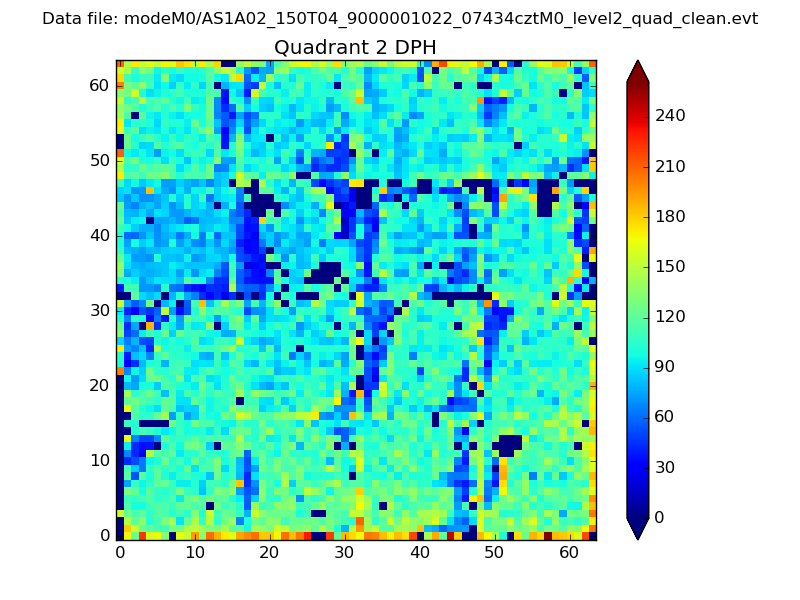
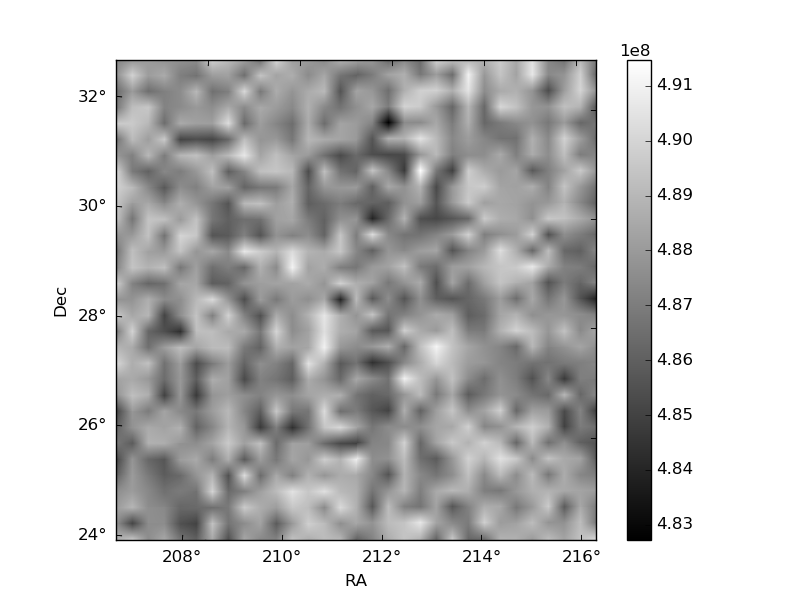
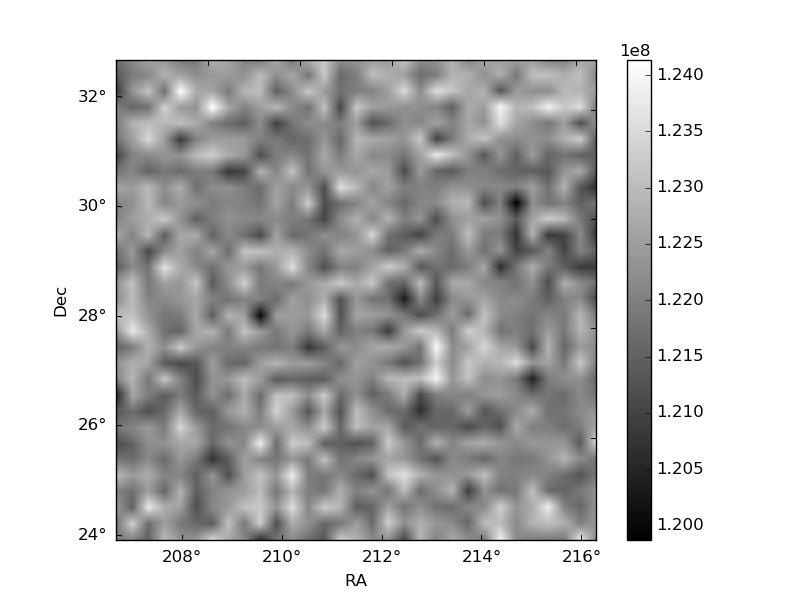
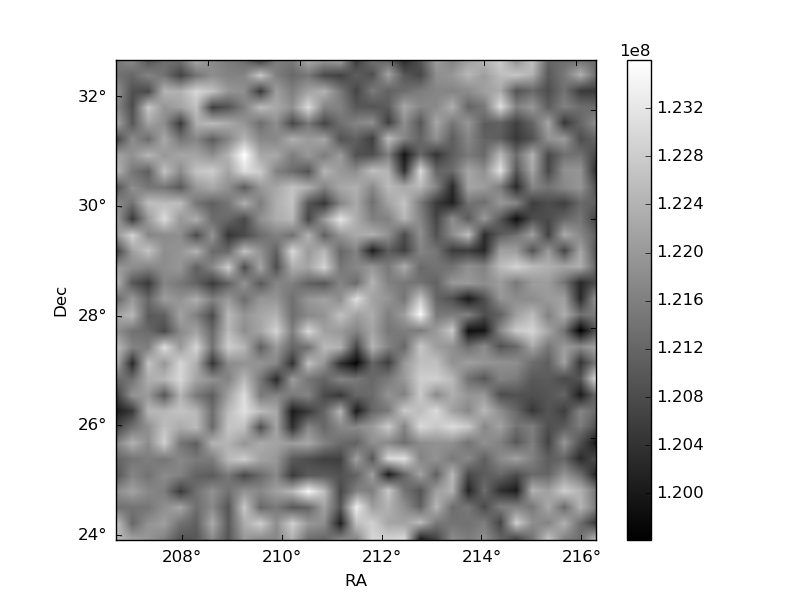
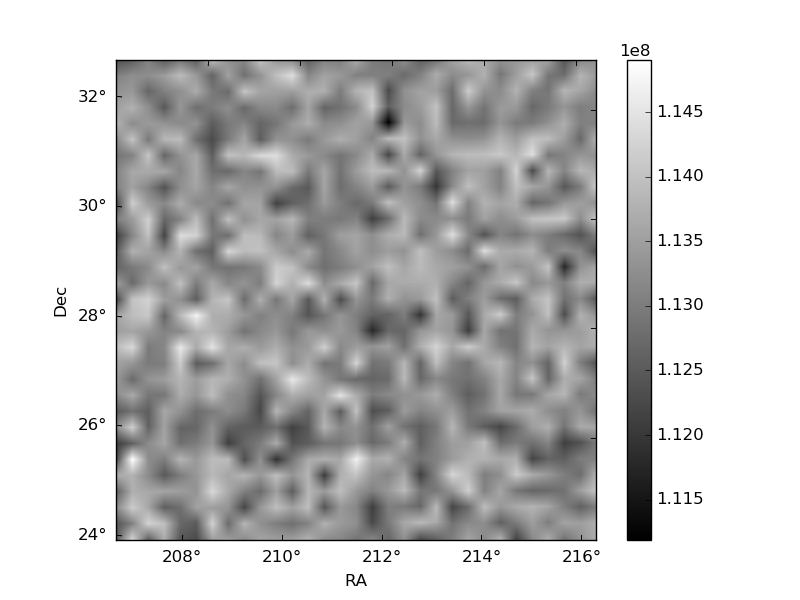
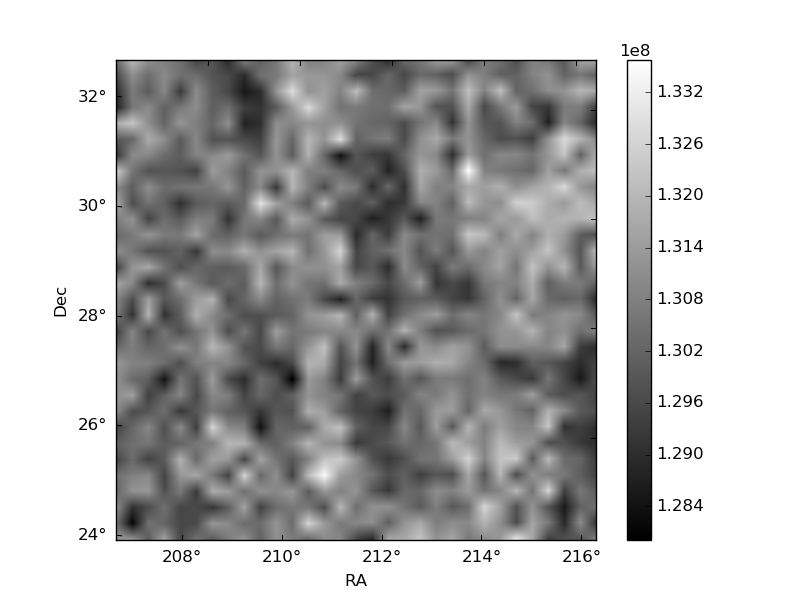
Histogram calculated using DETX and DETY for each event in the final _common_clean file
| Quadrant A | 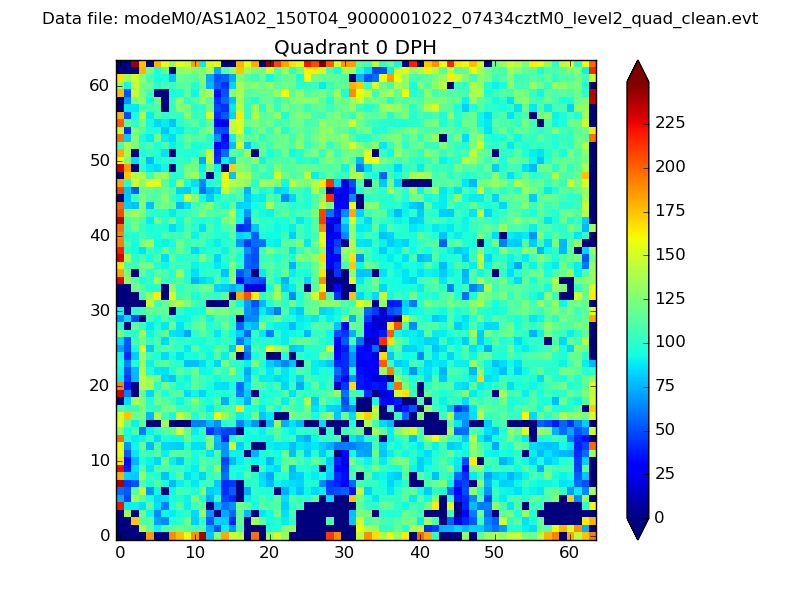 |
 |
Quadrant B |
|---|---|---|---|
| Quadrant D | 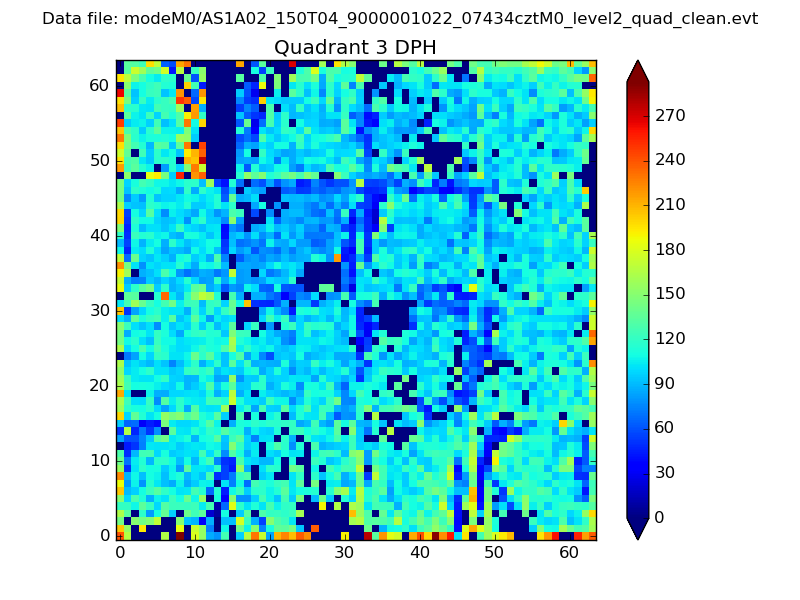 |
 |
Quadrant C |
| Plot type | Count rate plots | Images |
|---|---|---|
| Comparison with Poisson distribution Blue bars denote a histogram of data divided into 1 sec bins. Red curve is a Poisson curve with rate = median count rate of data. |
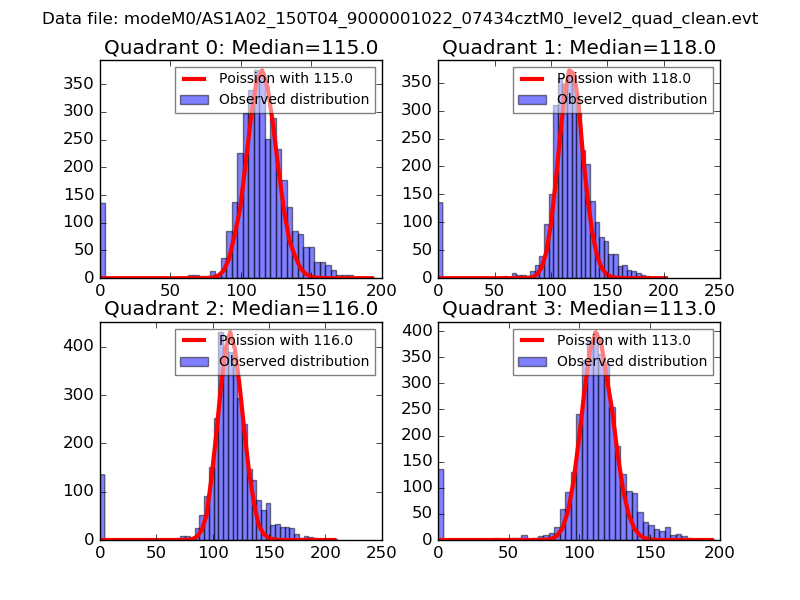 |
 |
| Quadrant-wise count rates Data is divided into 100 sec bins |
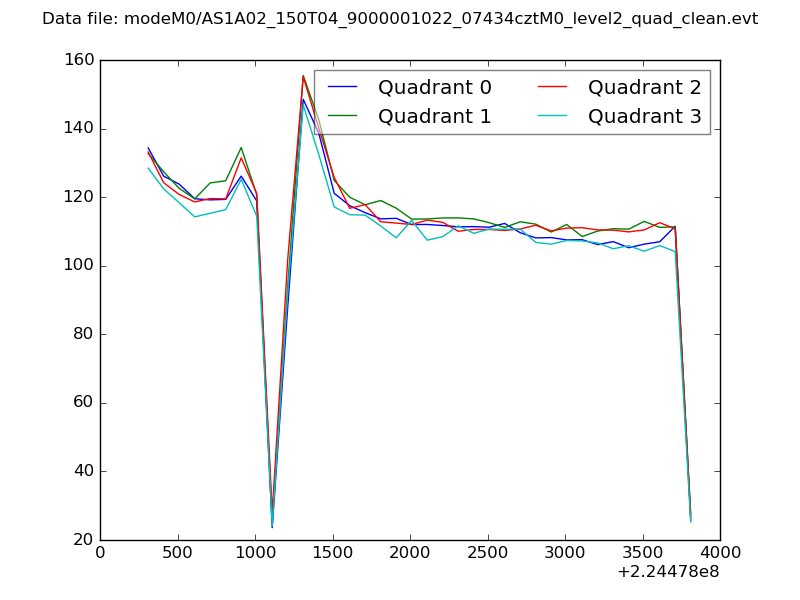 |
|
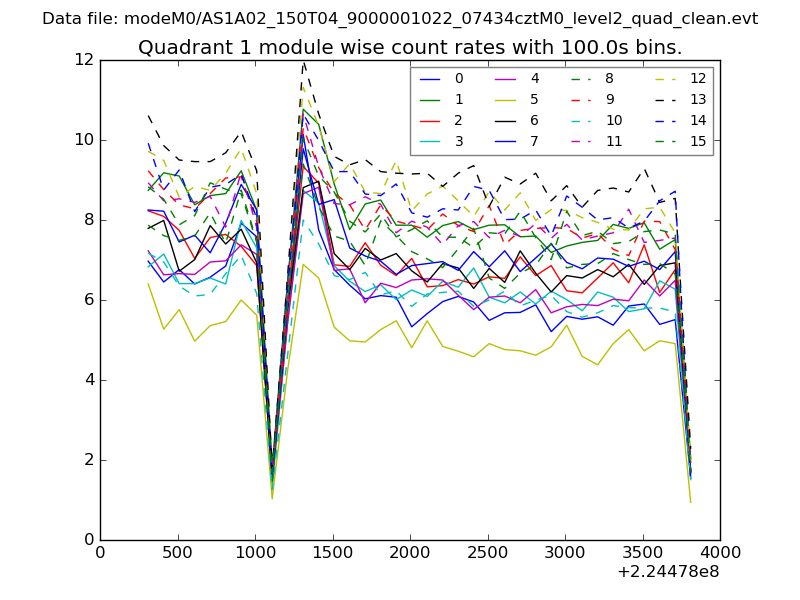
| Module-wise count rates for Quadrant A Data is divided into 100 sec bins |
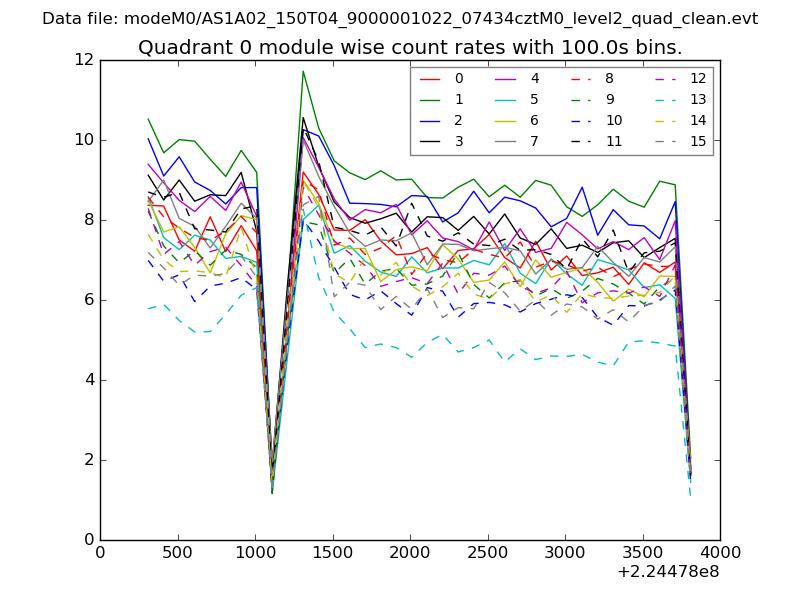 |
 |
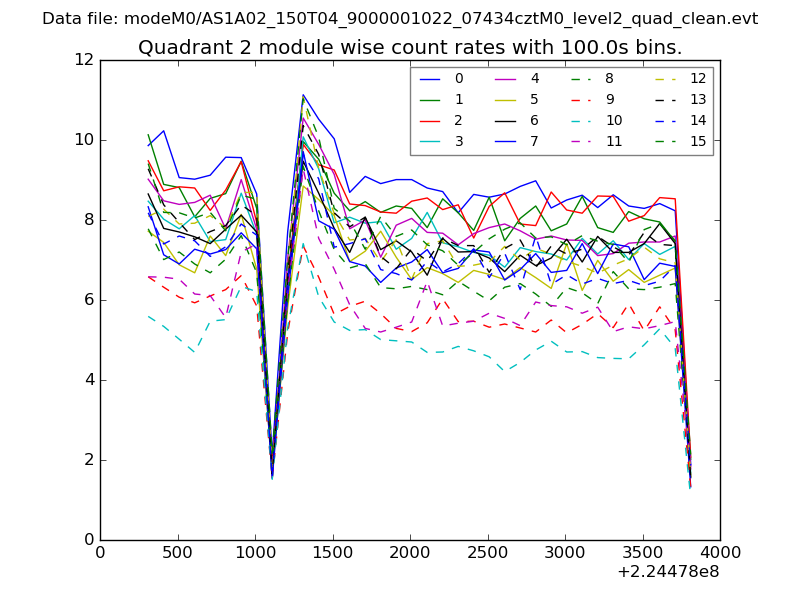
| Module-wise count rates for Quadrant B Data is divided into 100 sec bins |
 |
 |
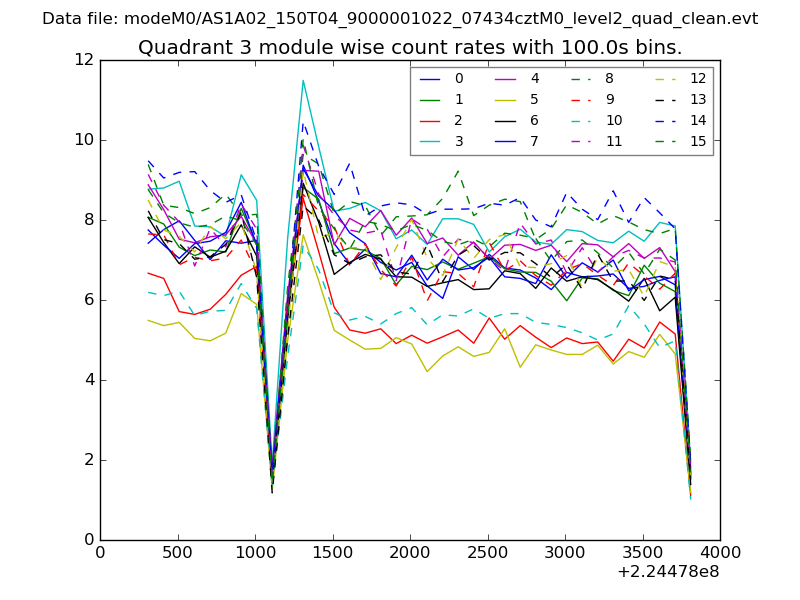
| Module-wise count rates for Quadrant C Data is divided into 100 sec bins |
 |
 |
| Module-wise count rates for Quadrant D Data is divided into 100 sec bins |
 |
 |
| Parameter | Plot |
|---|---|
| CZT HV Monitor | 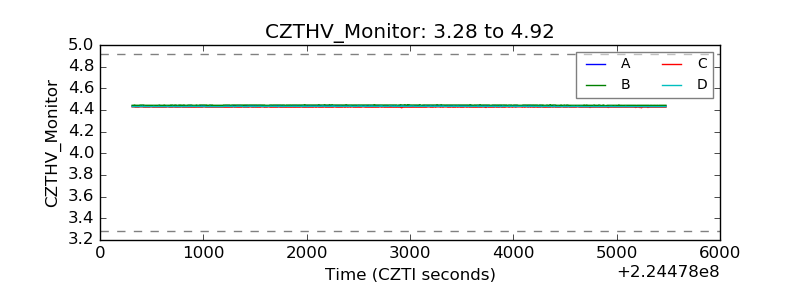 |
| D_VDD | 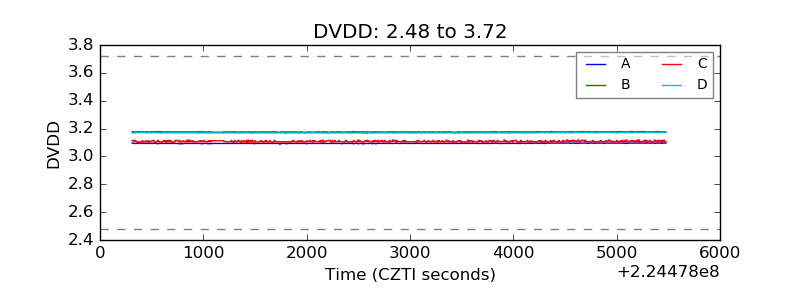 |
| Temperature 1 | 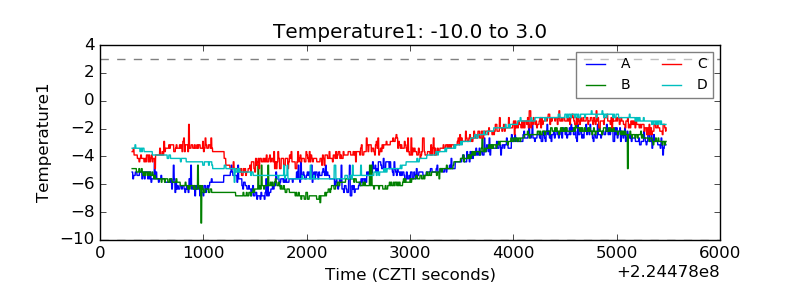 |
| Veto HV Monitor | 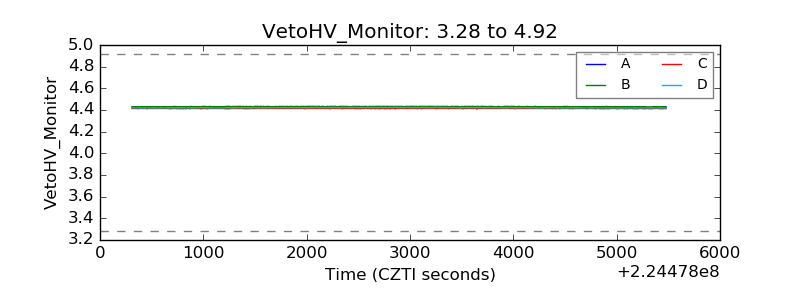 |
| Veto LLD | 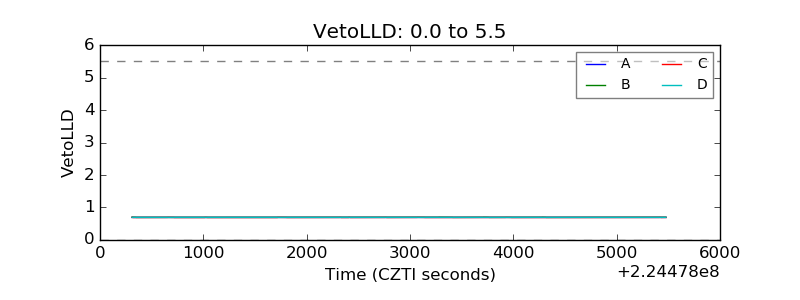 |
| Alpha Counter | 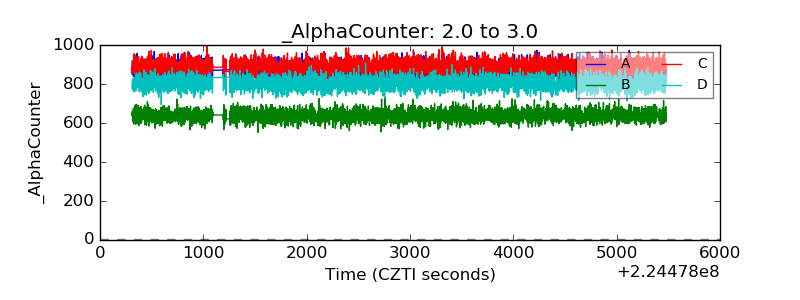 |
| _CPM_Rate | 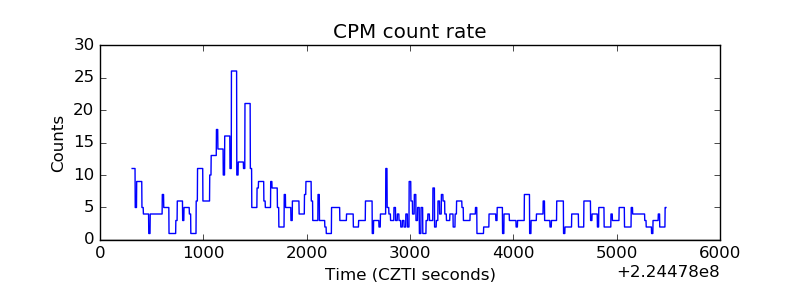 |
| CZT Counter | 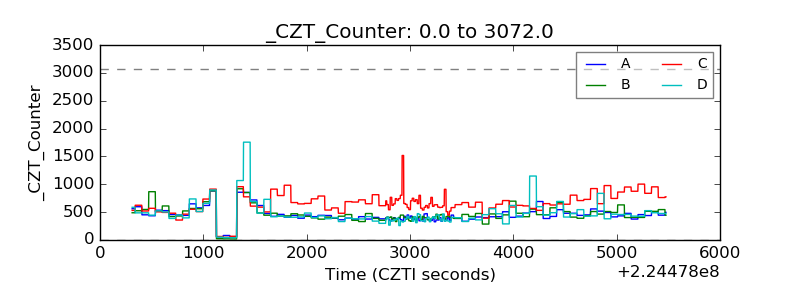 |
| +2.5 Volts monitor |  |
| +5 Volts monitor |  |
| _ROLL_ROT | 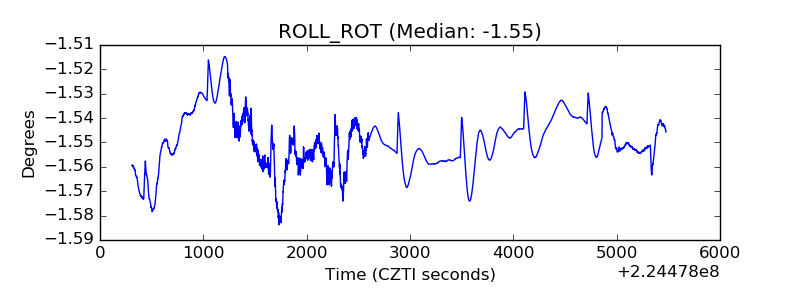 |
| _Roll_DEC | 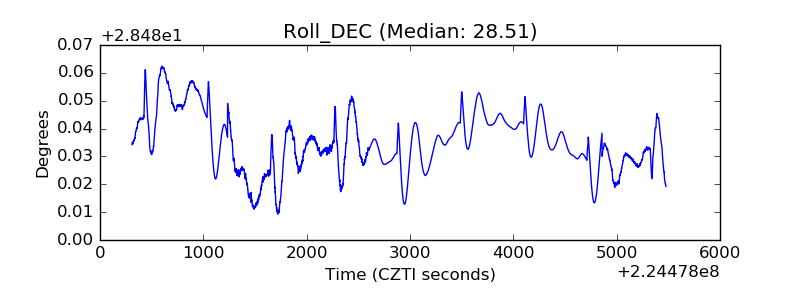 |
| _Roll_RA | 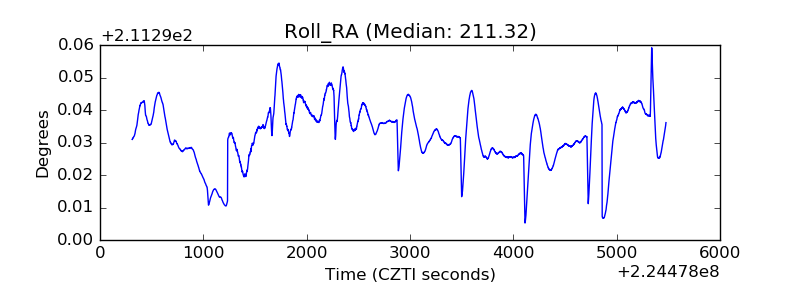 |
| Veto Counter | 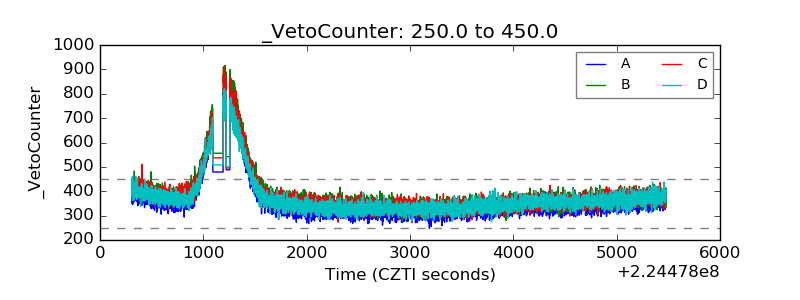 |