| Param | Original file | Final file |
|---|---|---|
| Filename | modeM0/AS1A02_150T04_9000001022_07435cztM0_level2.evt | modeM0/AS1A02_150T04_9000001022_07435cztM0_level2_quad_clean.evt |
| Size (bytes) | 472,034,880 | 71,714,880 |
| Size | 450.2 MB | 68.4 MB |
| Events in quadrant A | 3,018,047 | 426,891 |
| Events in quadrant B | 3,294,535 | 435,518 |
| Events in quadrant C | 4,320,065 | 432,307 |
| Events in quadrant D | 3,218,004 | 419,585 |
| Mode SS | |||
|---|---|---|---|
| Quadrant | BADHDUFLAG | Total packets | Discarded packets |
| A | 0 | 134 | 0 |
| B | 0 | 134 | 0 |
| C | 0 | 134 | 0 |
| D | 0 | 134 | 0 |
| Mode M9 | |||
|---|---|---|---|
| Quadrant | BADHDUFLAG | Total packets | Discarded packets |
| A | 0 | 4 | 0 |
| B | 0 | 4 | 0 |
| C | 0 | 4 | 0 |
| D | 0 | 4 | 0 |
| Mode M0 | |||
|---|---|---|---|
| Quadrant | BADHDUFLAG | Total packets | Discarded packets |
| A | 0 | 13431 | 4 |
| B | 0 | 14117 | 1 |
| C | 0 | 17348 | 1 |
| D | 0 | 14209 | 1 |
| Quadrant | Total seconds | Saturated seconds | Saturation percentage |
|---|---|---|---|
| A | 6557 | 94 | 1.433582% |
| B | 6558 | 117 | 1.784081% |
| C | 6558 | 93 | 1.418115% |
| D | 6558 | 110 | 1.677341% |
Noise dominated data is calculated using 1-second bins in cleaned event files. If a bin has >2000 counts, and if more than 50% of those come from <1% of pixels, then it is considered to be noise-dominated and hence unusable.
| Quadrant | # 1 sec bins | Bins with >0 counts | Bins with >2000 counts | High rate bins dominated by noise | Noise dominated (total time) | Noise dominated (detector-on time) | Marked lightcurve |
|---|---|---|---|---|---|---|---|
| A | 6933 | 6560 | 0 | 0 | 0.00% | 0.00% | 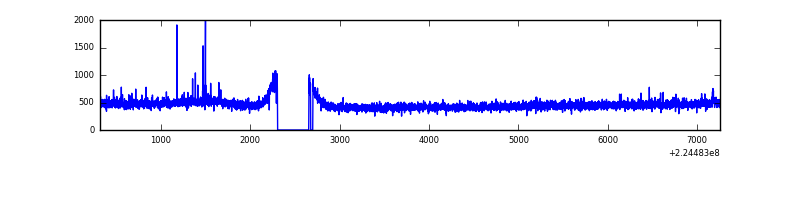 |
| B | 6933 | 6560 | 17 | 17 | 0.25% | 0.26% | 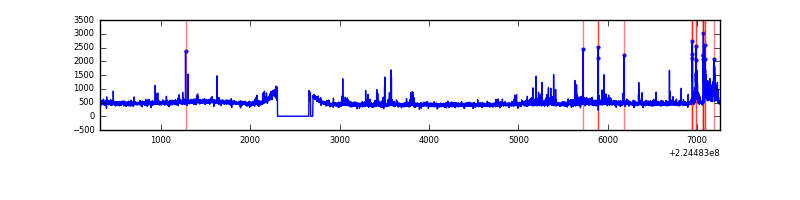 |
| C | 6933 | 6560 | 4 | 4 | 0.06% | 0.06% | 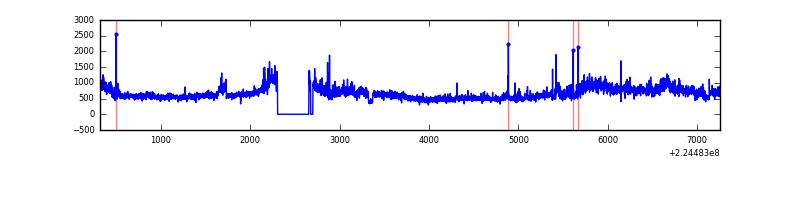 |
| D | 6933 | 6560 | 45 | 45 | 0.65% | 0.69% | 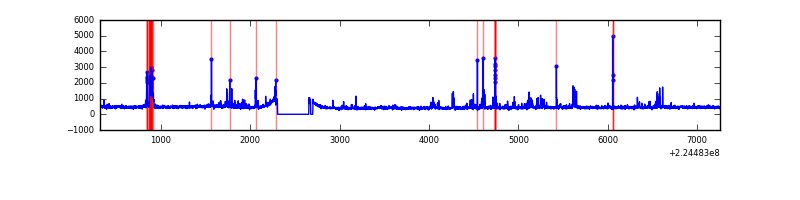 |
Top three noisy pixels from each quadrant. If the there are fewer than three noisy pixels in the level2.evt file, extra rows are filled as -1
| Pixel properties | Quadrant properties | ||||||
|---|---|---|---|---|---|---|---|
| Quadrant | DetID | PixID | Counts | Sigma | Mean | Median | Sigma |
| A | 4 | 2 | 21884 | 132.68 | 769 | 750 | 159.3 |
| A | 3 | 1 | 14516 | 86.43 | 769 | 750 | 159.3 |
| A | 13 | 14 | 10192 | 59.28 | 769 | 750 | 159.3 |
| B | 10 | 245 | 175294 | 1160.86 | 776 | 754 | 150.4 |
| B | 0 | 214 | 74729 | 492.0 | 776 | 754 | 150.4 |
| B | 4 | 81 | 29699 | 192.51 | 776 | 754 | 150.4 |
| C | 9 | 68 | 1387814 | 7898.29 | 748 | 751 | 175.6 |
| C | 13 | 61 | 5837 | 28.96 | 748 | 751 | 175.6 |
| C | 8 | 128 | 4863 | 23.41 | 748 | 751 | 175.6 |
| D | 7 | 55 | 120913 | 645.55 | 751 | 727 | 186.2 |
| D | 2 | 14 | 67975 | 361.21 | 751 | 727 | 186.2 |
| D | 1 | 52 | 44664 | 236.0 | 751 | 727 | 186.2 |
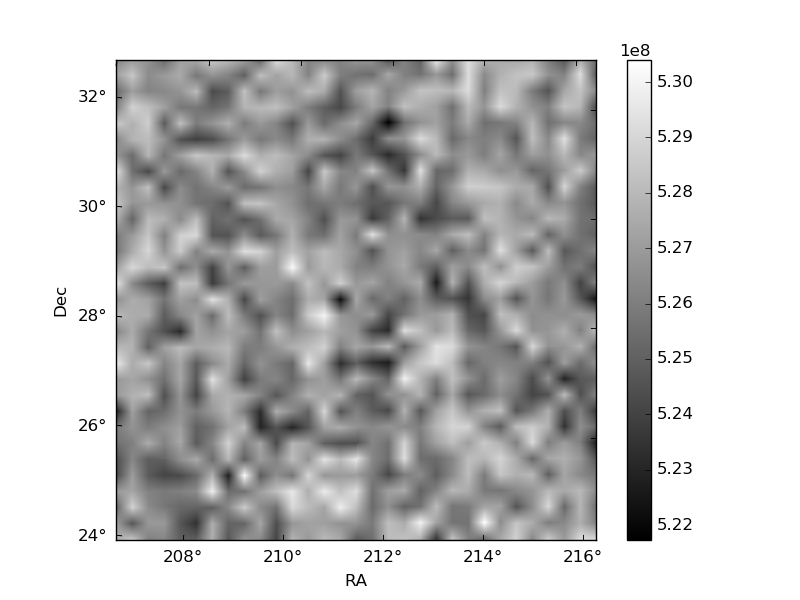
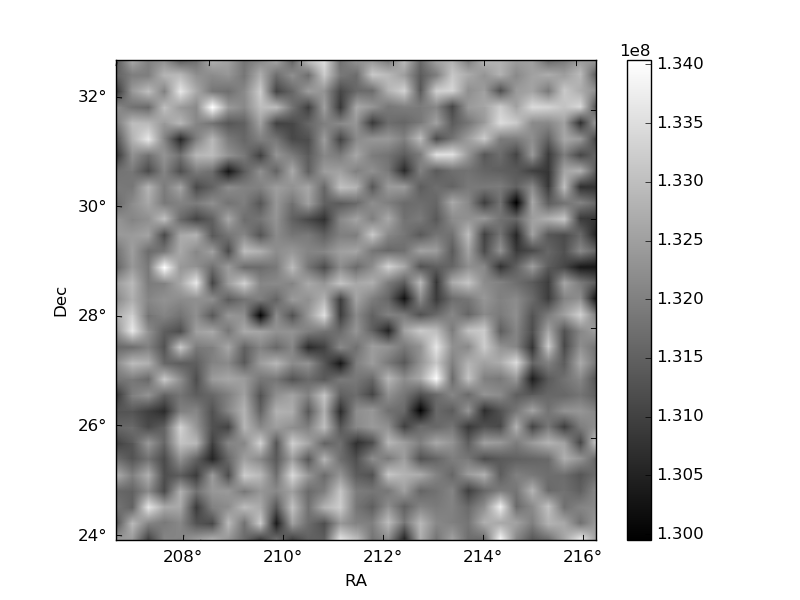
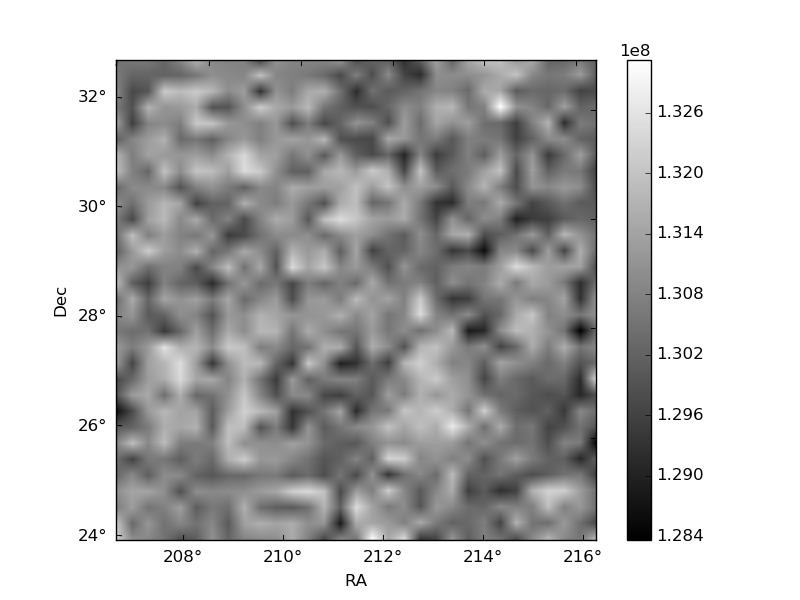
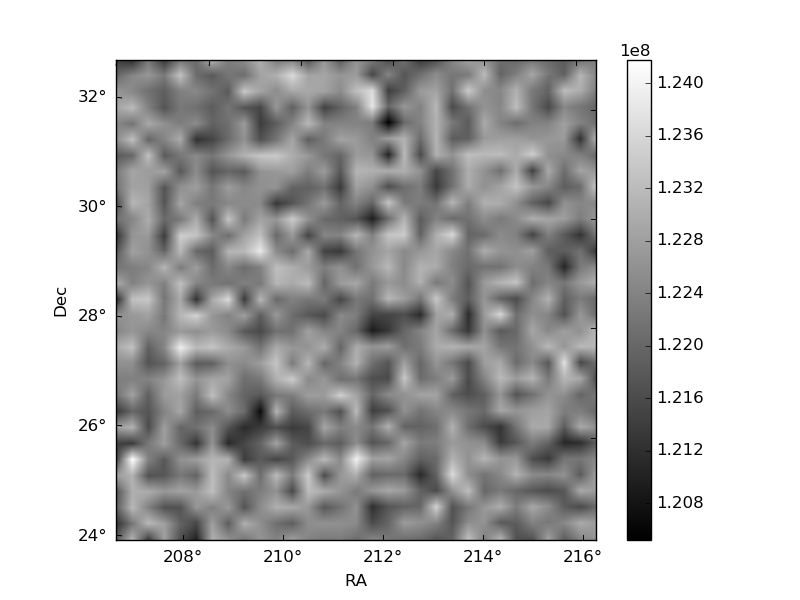
Histogram calculated using DETX and DETY for each event in the final _common_clean file
| Quadrant A | 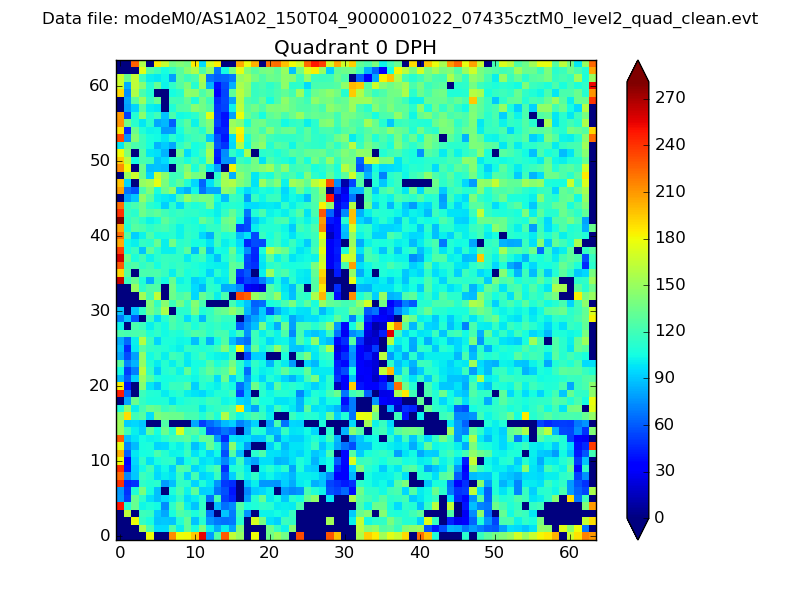 |
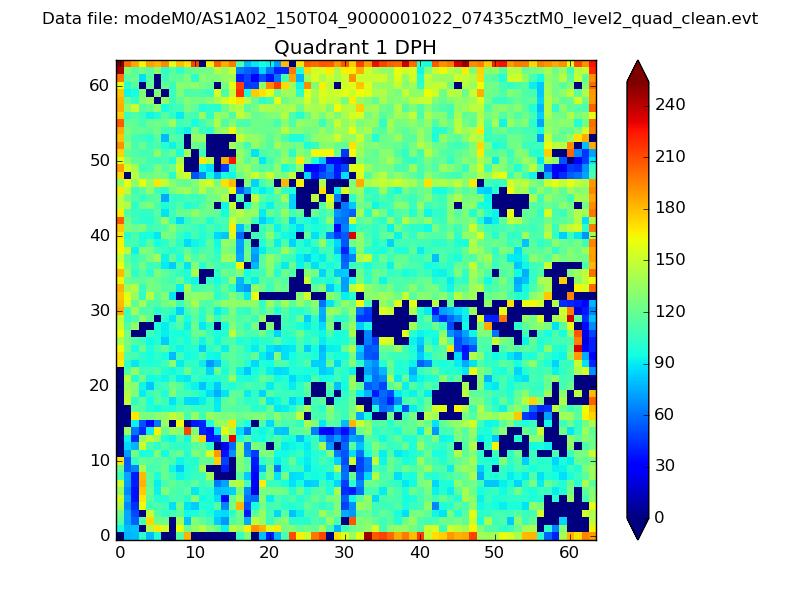 |
Quadrant B |
|---|---|---|---|
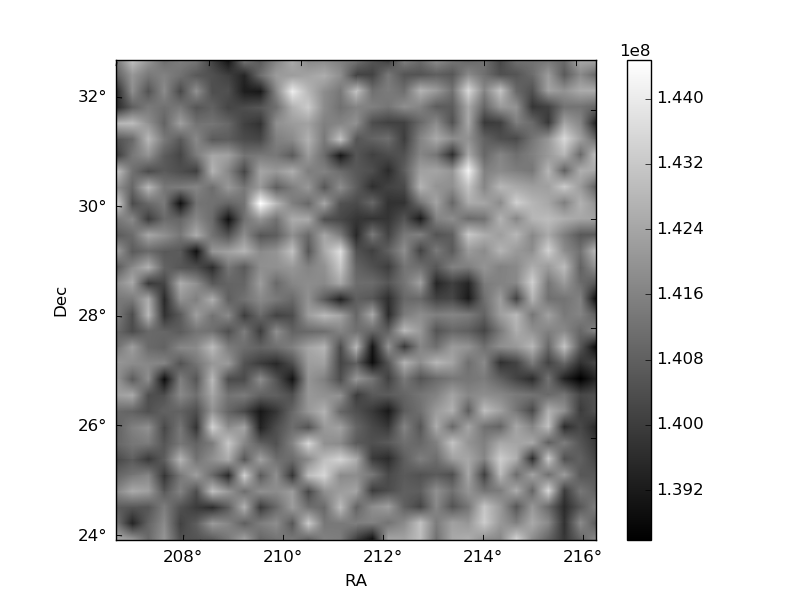
| Quadrant D | 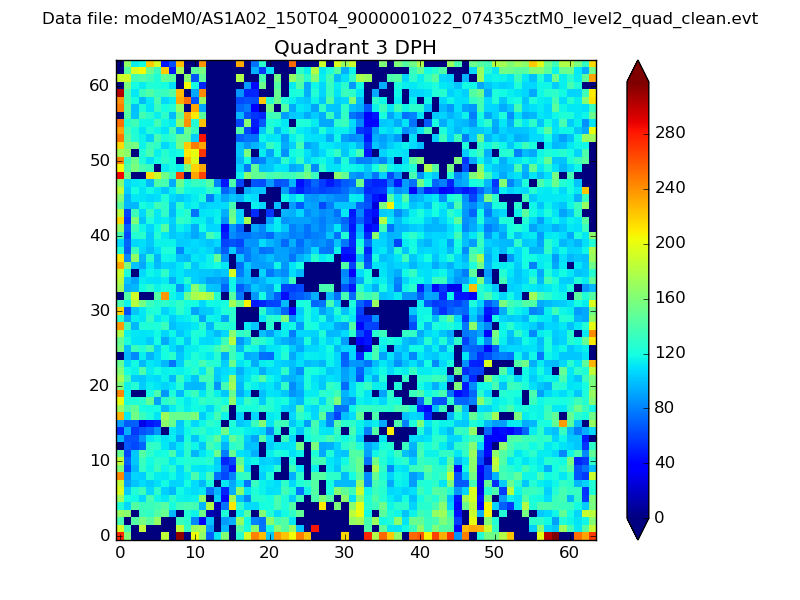 |
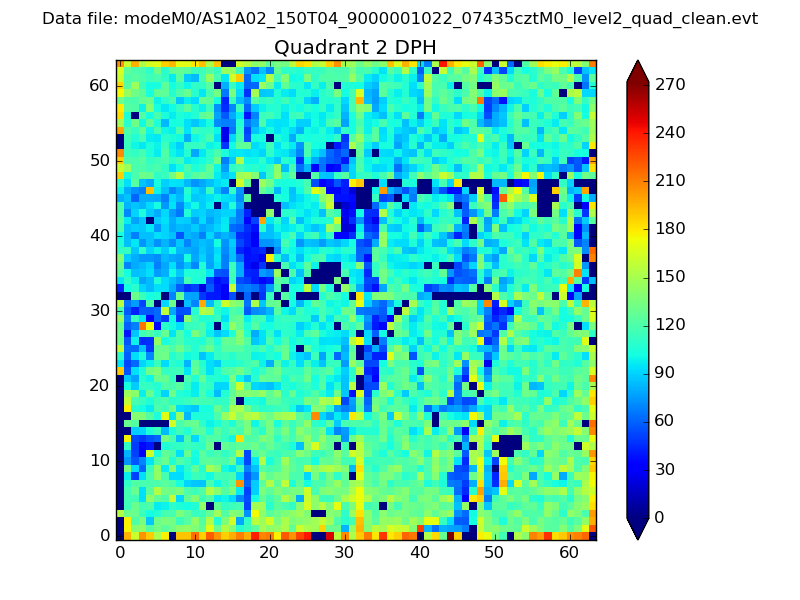 |
Quadrant C |
| Plot type | Count rate plots | Images |
|---|---|---|
| Comparison with Poisson distribution Blue bars denote a histogram of data divided into 1 sec bins. Red curve is a Poisson curve with rate = median count rate of data. |
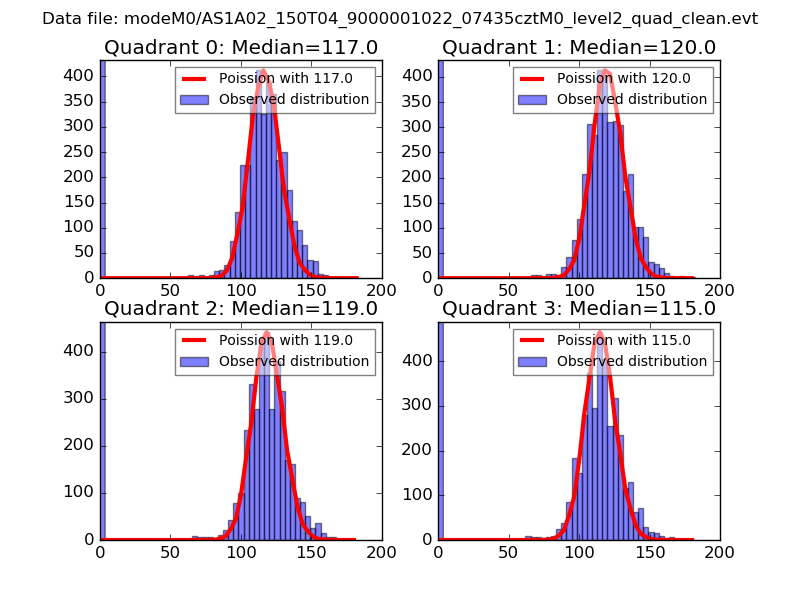 |
 |
| Quadrant-wise count rates Data is divided into 100 sec bins |
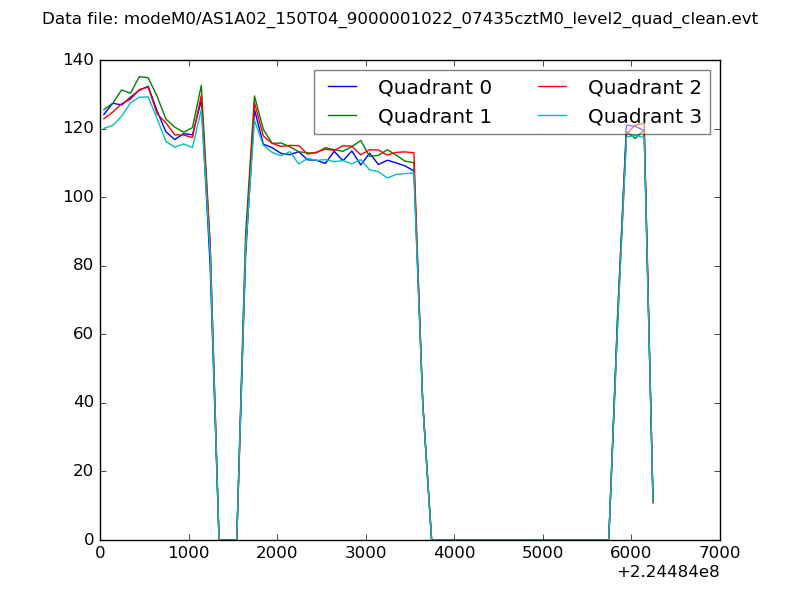 |
|
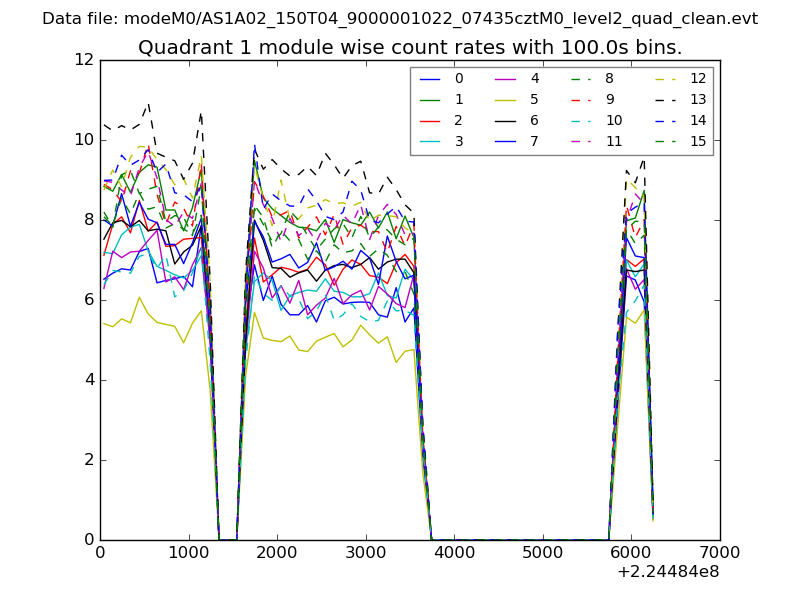
| Module-wise count rates for Quadrant A Data is divided into 100 sec bins |
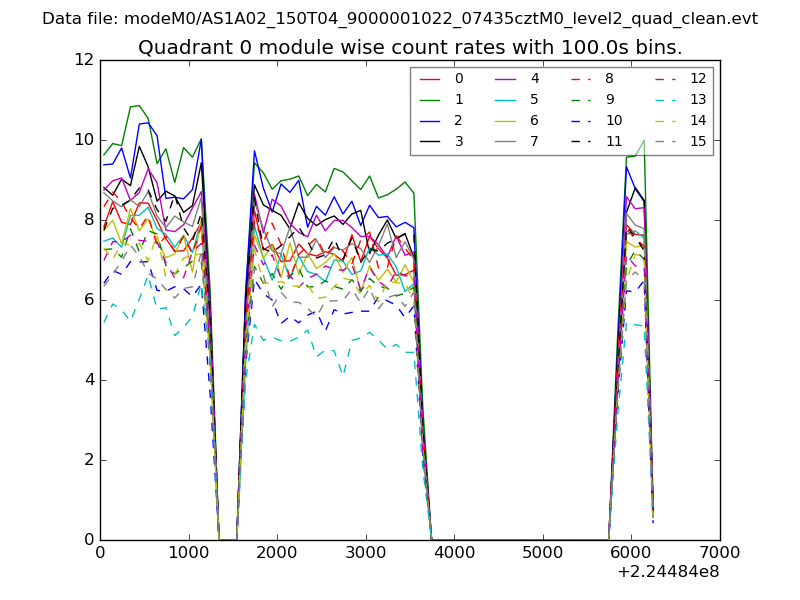 |
 |
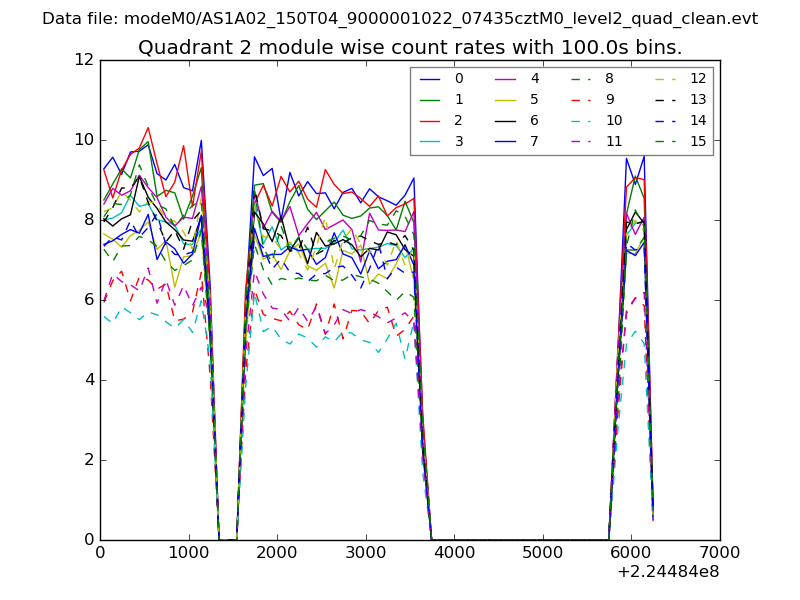
| Module-wise count rates for Quadrant B Data is divided into 100 sec bins |
 |
 |
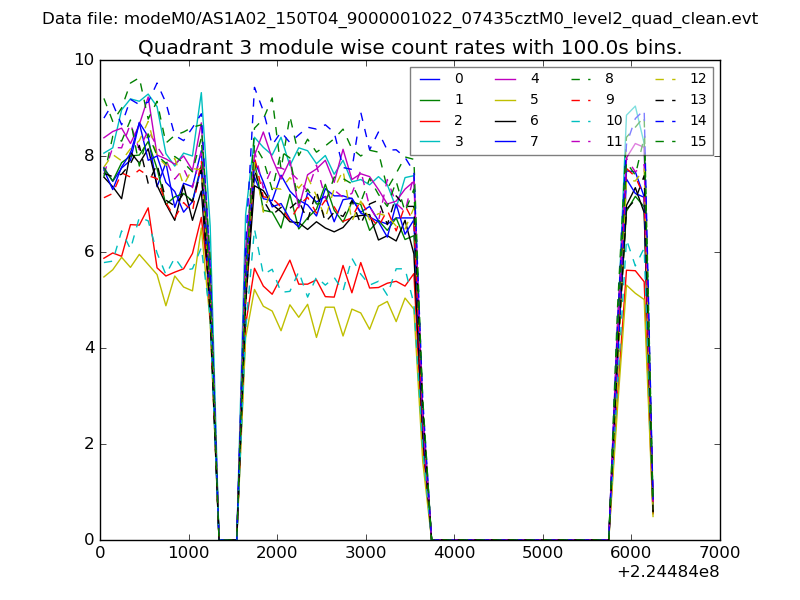
| Module-wise count rates for Quadrant C Data is divided into 100 sec bins |
 |
 |
| Module-wise count rates for Quadrant D Data is divided into 100 sec bins |
 |
 |
| Parameter | Plot |
|---|---|
| CZT HV Monitor | 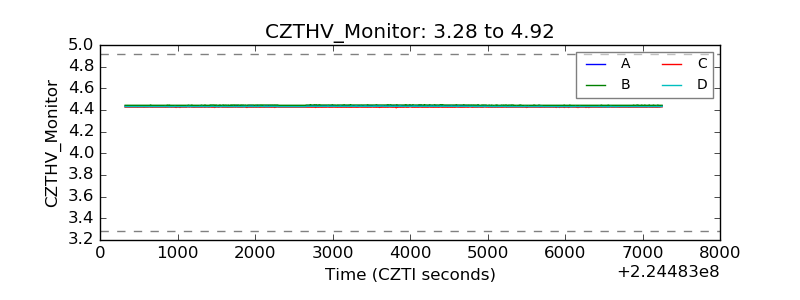 |
| D_VDD | 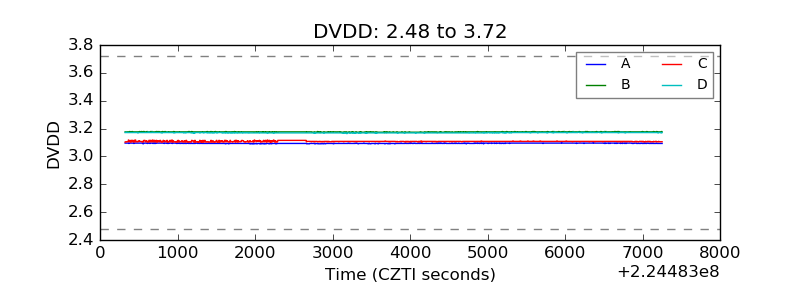 |
| Temperature 1 | 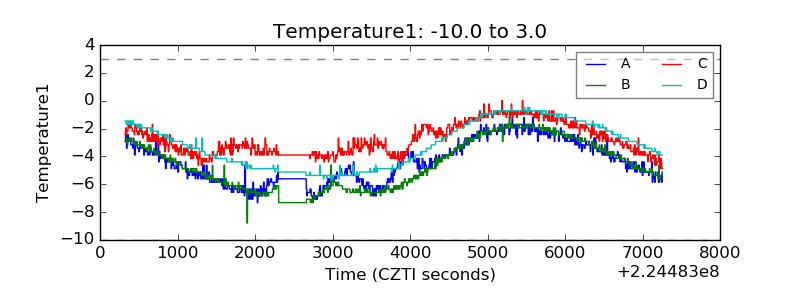 |
| Veto HV Monitor | 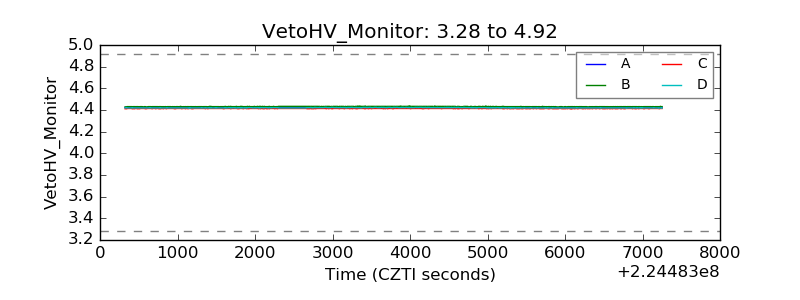 |
| Veto LLD | 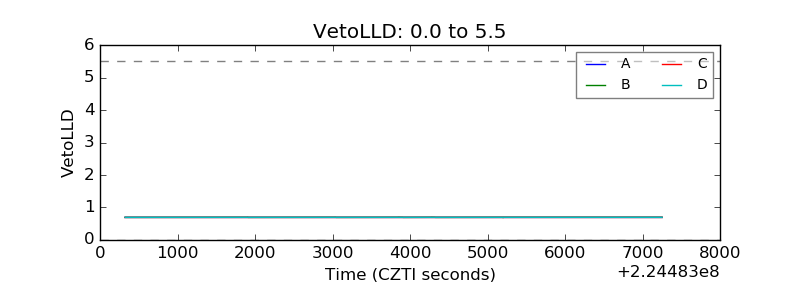 |
| Alpha Counter | 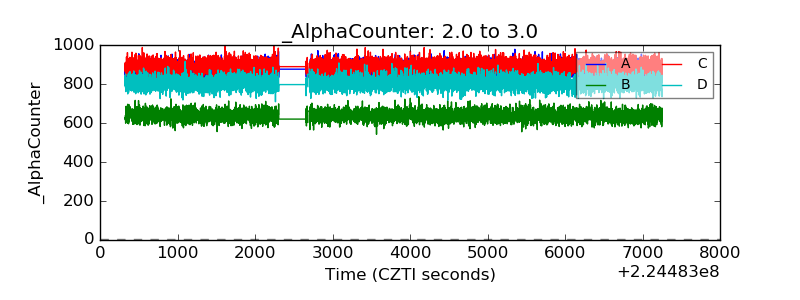 |
| _CPM_Rate | 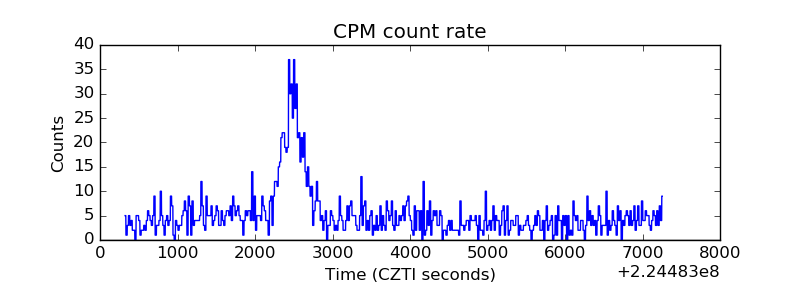 |
| CZT Counter | 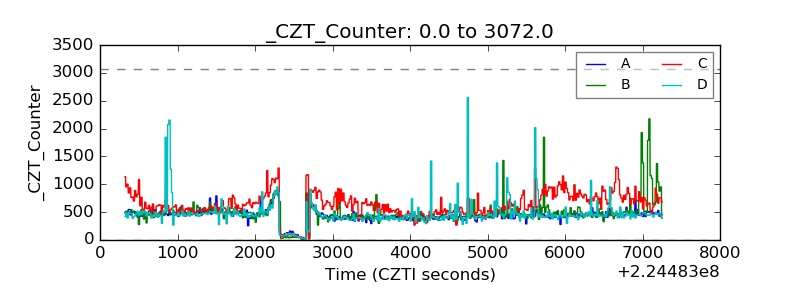 |
| +2.5 Volts monitor | 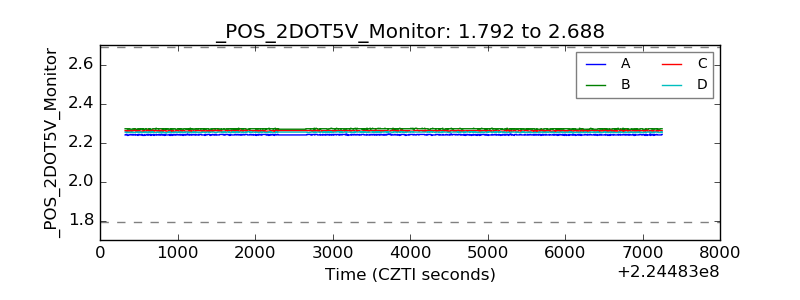 |
| +5 Volts monitor |  |
| _ROLL_ROT | 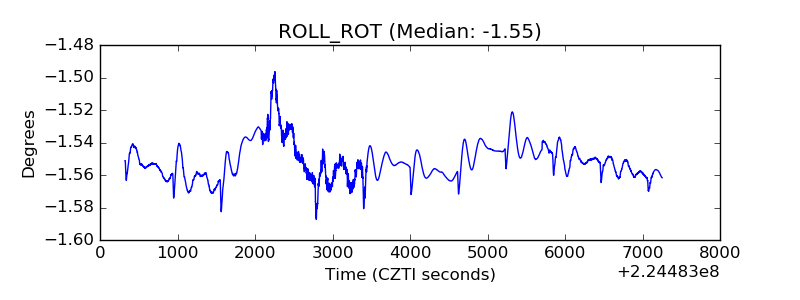 |
| _Roll_DEC | 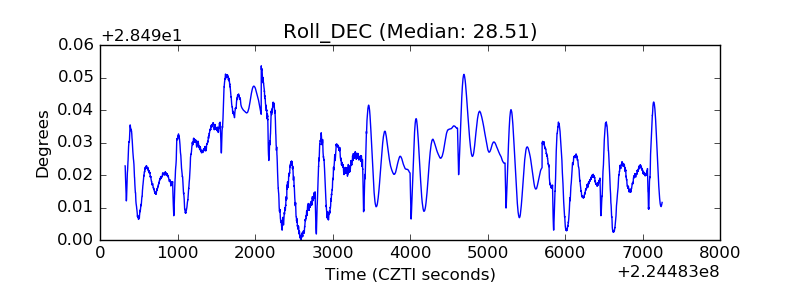 |
| _Roll_RA | 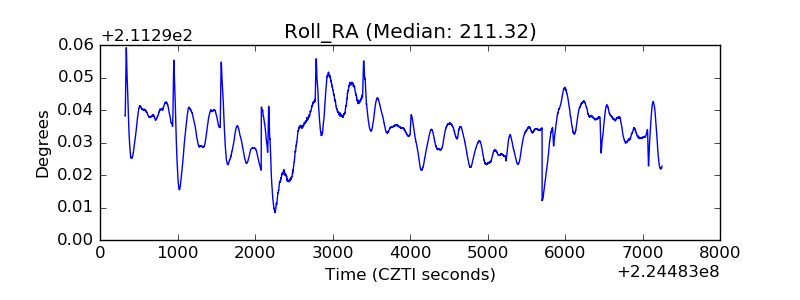 |
| Veto Counter | 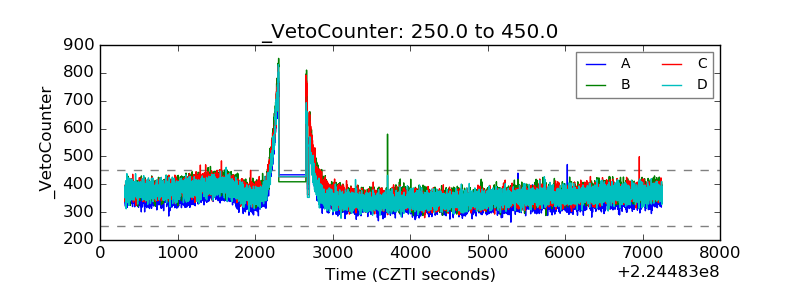 |