| Param | Original file | Final file |
|---|---|---|
| Filename | modeM0/AS1A02_150T04_9000001022_07437cztM0_level2.evt | modeM0/AS1A02_150T04_9000001022_07437cztM0_level2_quad_clean.evt |
| Size (bytes) | 1,104,209,280 | 176,230,080 |
| Size | 1.0 GB | 168.1 MB |
| Events in quadrant A | 7,153,577 | 1,056,863 |
| Events in quadrant B | 7,652,834 | 1,079,473 |
| Events in quadrant C | 9,752,846 | 1,074,521 |
| Events in quadrant D | 7,815,644 | 1,038,685 |
| Mode SS | |||
|---|---|---|---|
| Quadrant | BADHDUFLAG | Total packets | Discarded packets |
| A | 0 | 322 | 0 |
| B | 0 | 322 | 0 |
| C | 0 | 322 | 0 |
| D | 0 | 322 | 0 |
| Mode M9 | |||
|---|---|---|---|
| Quadrant | BADHDUFLAG | Total packets | Discarded packets |
| A | 0 | 5 | 0 |
| B | 0 | 5 | 0 |
| C | 0 | 5 | 0 |
| D | 0 | 5 | 0 |
| Mode M0 | |||
|---|---|---|---|
| Quadrant | BADHDUFLAG | Total packets | Discarded packets |
| A | 0 | 32406 | 3 |
| B | 0 | 33362 | 3 |
| C | 0 | 39946 | 3 |
| D | 0 | 34522 | 3 |
| Quadrant | Total seconds | Saturated seconds | Saturation percentage |
|---|---|---|---|
| A | 15760 | 229 | 1.453046% |
| B | 15760 | 293 | 1.859137% |
| C | 15760 | 206 | 1.307107% |
| D | 15760 | 261 | 1.656091% |
Noise dominated data is calculated using 1-second bins in cleaned event files. If a bin has >2000 counts, and if more than 50% of those come from <1% of pixels, then it is considered to be noise-dominated and hence unusable.
| Quadrant | # 1 sec bins | Bins with >0 counts | Bins with >2000 counts | High rate bins dominated by noise | Noise dominated (total time) | Noise dominated (detector-on time) | Marked lightcurve |
|---|---|---|---|---|---|---|---|
| A | 16270 | 15764 | 0 | 0 | 0.00% | 0.00% | 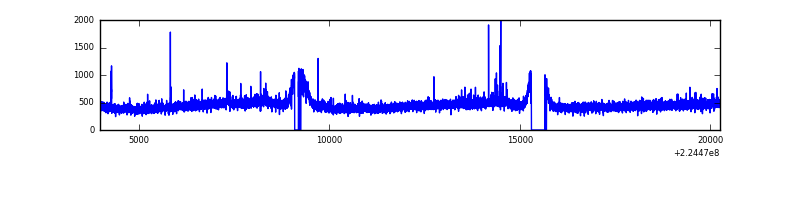 |
| B | 16270 | 15764 | 18 | 18 | 0.11% | 0.11% | 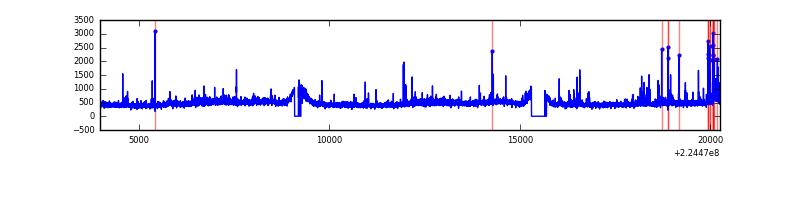 |
| C | 16270 | 15764 | 6 | 6 | 0.04% | 0.04% | 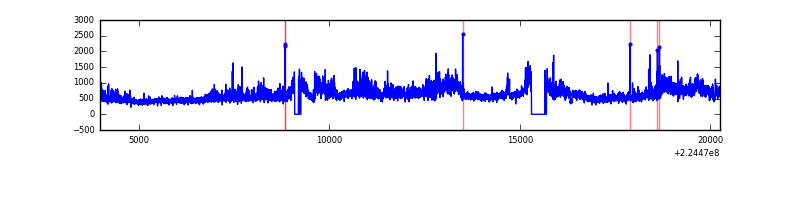 |
| D | 16270 | 15764 | 77 | 77 | 0.47% | 0.49% | 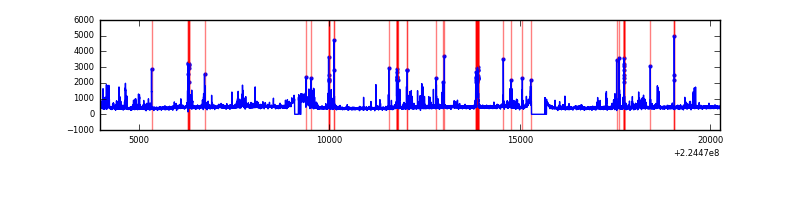 |
Top three noisy pixels from each quadrant. If the there are fewer than three noisy pixels in the level2.evt file, extra rows are filled as -1
| Pixel properties | Quadrant properties | ||||||
|---|---|---|---|---|---|---|---|
| Quadrant | DetID | PixID | Counts | Sigma | Mean | Median | Sigma |
| A | 4 | 2 | 23353 | 57.61 | 1831 | 1784 | 374.4 |
| A | 0 | 23 | 21577 | 52.87 | 1831 | 1784 | 374.4 |
| A | 3 | 1 | 21428 | 52.47 | 1831 | 1784 | 374.4 |
| B | 0 | 214 | 199482 | 560.15 | 1844 | 1794 | 352.9 |
| B | 10 | 245 | 176887 | 496.13 | 1844 | 1794 | 352.9 |
| B | 4 | 81 | 77832 | 215.45 | 1844 | 1794 | 352.9 |
| C | 9 | 68 | 2730103 | 6579.77 | 1779 | 1786 | 414.7 |
| C | 1 | 16 | 32387 | 73.8 | 1779 | 1786 | 414.7 |
| C | 8 | 128 | 27498 | 62.01 | 1779 | 1786 | 414.7 |
| D | 2 | 14 | 292490 | 666.73 | 1784 | 1727 | 436.1 |
| D | 13 | 169 | 177469 | 402.98 | 1784 | 1727 | 436.1 |
| D | 7 | 55 | 127831 | 289.16 | 1784 | 1727 | 436.1 |
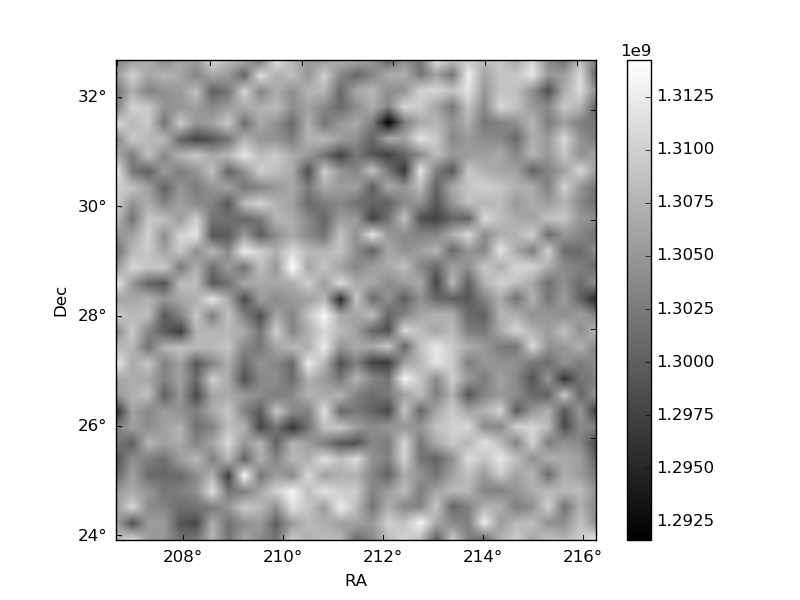
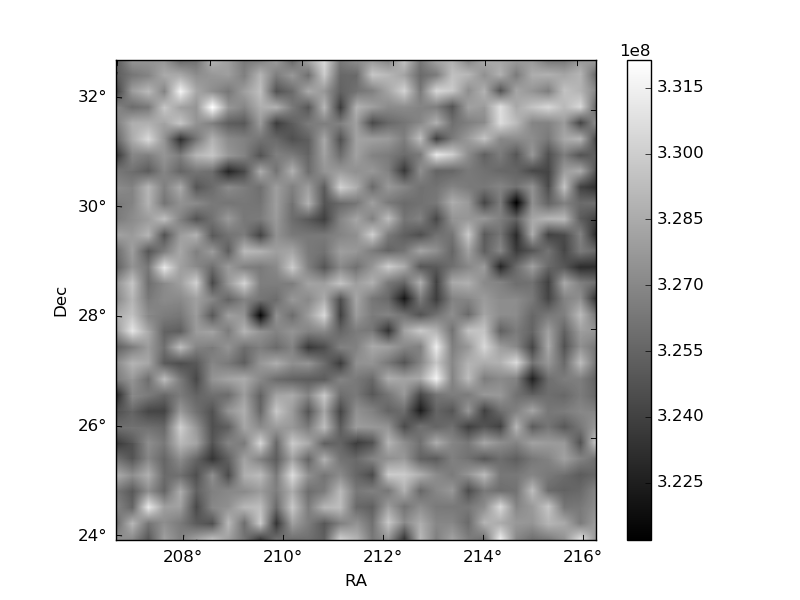
Histogram calculated using DETX and DETY for each event in the final _common_clean file
| Quadrant A | 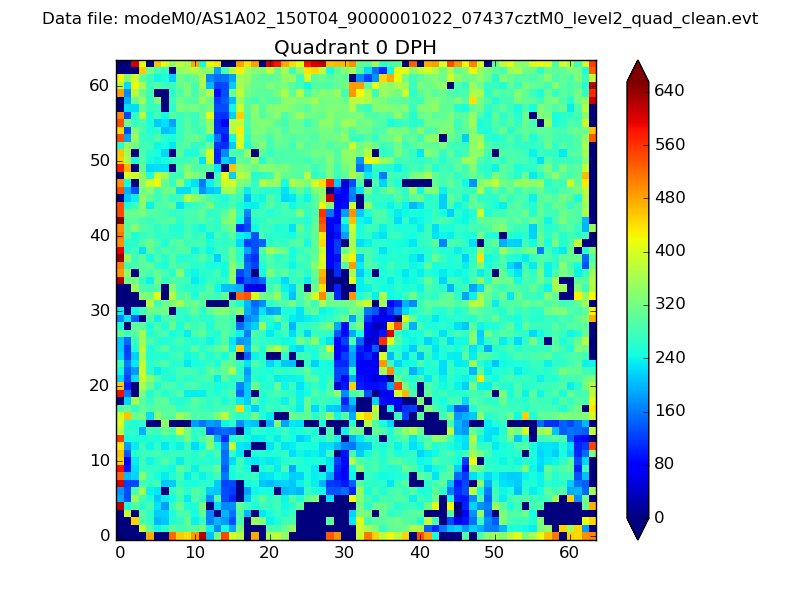 |
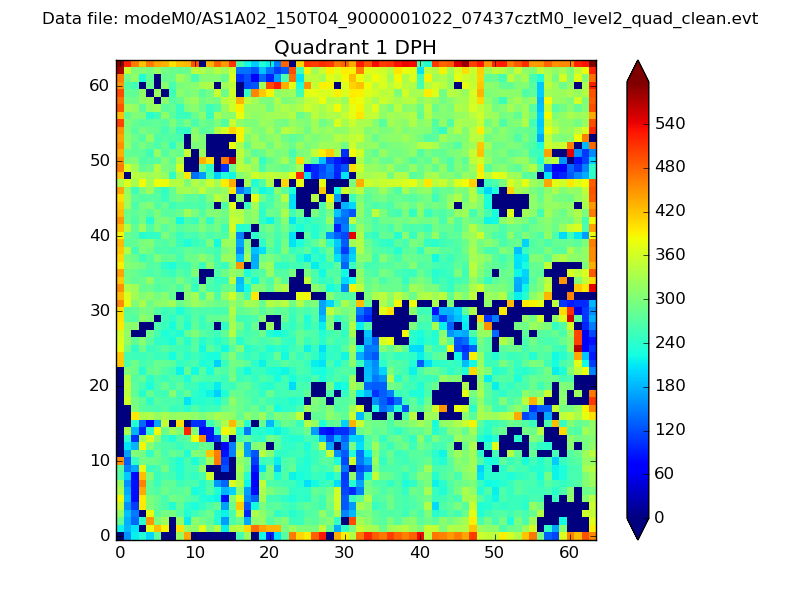 |
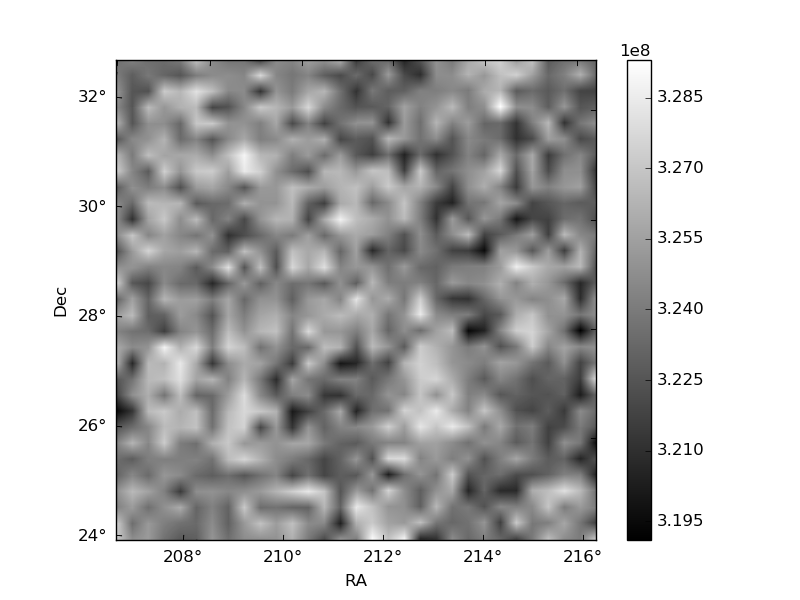
Quadrant B |
|---|---|---|---|
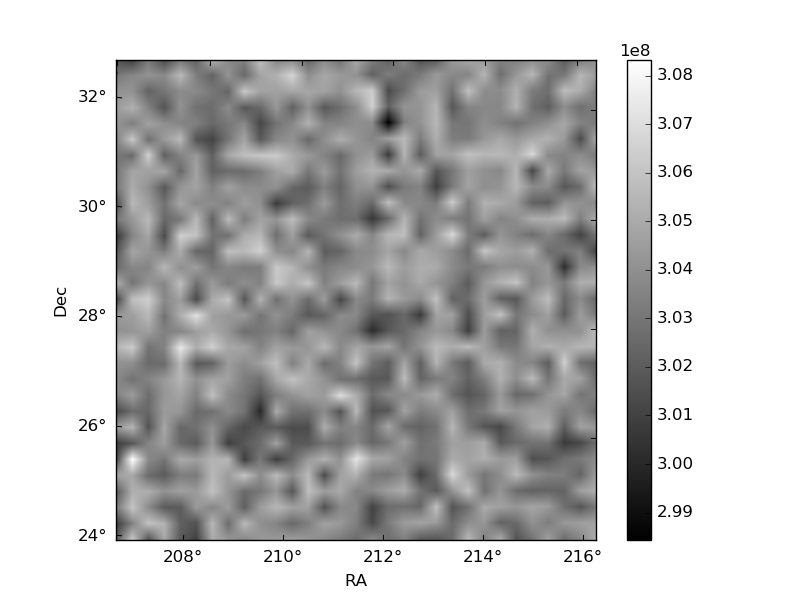
| Quadrant D | 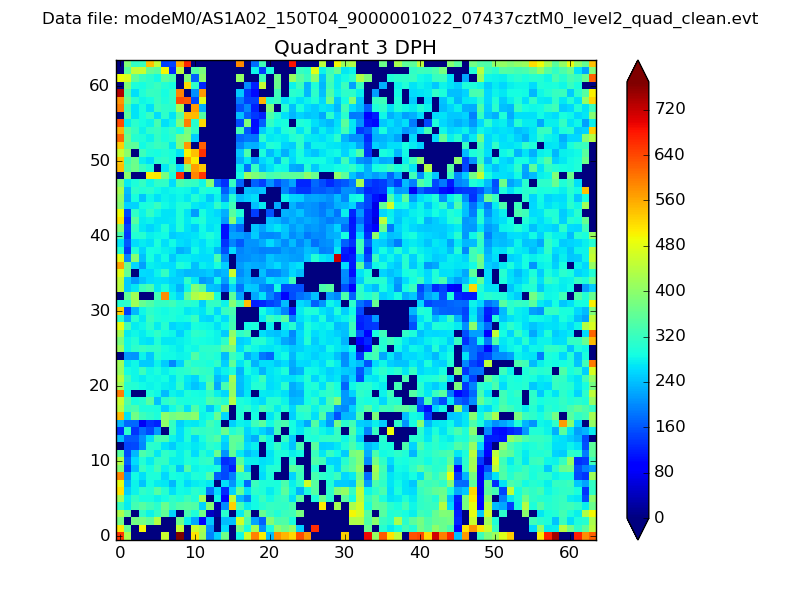 |
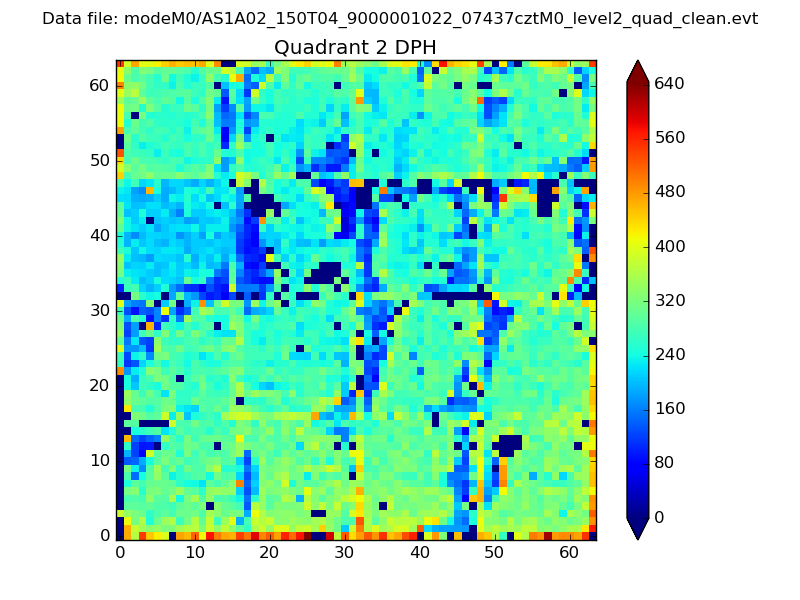 |
Quadrant C |
| Plot type | Count rate plots | Images |
|---|---|---|
| Comparison with Poisson distribution Blue bars denote a histogram of data divided into 1 sec bins. Red curve is a Poisson curve with rate = median count rate of data. |
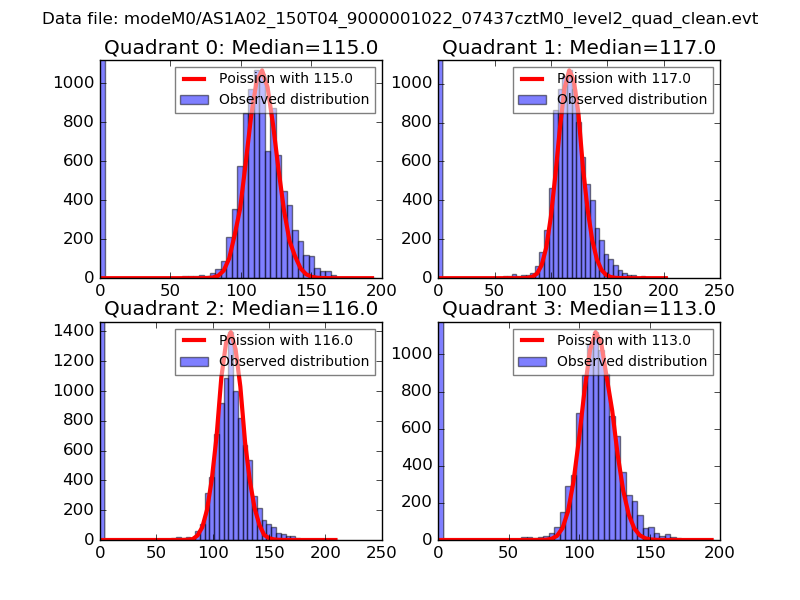 |
 |
| Quadrant-wise count rates Data is divided into 100 sec bins |
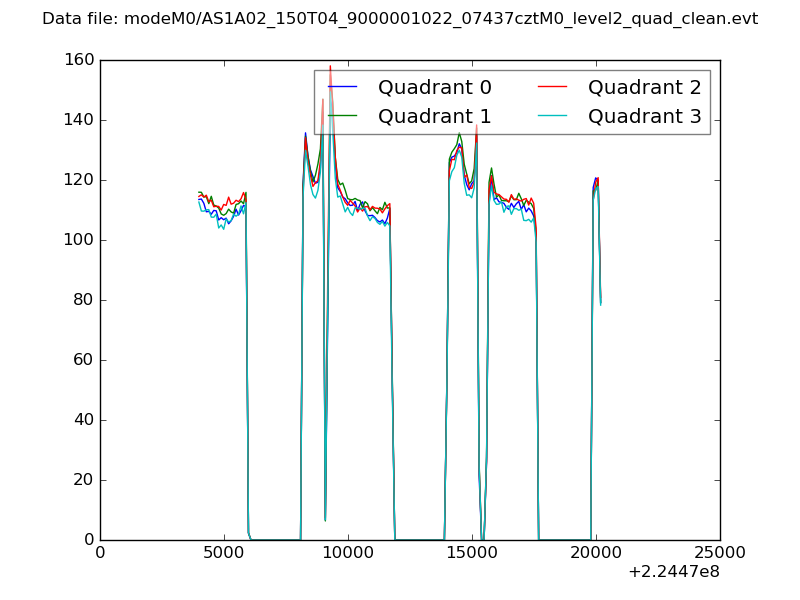 |
|
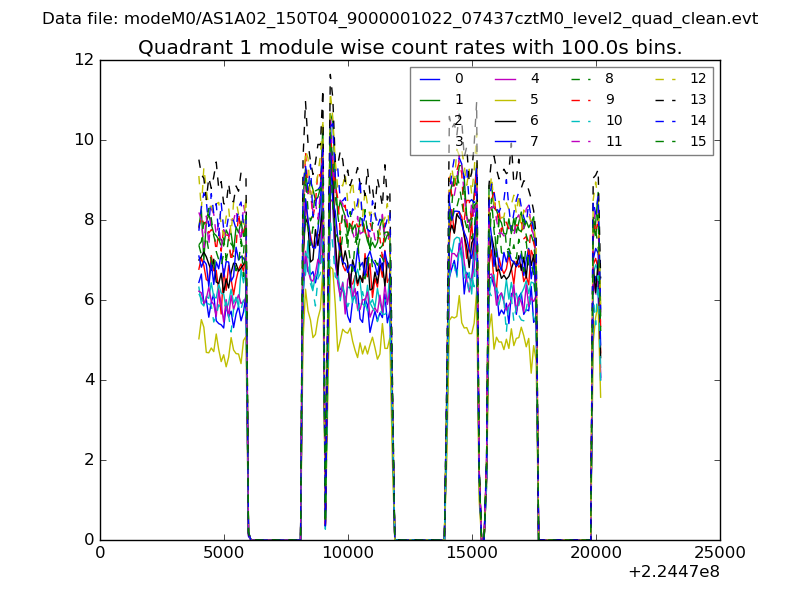
| Module-wise count rates for Quadrant A Data is divided into 100 sec bins |
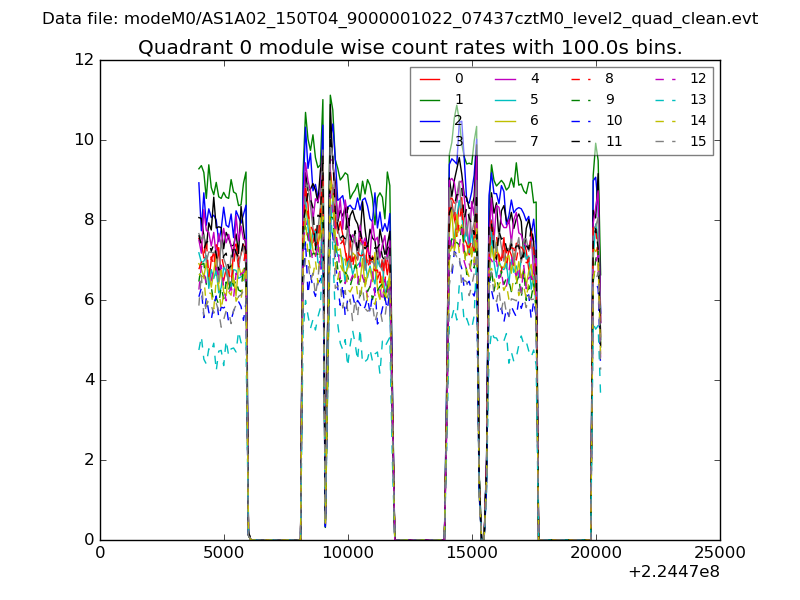 |
 |
| Module-wise count rates for Quadrant B Data is divided into 100 sec bins |
 |
 |
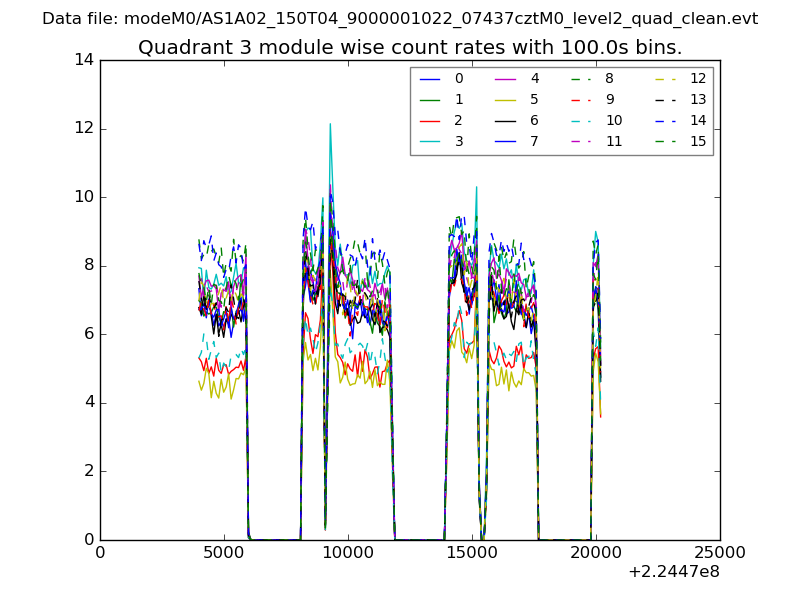
| Module-wise count rates for Quadrant C Data is divided into 100 sec bins |
 |
 |
| Module-wise count rates for Quadrant D Data is divided into 100 sec bins |
 |
 |
| Parameter | Plot |
|---|---|
| CZT HV Monitor | 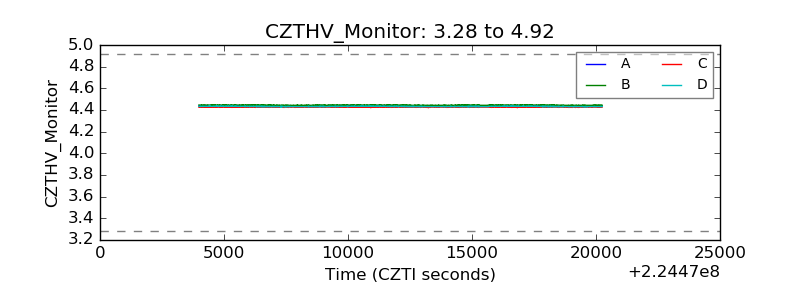 |
| D_VDD | 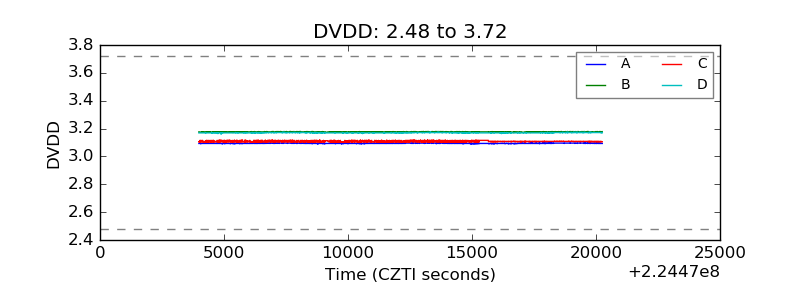 |
| Temperature 1 | 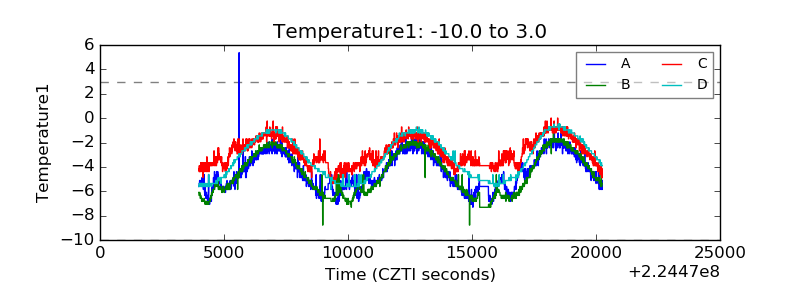 |
| Veto HV Monitor |  |
| Veto LLD | 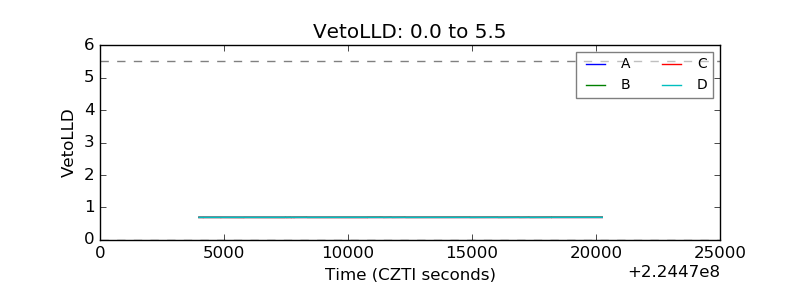 |
| Alpha Counter | 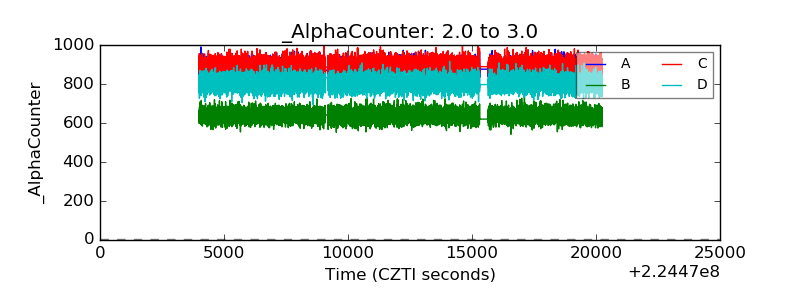 |
| _CPM_Rate | 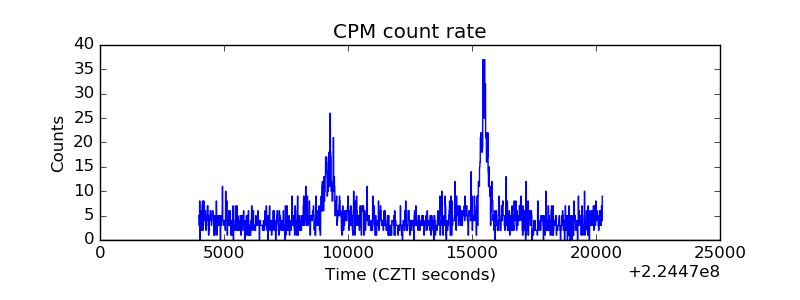 |
| CZT Counter | 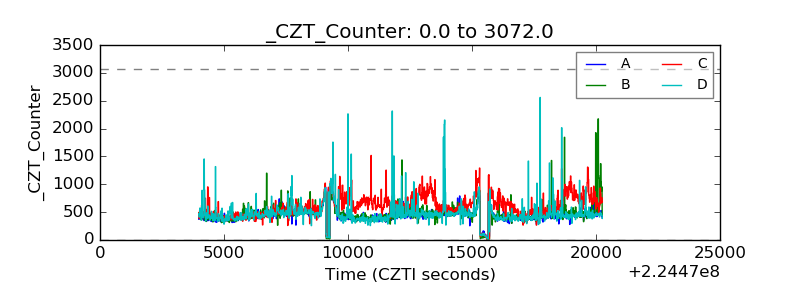 |
| +2.5 Volts monitor |  |
| +5 Volts monitor |  |
| _ROLL_ROT | 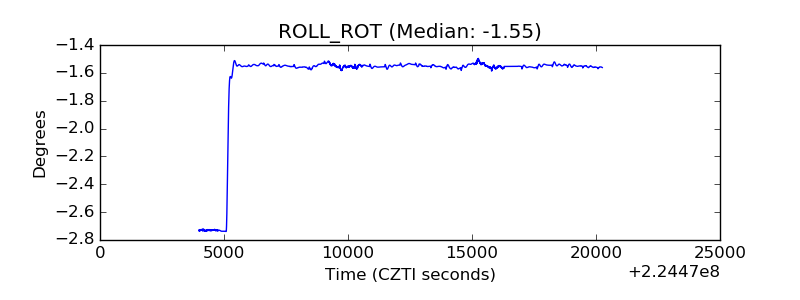 |
| _Roll_DEC | 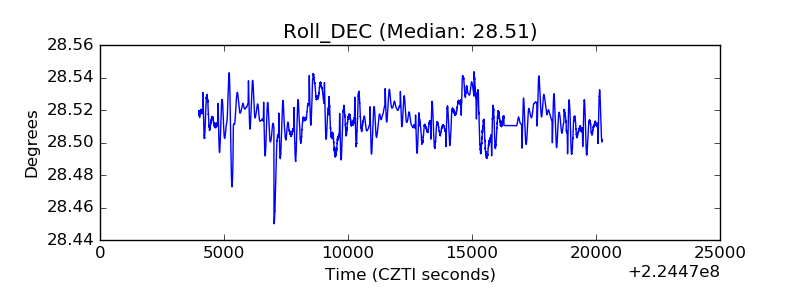 |
| _Roll_RA | 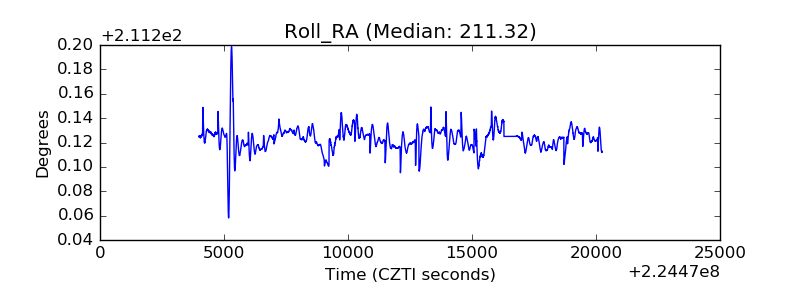 |
| Veto Counter | 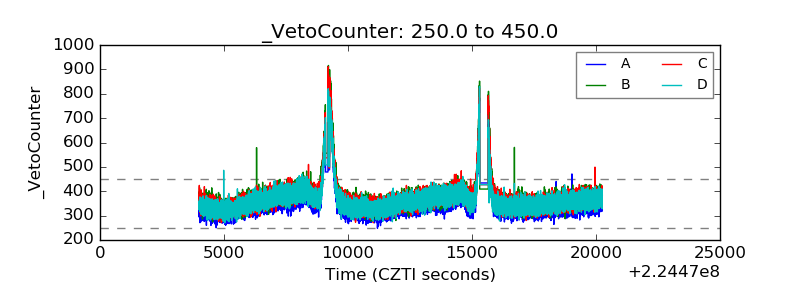 |