| Param | Original file | Final file |
|---|---|---|
| Filename | modeM0/AS1A02_108T01_9000001024_07435cztM0_level2.evt | modeM0/AS1A02_108T01_9000001024_07435cztM0_level2_quad_clean.evt |
| Size (bytes) | 1,201,181,760 | 197,277,120 |
| Size | 1.1 GB | 188.1 MB |
| Events in quadrant A | 7,660,492 | 1,218,047 |
| Events in quadrant B | 7,821,801 | 1,239,572 |
| Events in quadrant C | 10,728,126 | 1,204,273 |
| Events in quadrant D | 9,040,724 | 1,163,151 |
| Mode SS | |||
|---|---|---|---|
| Quadrant | BADHDUFLAG | Total packets | Discarded packets |
| A | 0 | 340 | 0 |
| B | 0 | 340 | 0 |
| C | 0 | 340 | 0 |
| D | 0 | 340 | 0 |
| Mode M9 | |||
|---|---|---|---|
| Quadrant | BADHDUFLAG | Total packets | Discarded packets |
| A | 0 | 33 | 0 |
| B | 0 | 33 | 0 |
| C | 0 | 33 | 0 |
| D | 0 | 33 | 0 |
| Mode M0 | |||
|---|---|---|---|
| Quadrant | BADHDUFLAG | Total packets | Discarded packets |
| A | 0 | 34169 | 4 |
| B | 0 | 34325 | 3 |
| C | 0 | 42771 | 3 |
| D | 0 | 38593 | 3 |
| Quadrant | Total seconds | Saturated seconds | Saturation percentage |
|---|---|---|---|
| A | 16675 | 253 | 1.517241% |
| B | 16675 | 242 | 1.451274% |
| C | 16675 | 313 | 1.877061% |
| D | 16675 | 493 | 2.956522% |
Noise dominated data is calculated using 1-second bins in cleaned event files. If a bin has >2000 counts, and if more than 50% of those come from <1% of pixels, then it is considered to be noise-dominated and hence unusable.
| Quadrant | # 1 sec bins | Bins with >0 counts | Bins with >2000 counts | High rate bins dominated by noise | Noise dominated (total time) | Noise dominated (detector-on time) | Marked lightcurve |
|---|---|---|---|---|---|---|---|
| A | 19890 | 16678 | 1 | 1 | 0.01% | 0.01% | 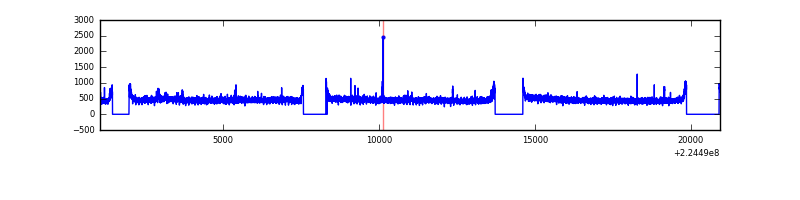 |
| B | 19890 | 16678 | 4 | 4 | 0.02% | 0.02% | 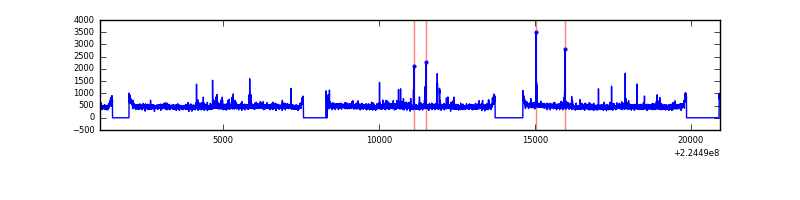 |
| C | 19890 | 16679 | 16 | 16 | 0.08% | 0.10% | 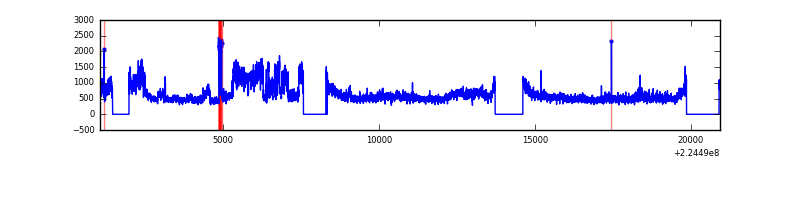 |
| D | 19889 | 16676 | 220 | 220 | 1.11% | 1.32% | 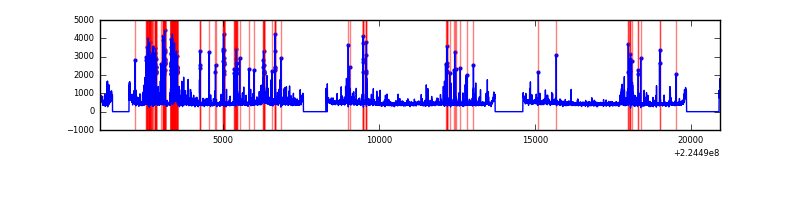 |
Top three noisy pixels from each quadrant. If the there are fewer than three noisy pixels in the level2.evt file, extra rows are filled as -1
| Pixel properties | Quadrant properties | ||||||
|---|---|---|---|---|---|---|---|
| Quadrant | DetID | PixID | Counts | Sigma | Mean | Median | Sigma |
| A | 15 | 239 | 121187 | 302.67 | 1941 | 1896 | 394.1 |
| A | 15 | 234 | 56250 | 137.91 | 1941 | 1896 | 394.1 |
| A | 0 | 226 | 18414 | 41.91 | 1941 | 1896 | 394.1 |
| B | 0 | 214 | 107746 | 283.97 | 1952 | 1900 | 372.7 |
| B | 4 | 81 | 88372 | 232.0 | 1952 | 1900 | 372.7 |
| B | 12 | 111 | 39136 | 99.9 | 1952 | 1900 | 372.7 |
| C | 9 | 68 | 3321264 | 7590.16 | 1892 | 1900 | 437.3 |
| C | 1 | 16 | 20126 | 41.68 | 1892 | 1900 | 437.3 |
| C | 13 | 61 | 14635 | 29.12 | 1892 | 1900 | 437.3 |
| D | 15 | 47 | 831508 | 1804.87 | 1885 | 1828 | 459.7 |
| D | 2 | 14 | 318181 | 688.19 | 1885 | 1828 | 459.7 |
| D | 1 | 52 | 211708 | 456.57 | 1885 | 1828 | 459.7 |
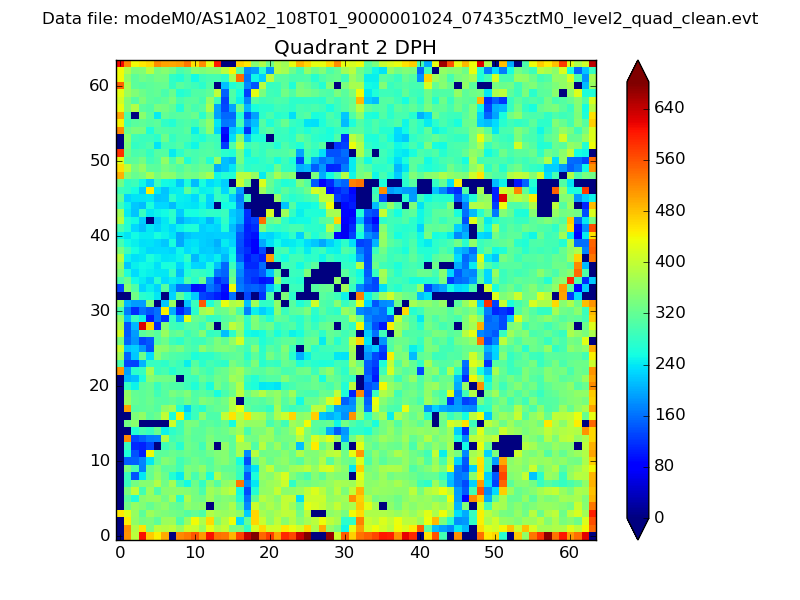
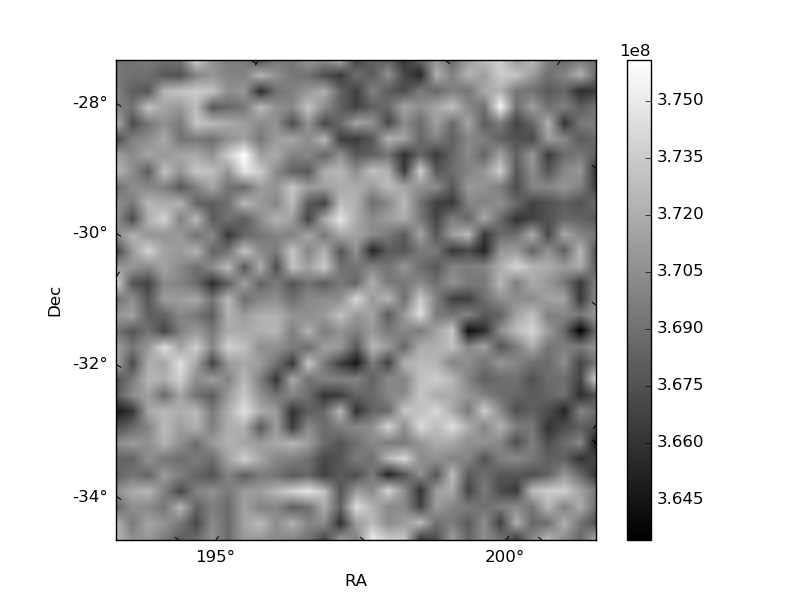
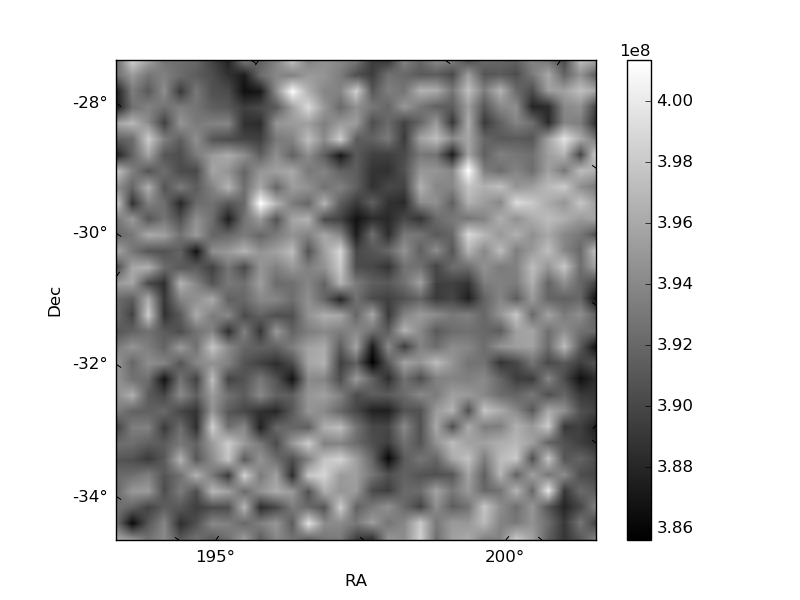
Histogram calculated using DETX and DETY for each event in the final _common_clean file
| Quadrant A | 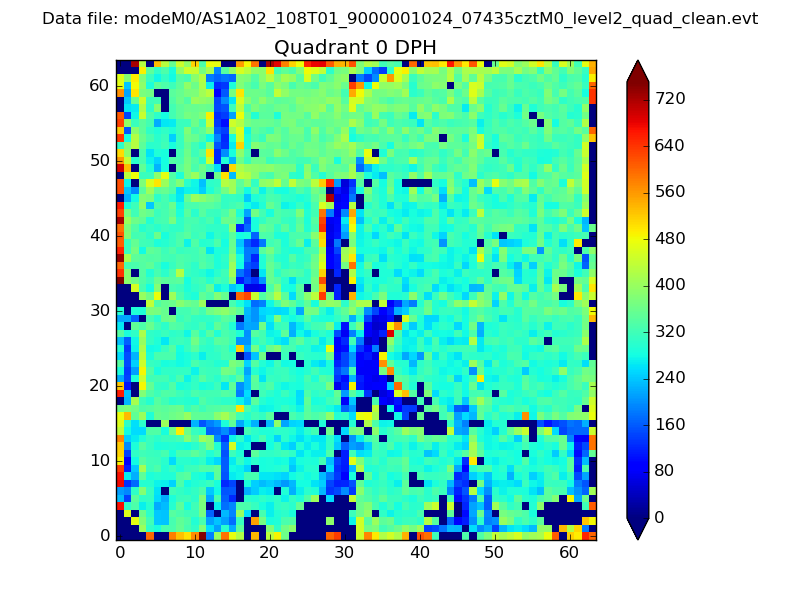 |
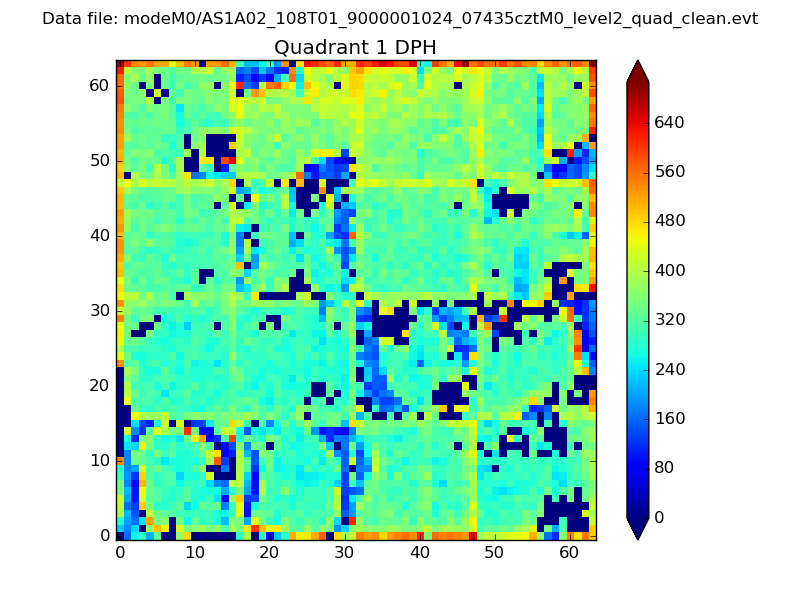 |
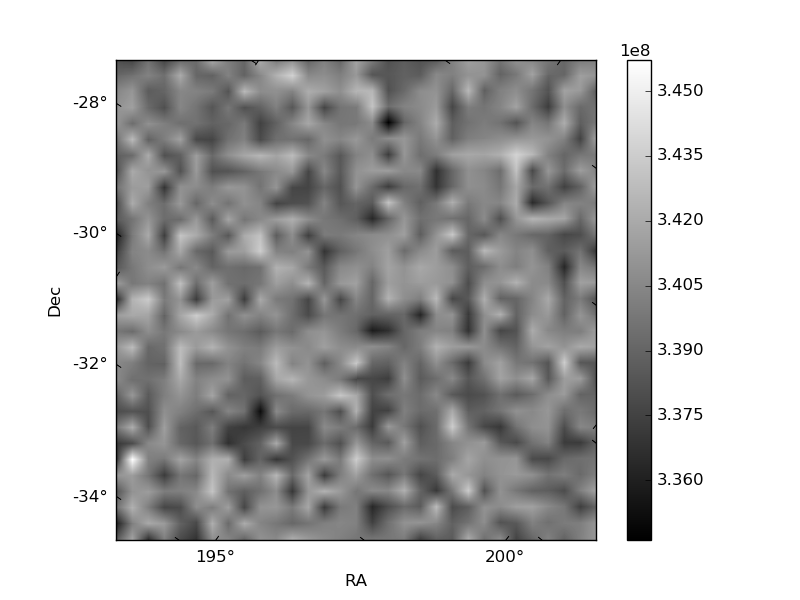
Quadrant B |
|---|---|---|---|
| Quadrant D | 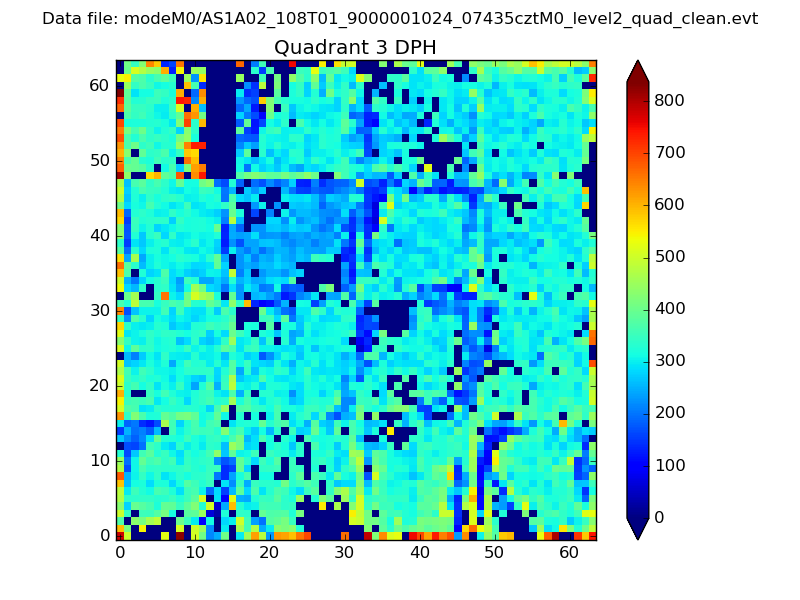 |
 |
Quadrant C |
| Plot type | Count rate plots | Images |
|---|---|---|
| Comparison with Poisson distribution Blue bars denote a histogram of data divided into 1 sec bins. Red curve is a Poisson curve with rate = median count rate of data. |
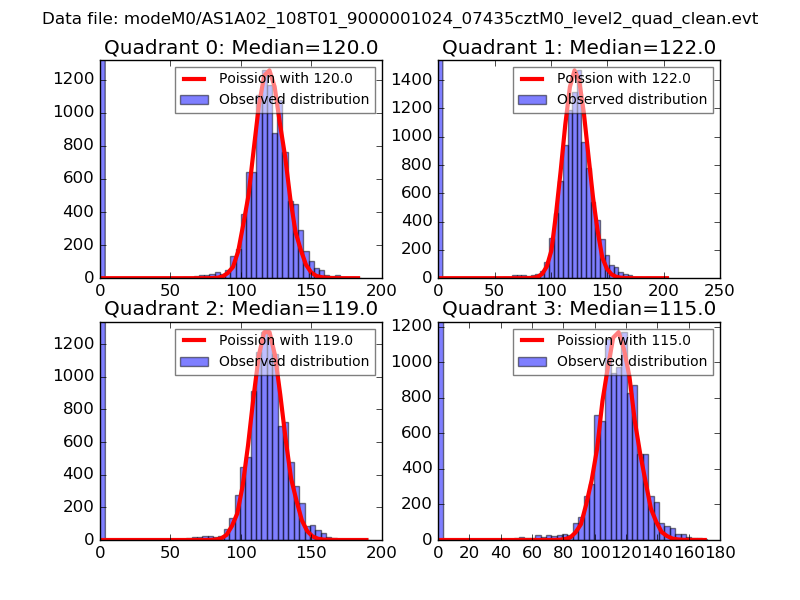 |
 |
| Quadrant-wise count rates Data is divided into 100 sec bins |
 |
|
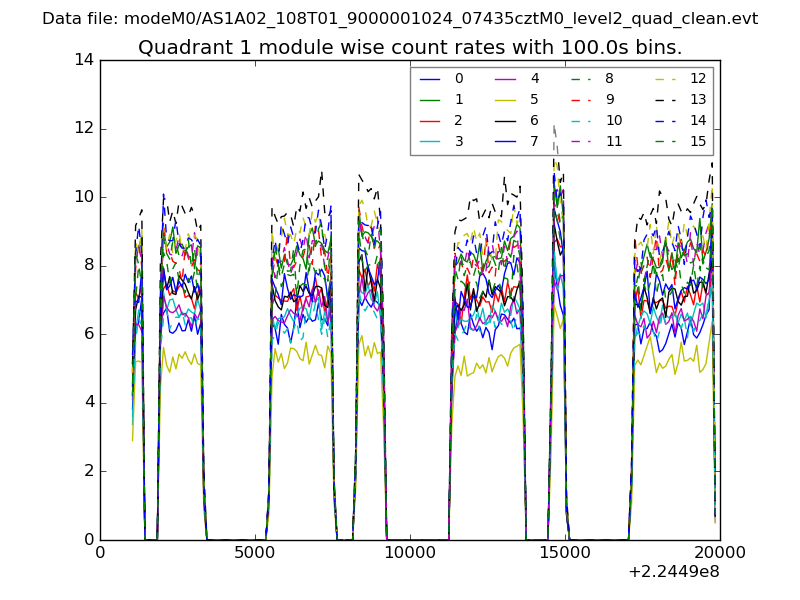
| Module-wise count rates for Quadrant A Data is divided into 100 sec bins |
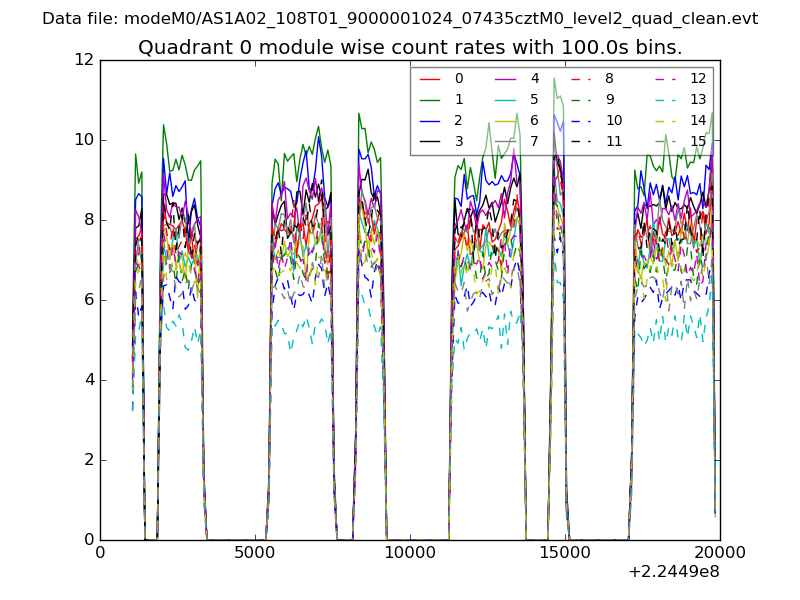 |
 |
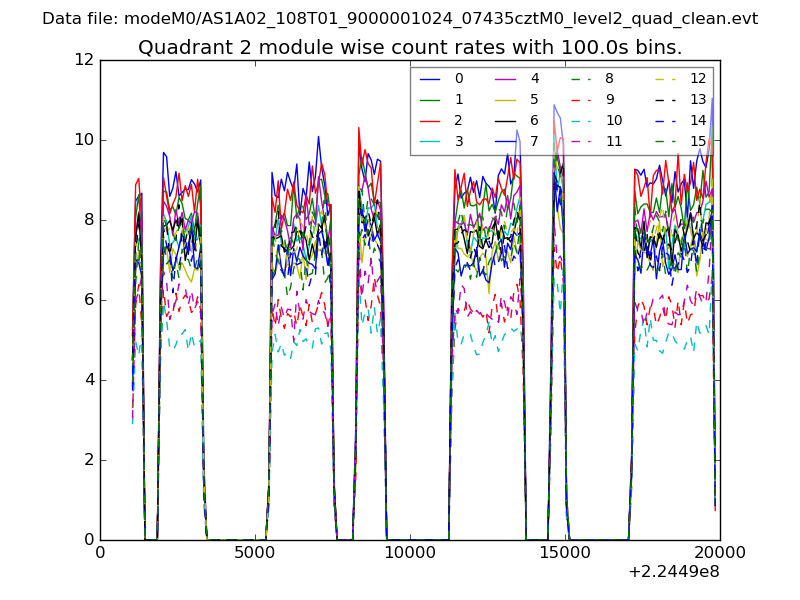
| Module-wise count rates for Quadrant B Data is divided into 100 sec bins |
 |
 |
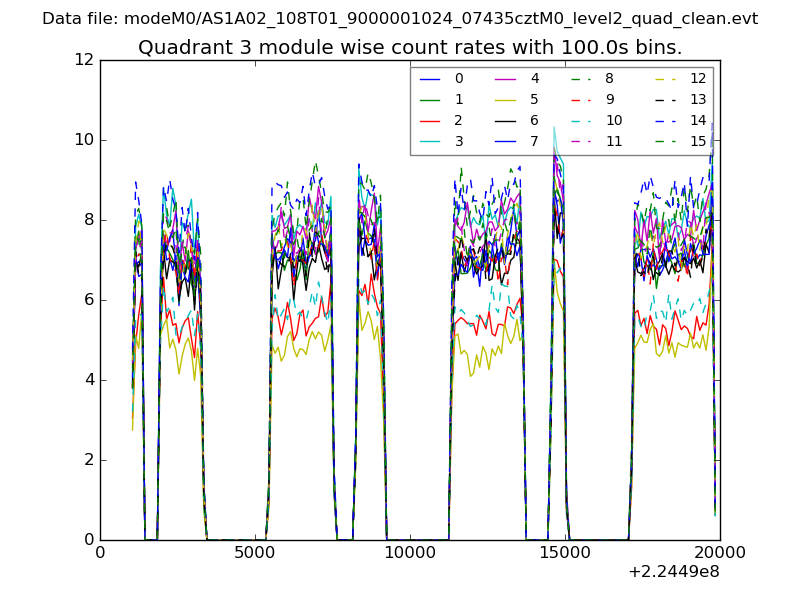
| Module-wise count rates for Quadrant C Data is divided into 100 sec bins |
 |
 |
| Module-wise count rates for Quadrant D Data is divided into 100 sec bins |
 |
 |
| Parameter | Plot |
|---|---|
| CZT HV Monitor | 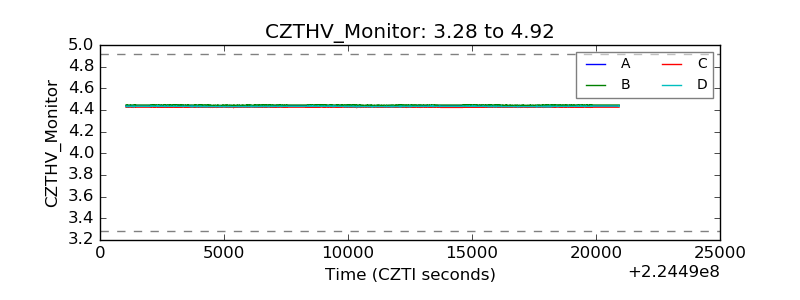 |
| D_VDD | 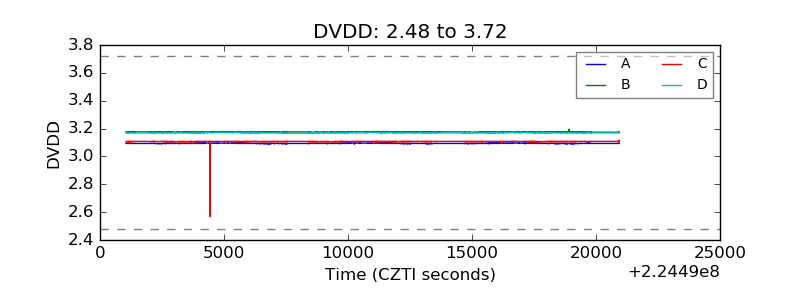 |
| Temperature 1 | 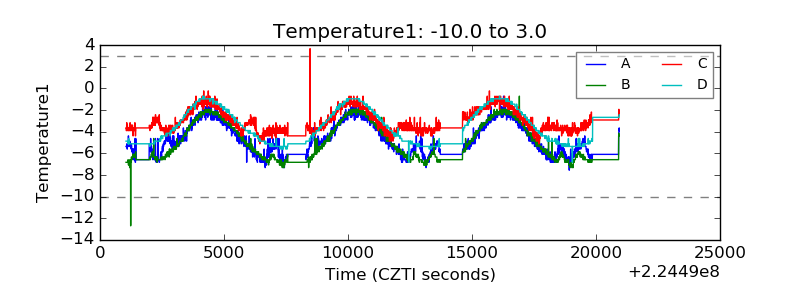 |
| Veto HV Monitor |  |
| Veto LLD | 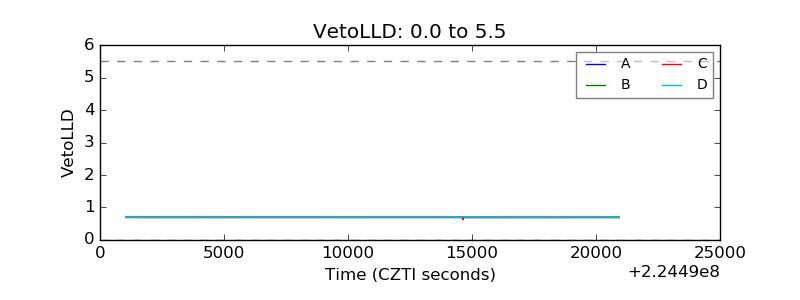 |
| Alpha Counter |  |
| _CPM_Rate | 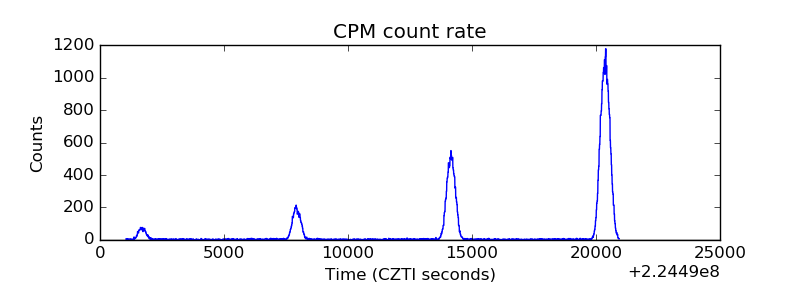 |
| CZT Counter | 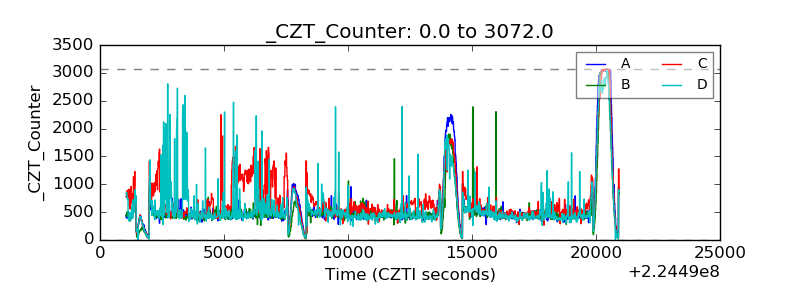 |
| +2.5 Volts monitor |  |
| +5 Volts monitor |  |
| _ROLL_ROT | 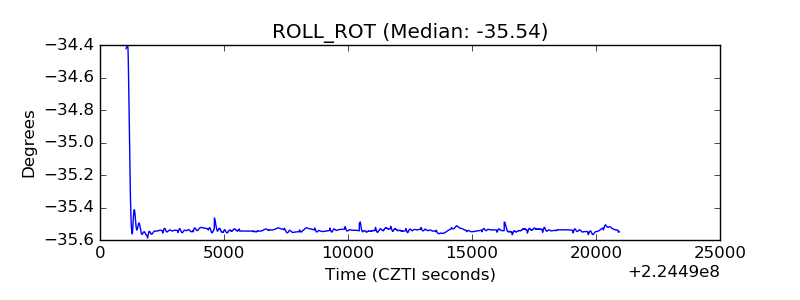 |
| _Roll_DEC | 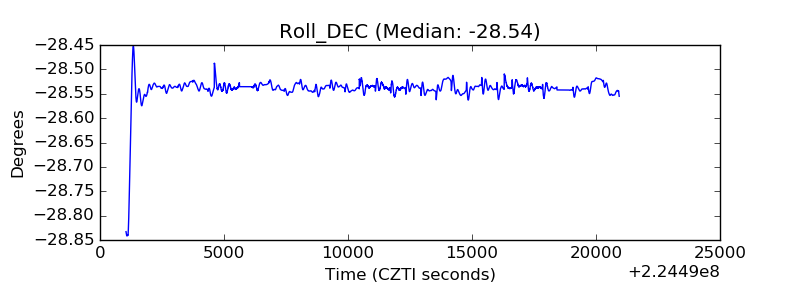 |
| _Roll_RA | 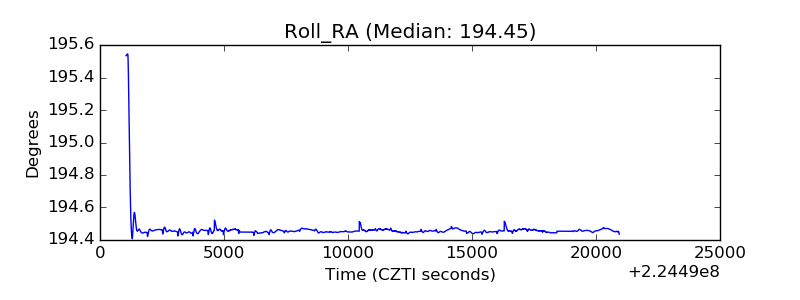 |
| Veto Counter | 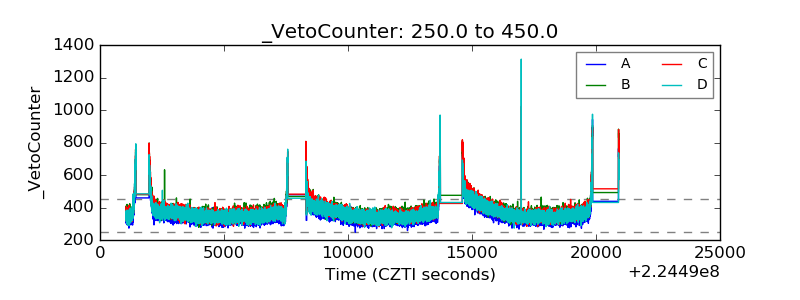 |