| Param | Original file | Final file |
|---|---|---|
| Filename | modeM0/AS1A02_108T01_9000001024_07437cztM0_level2.evt | modeM0/AS1A02_108T01_9000001024_07437cztM0_level2_quad_clean.evt |
| Size (bytes) | 1,624,898,880 | 240,791,040 |
| Size | 1.5 GB | 229.6 MB |
| Events in quadrant A | 10,441,763 | 1,453,835 |
| Events in quadrant B | 10,702,269 | 1,477,179 |
| Events in quadrant C | 14,320,641 | 1,433,470 |
| Events in quadrant D | 12,234,538 | 1,387,301 |
| Mode SS | |||
|---|---|---|---|
| Quadrant | BADHDUFLAG | Total packets | Discarded packets |
| A | 0 | 456 | 0 |
| B | 0 | 456 | 0 |
| C | 0 | 456 | 0 |
| D | 0 | 456 | 0 |
| Mode M9 | |||
|---|---|---|---|
| Quadrant | BADHDUFLAG | Total packets | Discarded packets |
| A | 0 | 41 | 0 |
| B | 0 | 41 | 0 |
| C | 0 | 41 | 0 |
| D | 0 | 42 | 0 |
| Mode M0 | |||
|---|---|---|---|
| Quadrant | BADHDUFLAG | Total packets | Discarded packets |
| A | 0 | 46124 | 6 |
| B | 0 | 46612 | 5 |
| C | 0 | 57751 | 5 |
| D | 0 | 51806 | 5 |
| Quadrant | Total seconds | Saturated seconds | Saturation percentage |
|---|---|---|---|
| A | 22378 | 272 | 1.215479% |
| B | 22378 | 260 | 1.161855% |
| C | 22378 | 318 | 1.421039% |
| D | 22378 | 646 | 2.886764% |
Noise dominated data is calculated using 1-second bins in cleaned event files. If a bin has >2000 counts, and if more than 50% of those come from <1% of pixels, then it is considered to be noise-dominated and hence unusable.
| Quadrant | # 1 sec bins | Bins with >0 counts | Bins with >2000 counts | High rate bins dominated by noise | Noise dominated (total time) | Noise dominated (detector-on time) | Marked lightcurve |
|---|---|---|---|---|---|---|---|
| A | 27776 | 22382 | 1 | 1 | 0.00% | 0.00% | 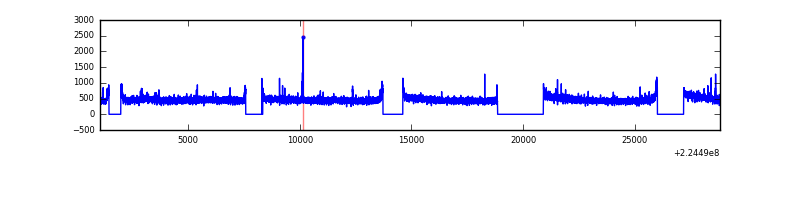 |
| B | 27776 | 22382 | 6 | 6 | 0.02% | 0.03% | 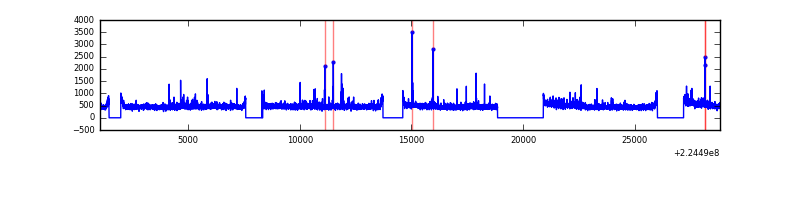 |
| C | 27776 | 22383 | 16 | 16 | 0.06% | 0.07% | 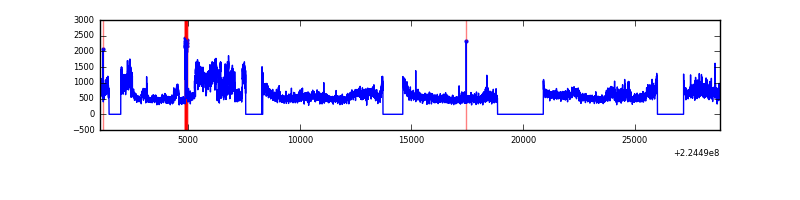 |
| D | 27776 | 22381 | 330 | 330 | 1.19% | 1.47% | 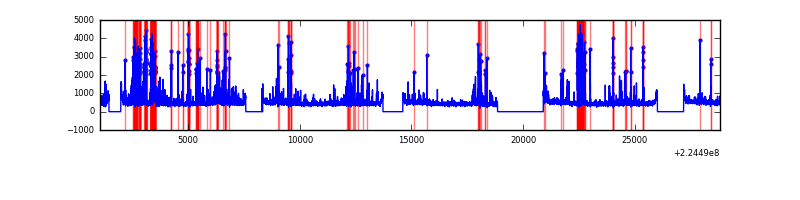 |
Top three noisy pixels from each quadrant. If the there are fewer than three noisy pixels in the level2.evt file, extra rows are filled as -1
| Pixel properties | Quadrant properties | ||||||
|---|---|---|---|---|---|---|---|
| Quadrant | DetID | PixID | Counts | Sigma | Mean | Median | Sigma |
| A | 15 | 239 | 145022 | 265.86 | 2655 | 2590 | 535.7 |
| A | 15 | 234 | 54420 | 96.74 | 2655 | 2590 | 535.7 |
| A | 0 | 226 | 25460 | 42.69 | 2655 | 2590 | 535.7 |
| B | 0 | 214 | 206166 | 403.59 | 2668 | 2602 | 504.4 |
| B | 4 | 81 | 89550 | 172.39 | 2668 | 2602 | 504.4 |
| B | 12 | 111 | 52170 | 98.28 | 2668 | 2602 | 504.4 |
| C | 9 | 68 | 4205967 | 7112.4 | 2578 | 2594 | 591.0 |
| C | 1 | 16 | 21929 | 32.72 | 2578 | 2594 | 591.0 |
| C | 13 | 61 | 19993 | 29.44 | 2578 | 2594 | 591.0 |
| D | 15 | 47 | 832618 | 1330.81 | 2569 | 2487 | 623.8 |
| D | 13 | 105 | 461258 | 735.47 | 2569 | 2487 | 623.8 |
| D | 2 | 14 | 397528 | 633.3 | 2569 | 2487 | 623.8 |
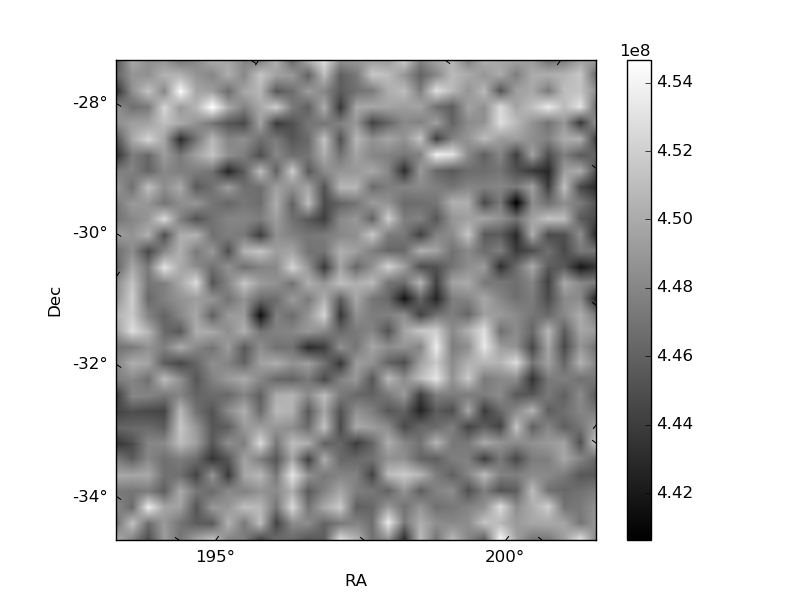
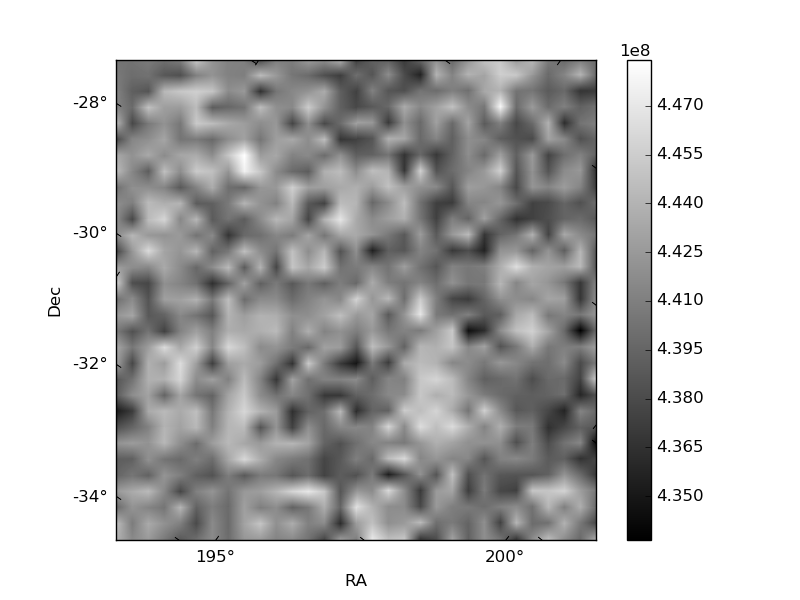
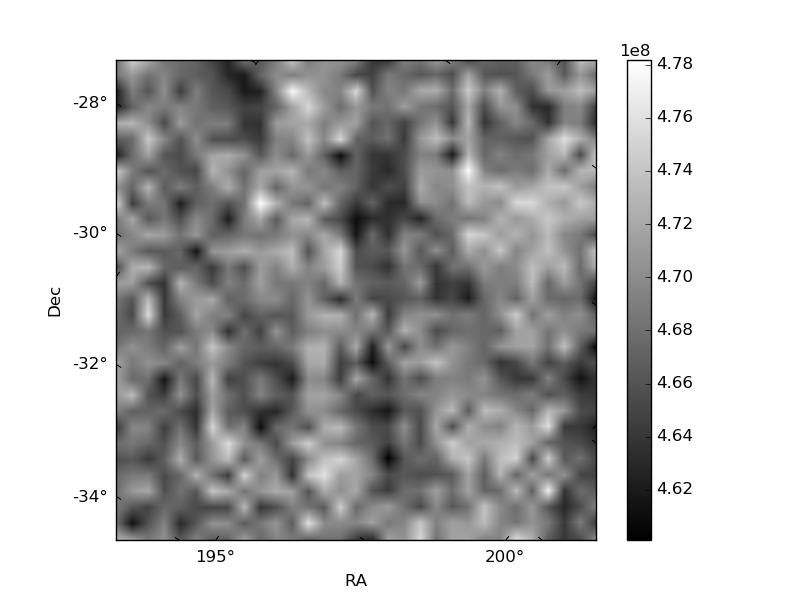
Histogram calculated using DETX and DETY for each event in the final _common_clean file
| Quadrant A | 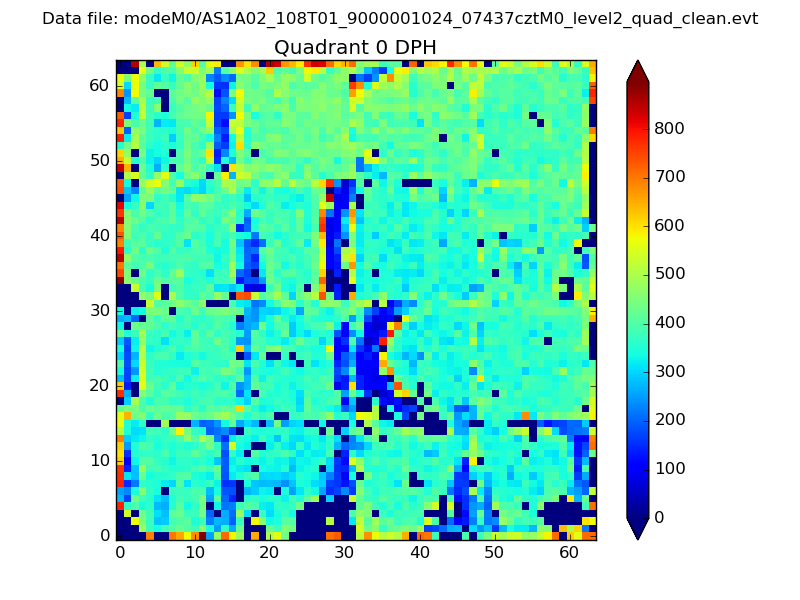 |
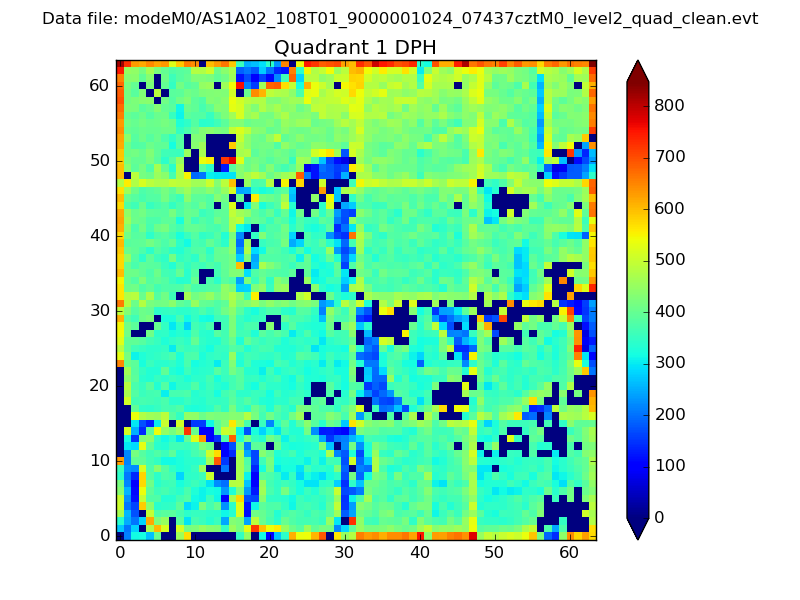 |
Quadrant B |
|---|---|---|---|
| Quadrant D | 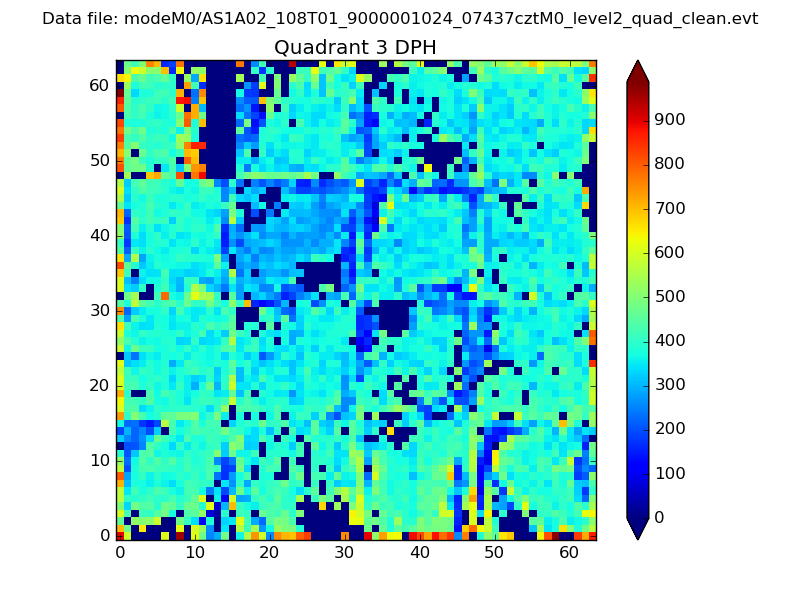 |
 |
Quadrant C |
| Plot type | Count rate plots | Images |
|---|---|---|
| Comparison with Poisson distribution Blue bars denote a histogram of data divided into 1 sec bins. Red curve is a Poisson curve with rate = median count rate of data. |
 |
 |
| Quadrant-wise count rates Data is divided into 100 sec bins |
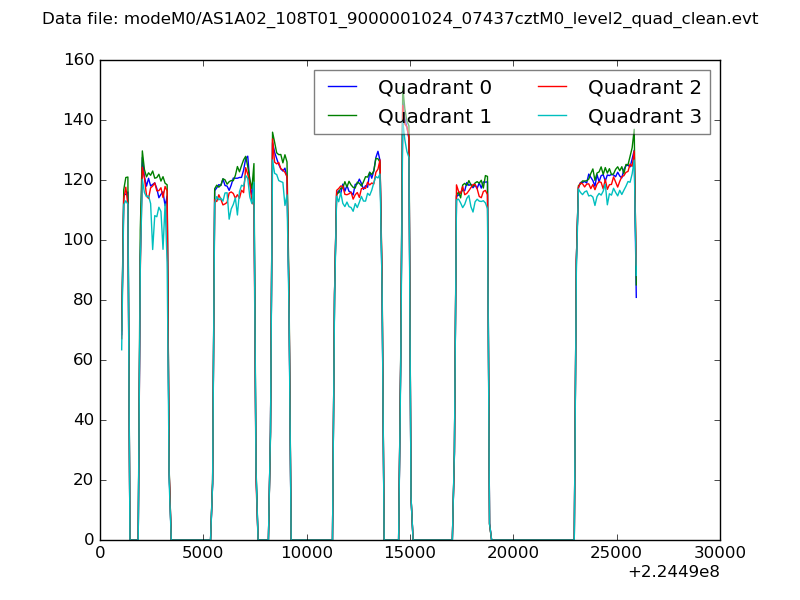 |
|
| Module-wise count rates for Quadrant A Data is divided into 100 sec bins |
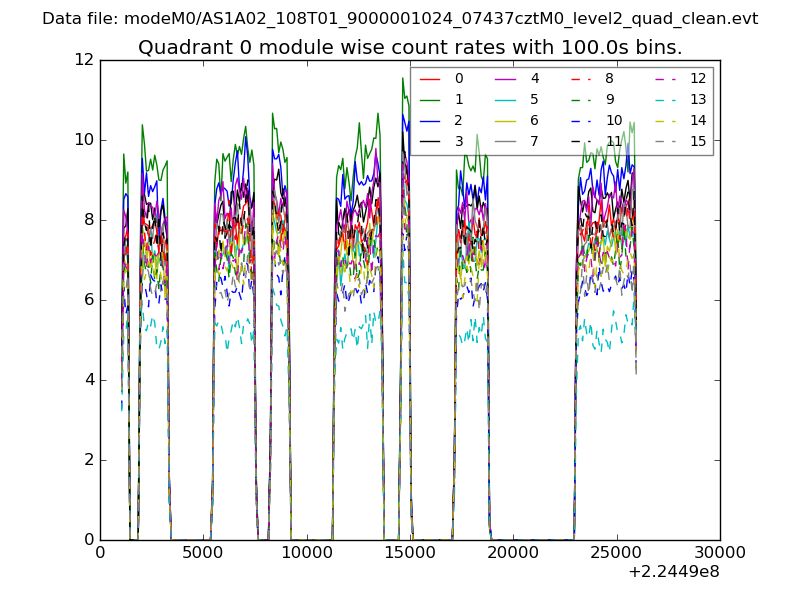 |
 |
| Module-wise count rates for Quadrant B Data is divided into 100 sec bins |
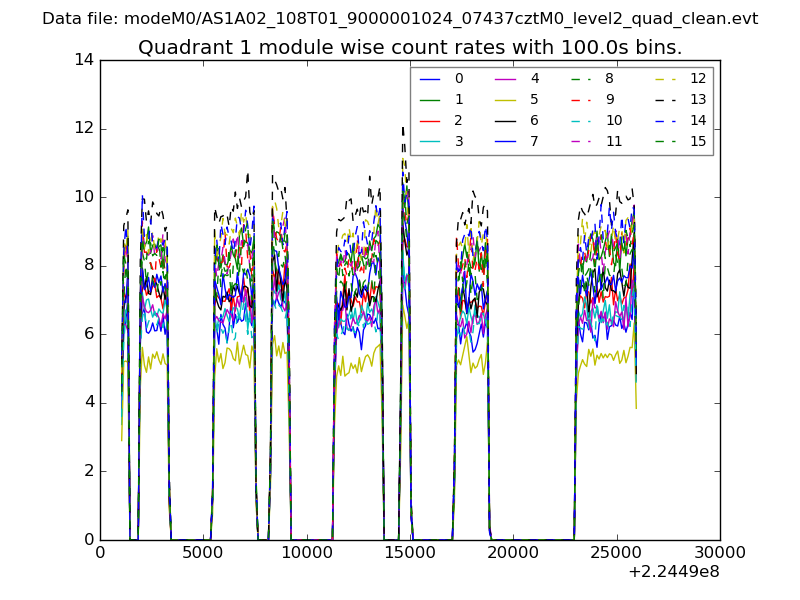 |
 |
| Module-wise count rates for Quadrant C Data is divided into 100 sec bins |
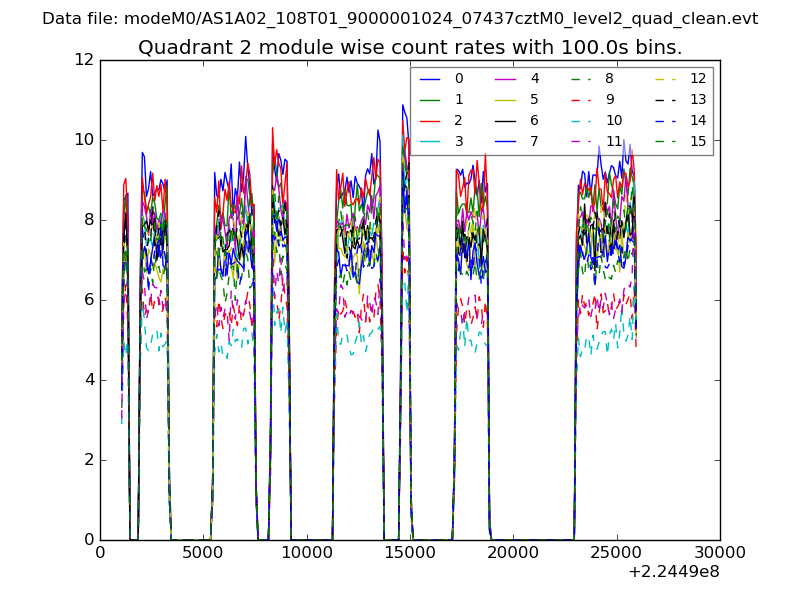 |
 |
| Module-wise count rates for Quadrant D Data is divided into 100 sec bins |
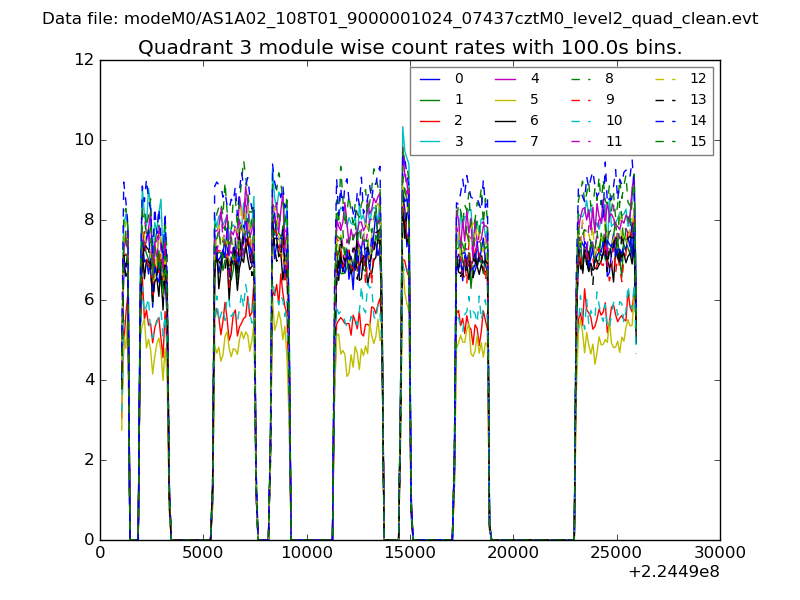 |
 |
| Parameter | Plot |
|---|---|
| CZT HV Monitor |  |
| D_VDD |  |
| Temperature 1 | 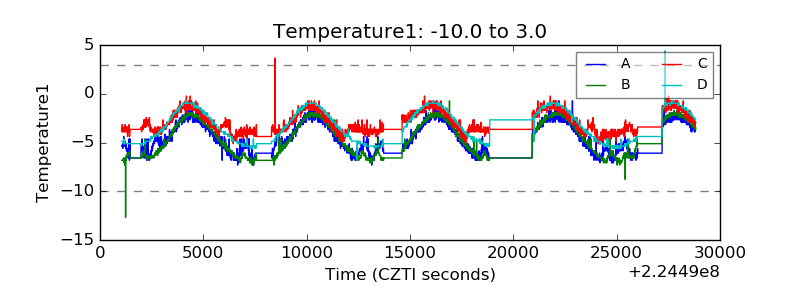 |
| Veto HV Monitor | 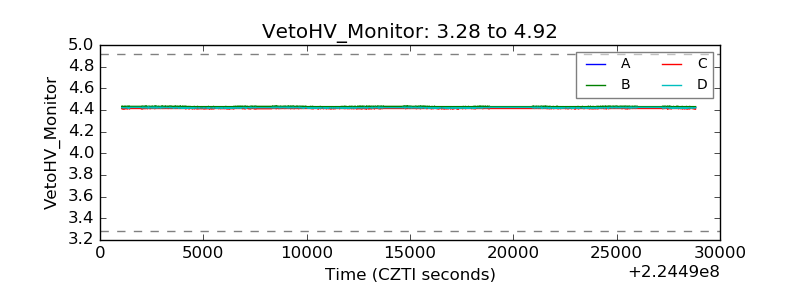 |
| Veto LLD | 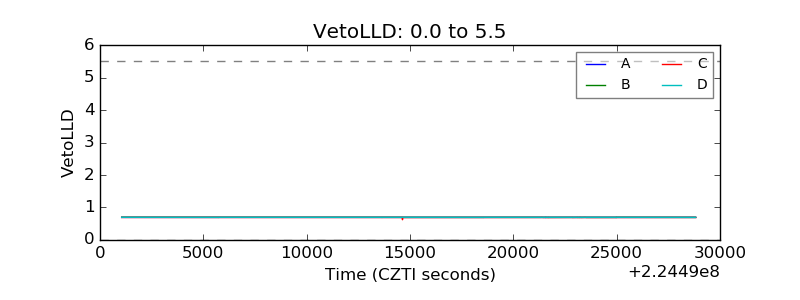 |
| Alpha Counter | 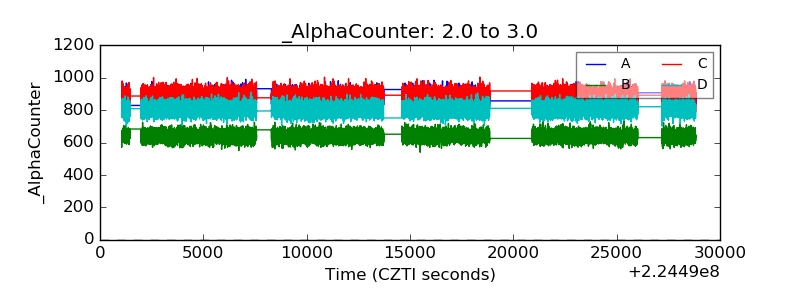 |
| _CPM_Rate | 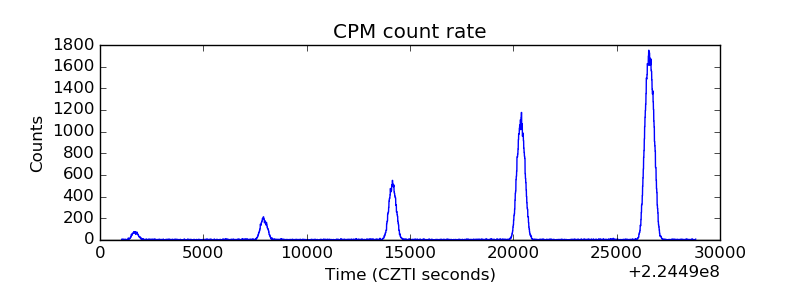 |
| CZT Counter |  |
| +2.5 Volts monitor |  |
| +5 Volts monitor |  |
| _ROLL_ROT | 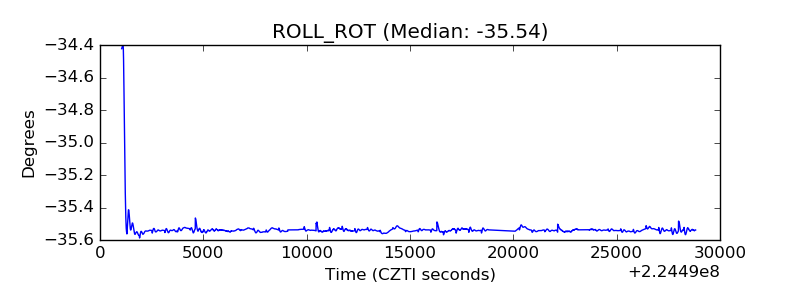 |
| _Roll_DEC | 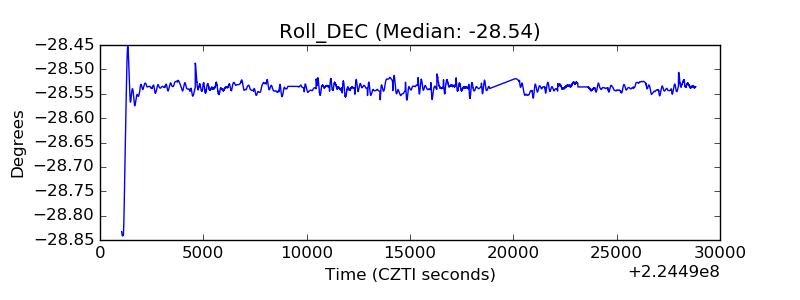 |
| _Roll_RA | 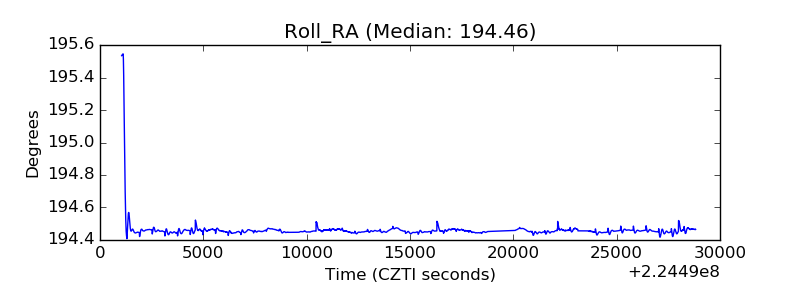 |
| Veto Counter | 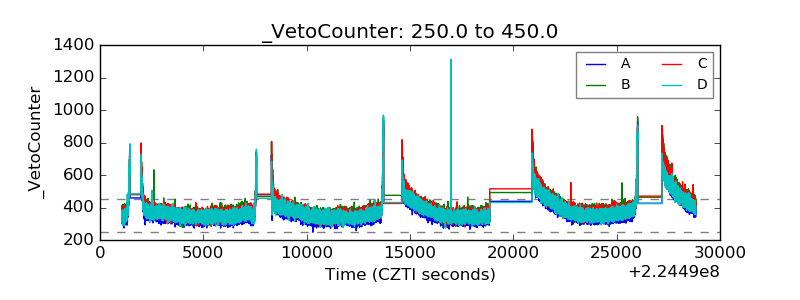 |