| Param | Original file | Final file |
|---|---|---|
| Filename | modeM0/AS1A02_108T01_9000001024_07438cztM0_level2.evt | modeM0/AS1A02_108T01_9000001024_07438cztM0_level2_quad_clean.evt |
| Size (bytes) | 493,116,480 | 71,573,760 |
| Size | 470.3 MB | 68.3 MB |
| Events in quadrant A | 3,223,230 | 435,028 |
| Events in quadrant B | 3,307,812 | 441,989 |
| Events in quadrant C | 4,263,739 | 430,286 |
| Events in quadrant D | 3,699,968 | 408,234 |
| Mode SS | |||
|---|---|---|---|
| Quadrant | BADHDUFLAG | Total packets | Discarded packets |
| A | 0 | 132 | 0 |
| B | 0 | 132 | 0 |
| C | 0 | 132 | 0 |
| D | 0 | 132 | 0 |
| Mode M9 | |||
|---|---|---|---|
| Quadrant | BADHDUFLAG | Total packets | Discarded packets |
| A | 0 | 19 | 0 |
| B | 0 | 19 | 0 |
| C | 0 | 19 | 0 |
| D | 0 | 20 | 0 |
| Mode M0 | |||
|---|---|---|---|
| Quadrant | BADHDUFLAG | Total packets | Discarded packets |
| A | 0 | 13820 | 3 |
| B | 0 | 14025 | 2 |
| C | 0 | 17732 | 2 |
| D | 0 | 15165 | 2 |
| Quadrant | Total seconds | Saturated seconds | Saturation percentage |
|---|---|---|---|
| A | 6472 | 75 | 1.158838% |
| B | 6472 | 74 | 1.143387% |
| C | 6472 | 56 | 0.865266% |
| D | 6472 | 160 | 2.472188% |
Noise dominated data is calculated using 1-second bins in cleaned event files. If a bin has >2000 counts, and if more than 50% of those come from <1% of pixels, then it is considered to be noise-dominated and hence unusable.
| Quadrant | # 1 sec bins | Bins with >0 counts | Bins with >2000 counts | High rate bins dominated by noise | Noise dominated (total time) | Noise dominated (detector-on time) | Marked lightcurve |
|---|---|---|---|---|---|---|---|
| A | 7727 | 6472 | 0 | 0 | 0.00% | 0.00% | 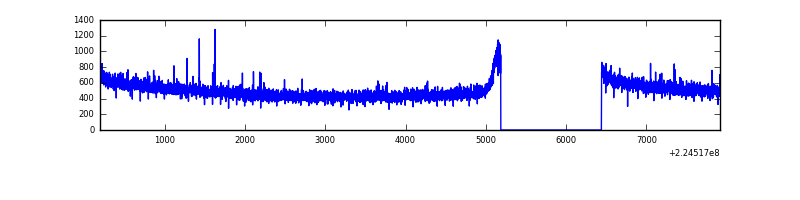 |
| B | 7727 | 6472 | 2 | 2 | 0.03% | 0.03% |  |
| C | 7727 | 6473 | 0 | 0 | 0.00% | 0.00% | 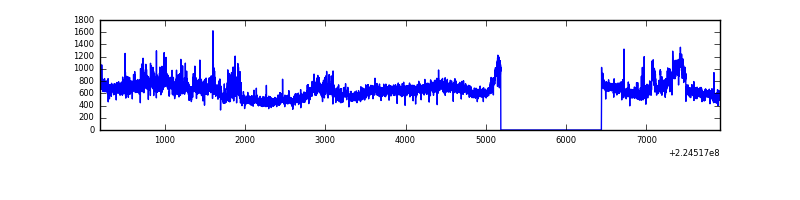 |
| D | 7727 | 6473 | 96 | 96 | 1.24% | 1.48% | 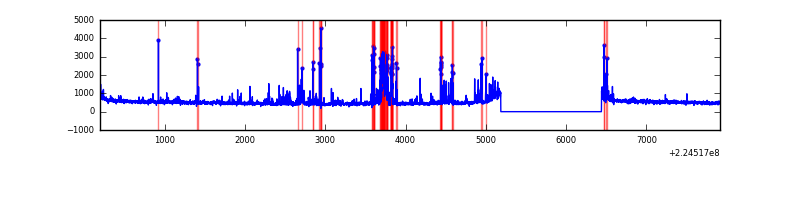 |
Top three noisy pixels from each quadrant. If the there are fewer than three noisy pixels in the level2.evt file, extra rows are filled as -1
| Pixel properties | Quadrant properties | ||||||
|---|---|---|---|---|---|---|---|
| Quadrant | DetID | PixID | Counts | Sigma | Mean | Median | Sigma |
| A | 15 | 239 | 15779 | 89.49 | 829 | 812 | 167.3 |
| A | 3 | 1 | 8561 | 46.33 | 829 | 812 | 167.3 |
| A | 0 | 226 | 8039 | 43.21 | 829 | 812 | 167.3 |
| B | 0 | 214 | 53470 | 336.44 | 834 | 815 | 156.5 |
| B | 4 | 81 | 17464 | 106.38 | 834 | 815 | 156.5 |
| B | 12 | 111 | 15106 | 91.31 | 834 | 815 | 156.5 |
| C | 9 | 68 | 1140186 | 6217.21 | 798 | 806 | 183.3 |
| C | 13 | 61 | 6184 | 29.35 | 798 | 806 | 183.3 |
| C | 7 | 87 | 5352 | 24.81 | 798 | 806 | 183.3 |
| D | 14 | 34 | 383441 | 2003.0 | 795 | 771 | 191.0 |
| D | 13 | 105 | 155618 | 810.51 | 795 | 771 | 191.0 |
| D | 2 | 14 | 96799 | 502.64 | 795 | 771 | 191.0 |
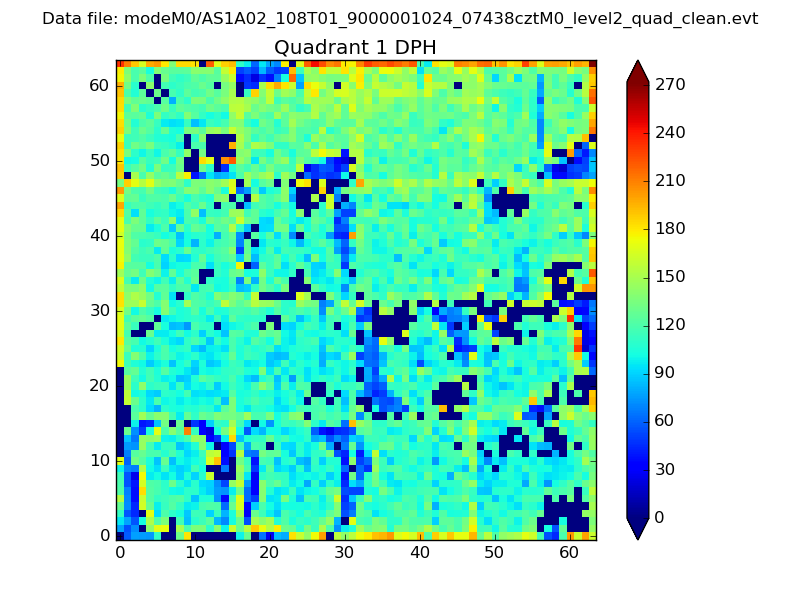
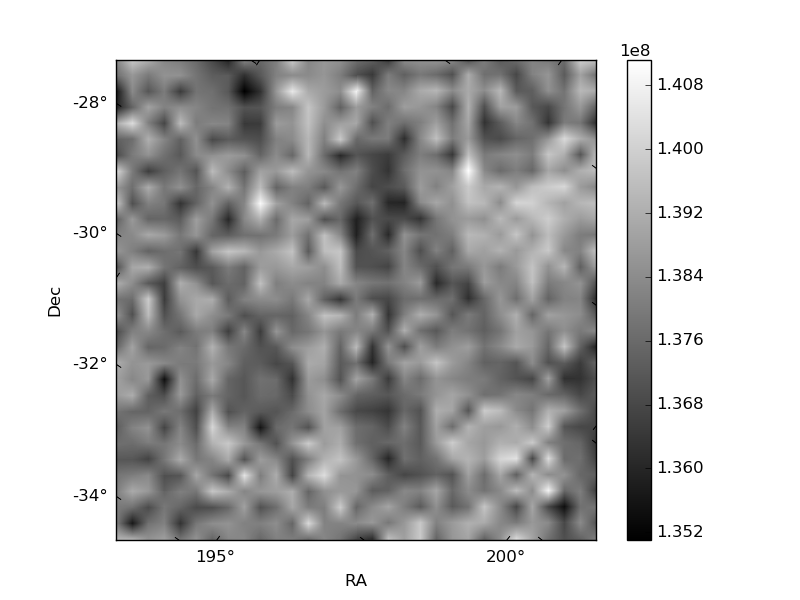
Histogram calculated using DETX and DETY for each event in the final _common_clean file
| Quadrant A | 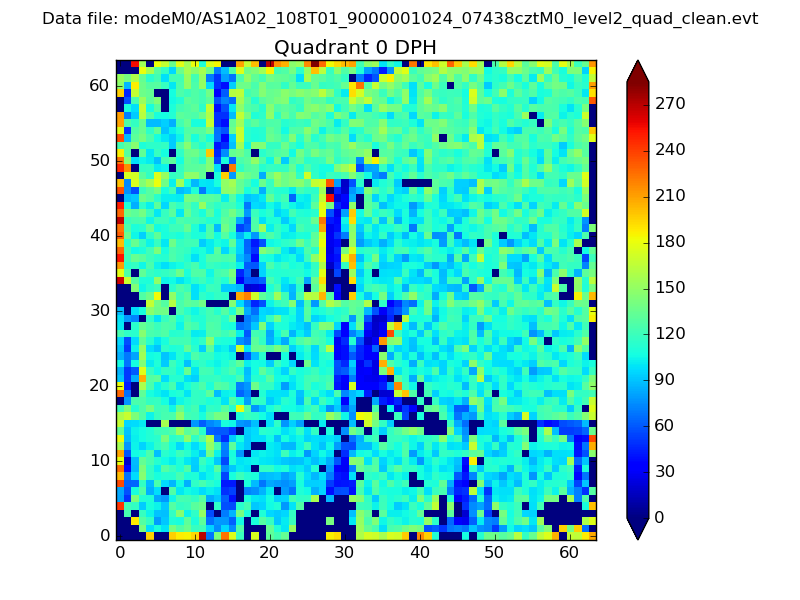 |
 |
Quadrant B |
|---|---|---|---|
| Quadrant D | 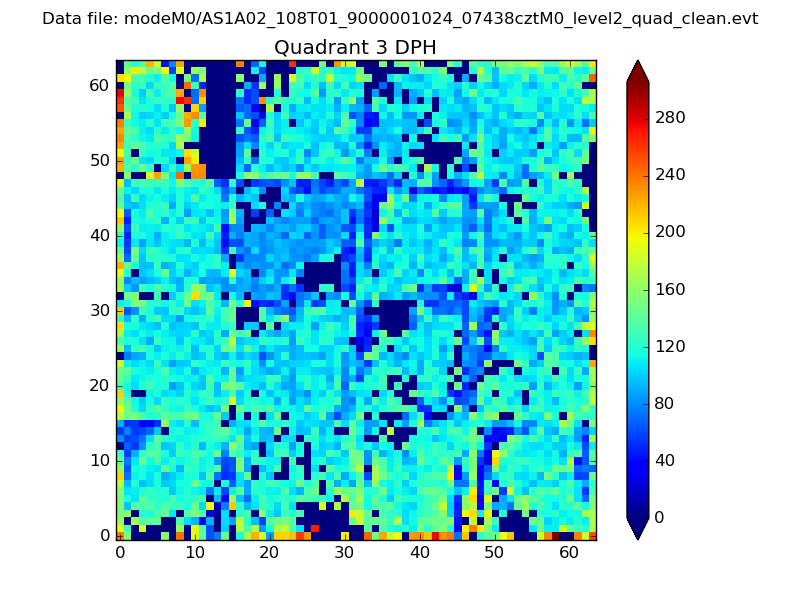 |
 |
Quadrant C |
| Plot type | Count rate plots | Images |
|---|---|---|
| Comparison with Poisson distribution Blue bars denote a histogram of data divided into 1 sec bins. Red curve is a Poisson curve with rate = median count rate of data. |
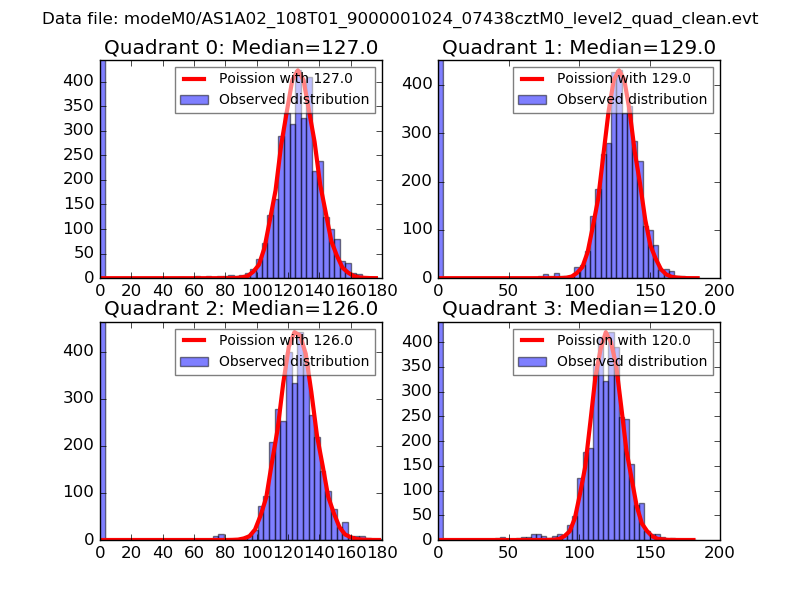 |
 |
| Quadrant-wise count rates Data is divided into 100 sec bins |
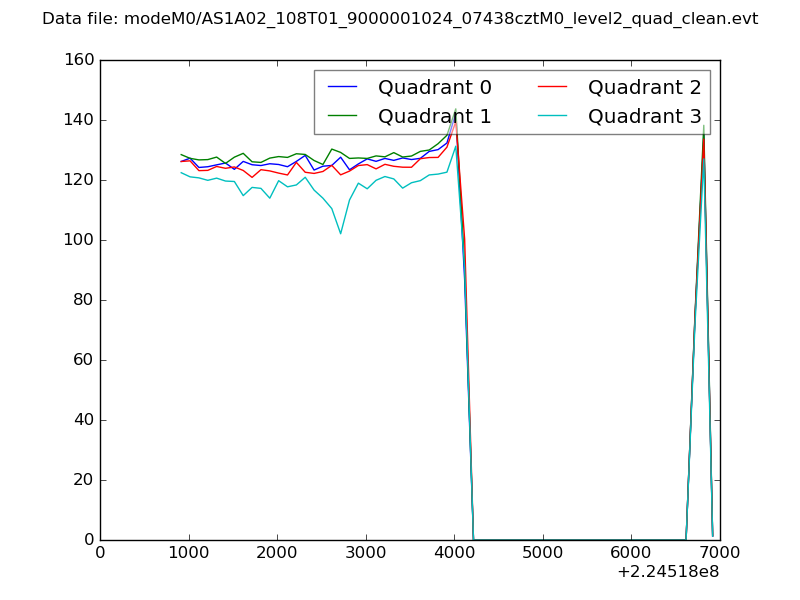 |
|
| Module-wise count rates for Quadrant A Data is divided into 100 sec bins |
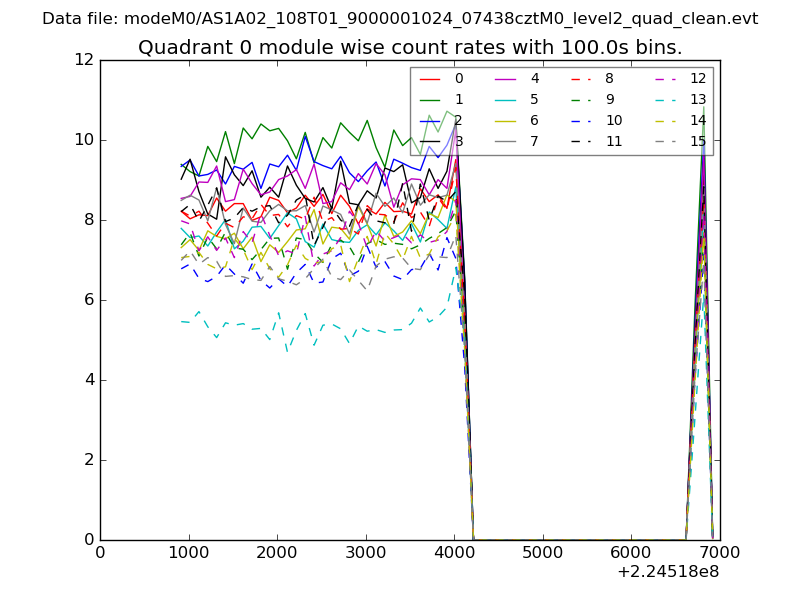 |
 |
| Module-wise count rates for Quadrant B Data is divided into 100 sec bins |
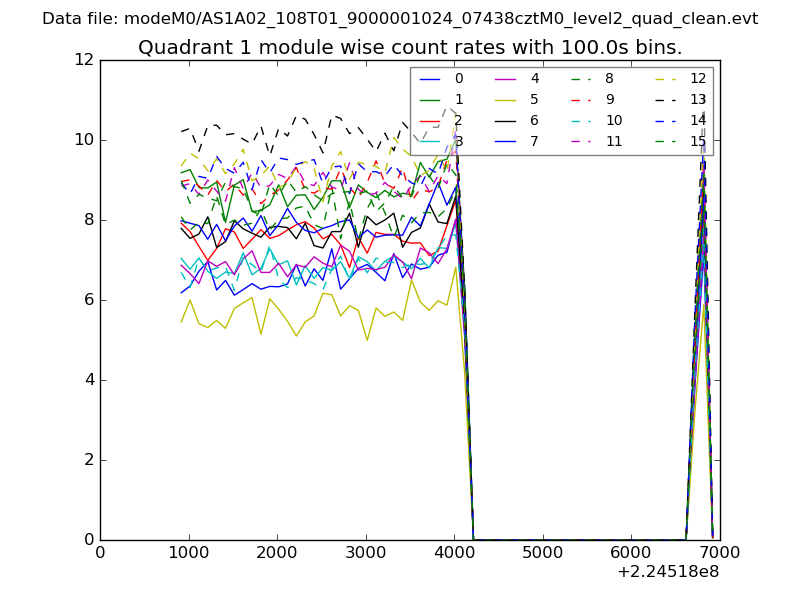 |
 |
| Module-wise count rates for Quadrant C Data is divided into 100 sec bins |
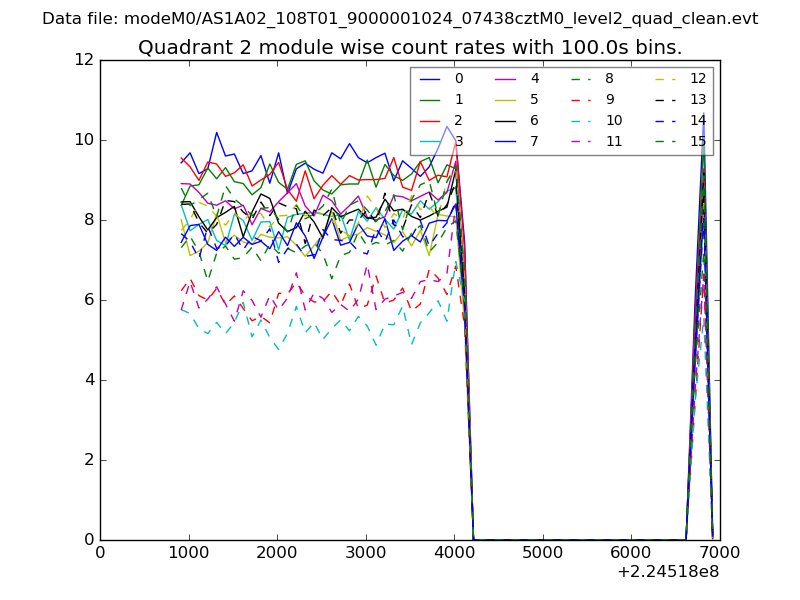 |
 |
| Module-wise count rates for Quadrant D Data is divided into 100 sec bins |
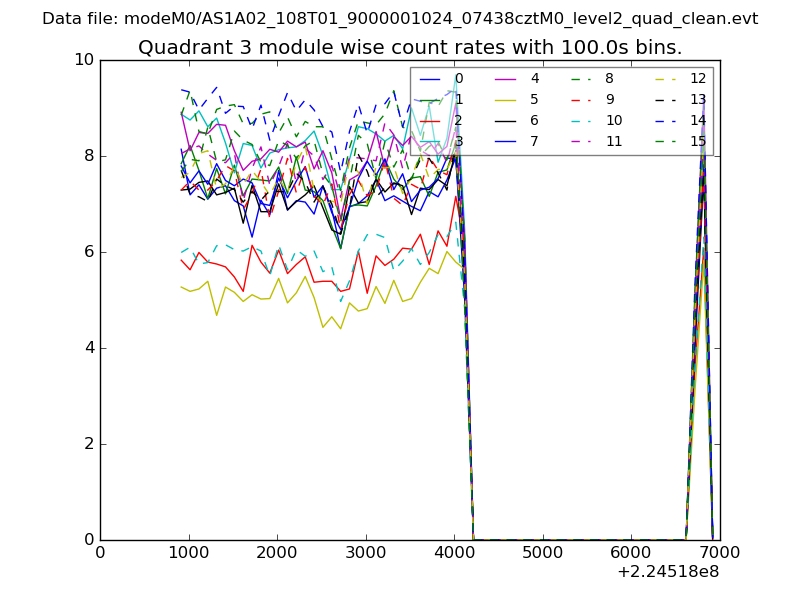 |
 |
| Parameter | Plot |
|---|---|
| CZT HV Monitor | 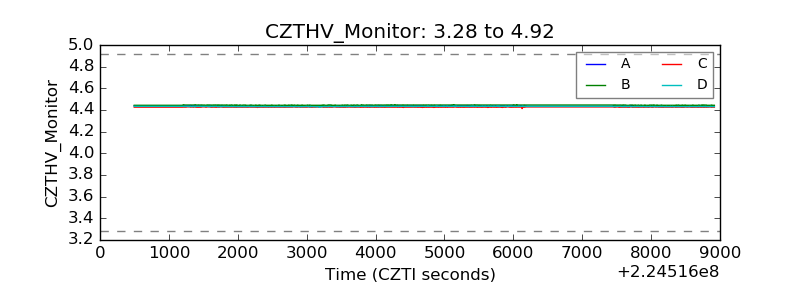 |
| D_VDD | 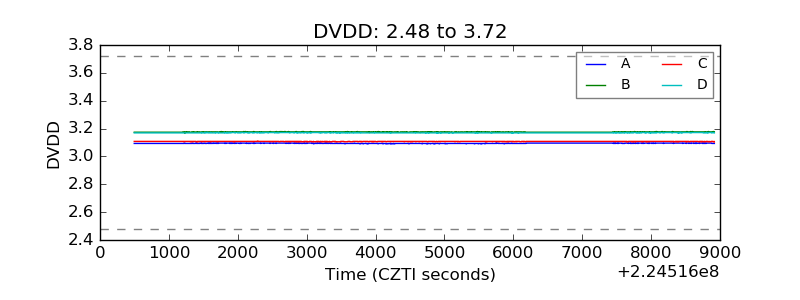 |
| Temperature 1 | 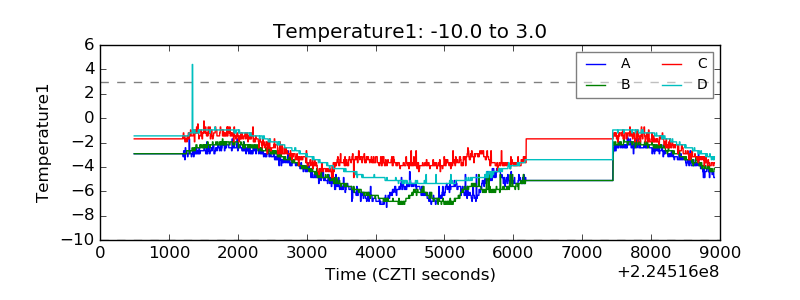 |
| Veto HV Monitor | 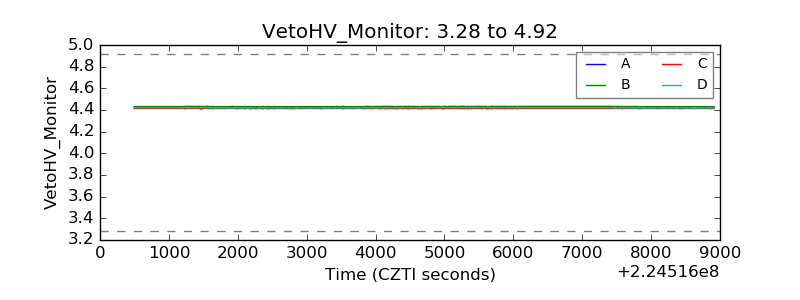 |
| Veto LLD | 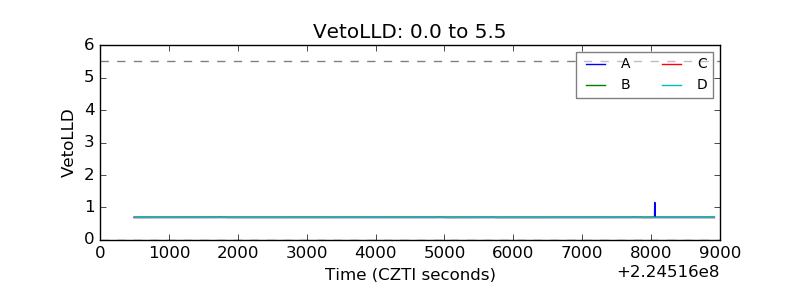 |
| Alpha Counter | 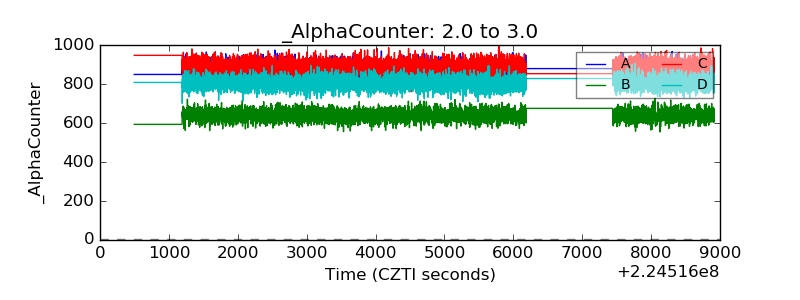 |
| _CPM_Rate | 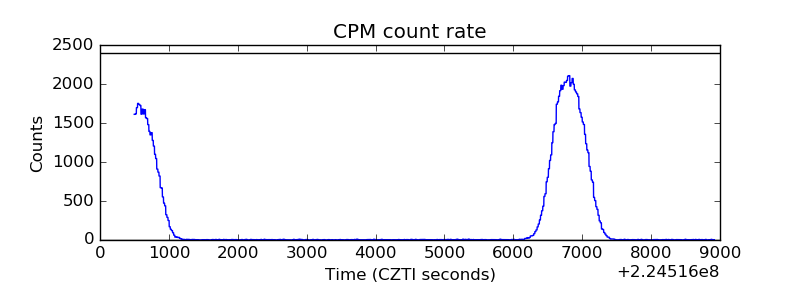 |
| CZT Counter |  |
| +2.5 Volts monitor |  |
| +5 Volts monitor |  |
| _ROLL_ROT | 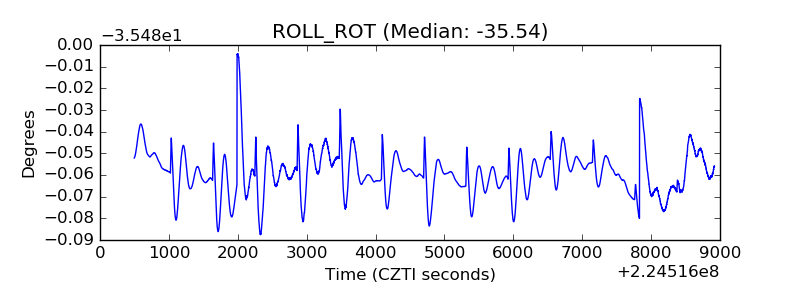 |
| _Roll_DEC | 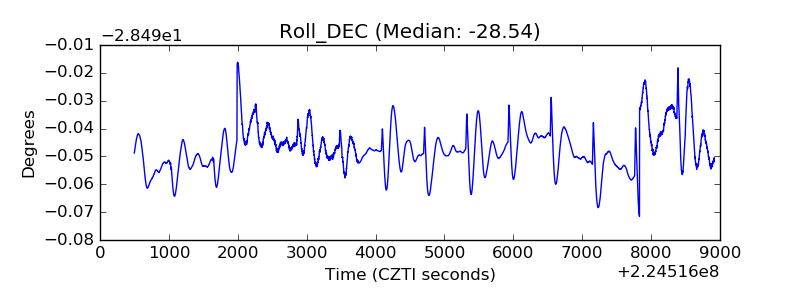 |
| _Roll_RA | 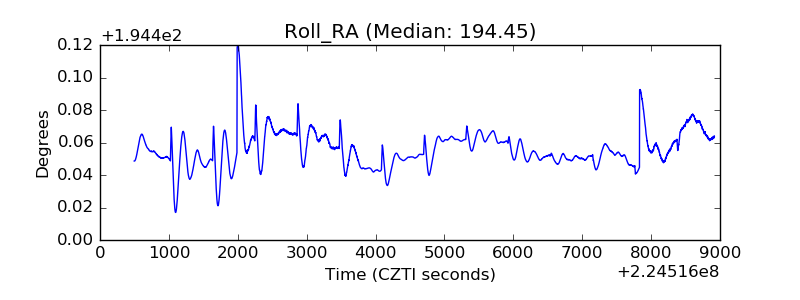 |
| Veto Counter | 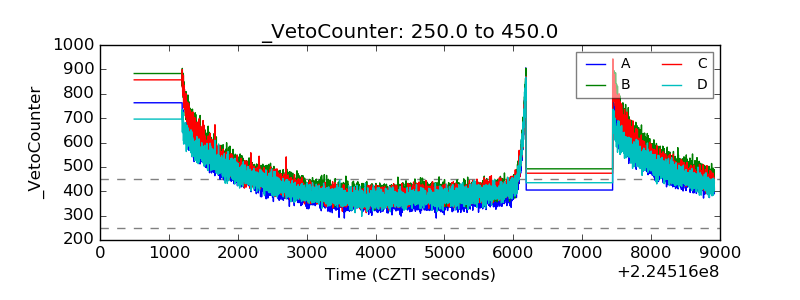 |