| Param | Original file | Final file |
|---|---|---|
| Filename | modeM0/AS1A02_108T01_9000001024_07440cztM0_level2.evt | modeM0/AS1A02_108T01_9000001024_07440cztM0_level2_quad_clean.evt |
| Size (bytes) | 430,280,640 | 88,767,360 |
| Size | 410.3 MB | 84.7 MB |
| Events in quadrant A | 3,071,040 | 573,186 |
| Events in quadrant B | 3,125,672 | 584,253 |
| Events in quadrant C | 3,210,416 | 563,033 |
| Events in quadrant D | 3,203,062 | 535,710 |
| Mode SS | |||
|---|---|---|---|
| Quadrant | BADHDUFLAG | Total packets | Discarded packets |
| A | 0 | 128 | 0 |
| B | 0 | 128 | 0 |
| C | 0 | 128 | 0 |
| D | 0 | 128 | 0 |
| Mode M9 | |||
|---|---|---|---|
| Quadrant | BADHDUFLAG | Total packets | Discarded packets |
| A | 0 | 26 | 0 |
| B | 0 | 26 | 0 |
| C | 0 | 26 | 0 |
| D | 0 | 26 | 0 |
| Mode M0 | |||
|---|---|---|---|
| Quadrant | BADHDUFLAG | Total packets | Discarded packets |
| A | 0 | 13090 | 3 |
| B | 0 | 13219 | 2 |
| C | 0 | 13140 | 2 |
| D | 0 | 13657 | 2 |
| Quadrant | Total seconds | Saturated seconds | Saturation percentage |
|---|---|---|---|
| A | 6188 | 149 | 2.407886% |
| B | 6188 | 156 | 2.521008% |
| C | 6188 | 91 | 1.470588% |
| D | 6188 | 143 | 2.310924% |
Noise dominated data is calculated using 1-second bins in cleaned event files. If a bin has >2000 counts, and if more than 50% of those come from <1% of pixels, then it is considered to be noise-dominated and hence unusable.
| Quadrant | # 1 sec bins | Bins with >0 counts | Bins with >2000 counts | High rate bins dominated by noise | Noise dominated (total time) | Noise dominated (detector-on time) | Marked lightcurve |
|---|---|---|---|---|---|---|---|
| A | 8803 | 6190 | 0 | 0 | 0.00% | 0.00% | 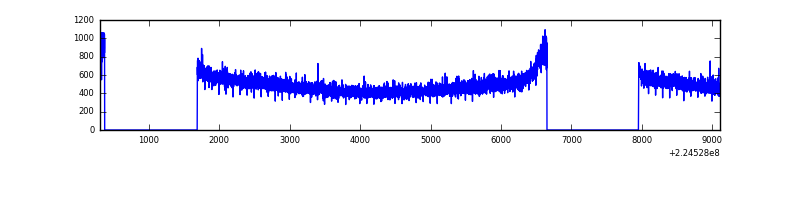 |
| B | 8803 | 6189 | 2 | 2 | 0.02% | 0.03% | 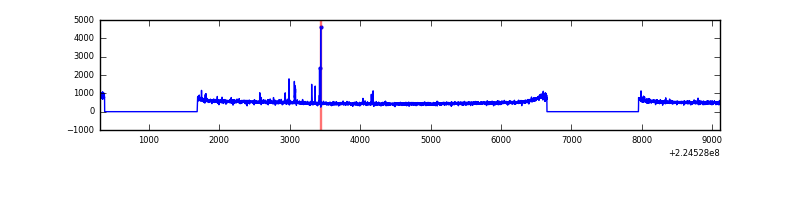 |
| C | 8803 | 6190 | 0 | 0 | 0.00% | 0.00% | 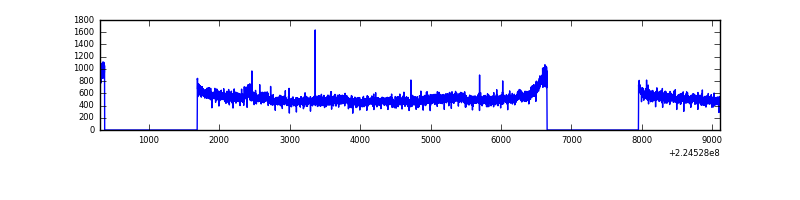 |
| D | 8803 | 6190 | 30 | 30 | 0.34% | 0.48% | 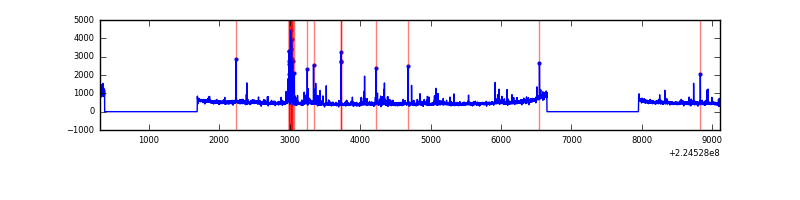 |
Top three noisy pixels from each quadrant. If the there are fewer than three noisy pixels in the level2.evt file, extra rows are filled as -1
| Pixel properties | Quadrant properties | ||||||
|---|---|---|---|---|---|---|---|
| Quadrant | DetID | PixID | Counts | Sigma | Mean | Median | Sigma |
| A | 15 | 239 | 33295 | 205.29 | 785 | 769 | 158.4 |
| A | 13 | 14 | 12409 | 73.47 | 785 | 769 | 158.4 |
| A | 0 | 226 | 7596 | 43.09 | 785 | 769 | 158.4 |
| B | 4 | 81 | 26364 | 170.76 | 792 | 775 | 149.9 |
| B | 12 | 111 | 14713 | 93.01 | 792 | 775 | 149.9 |
| B | 0 | 214 | 14374 | 90.75 | 792 | 775 | 149.9 |
| C | 9 | 68 | 226387 | 1281.77 | 759 | 763 | 176.0 |
| C | 8 | 128 | 8364 | 43.18 | 759 | 763 | 176.0 |
| C | 13 | 61 | 5937 | 29.39 | 759 | 763 | 176.0 |
| D | 1 | 52 | 86720 | 466.01 | 751 | 729 | 184.5 |
| D | 12 | 233 | 69648 | 373.49 | 751 | 729 | 184.5 |
| D | 2 | 14 | 65628 | 351.7 | 751 | 729 | 184.5 |
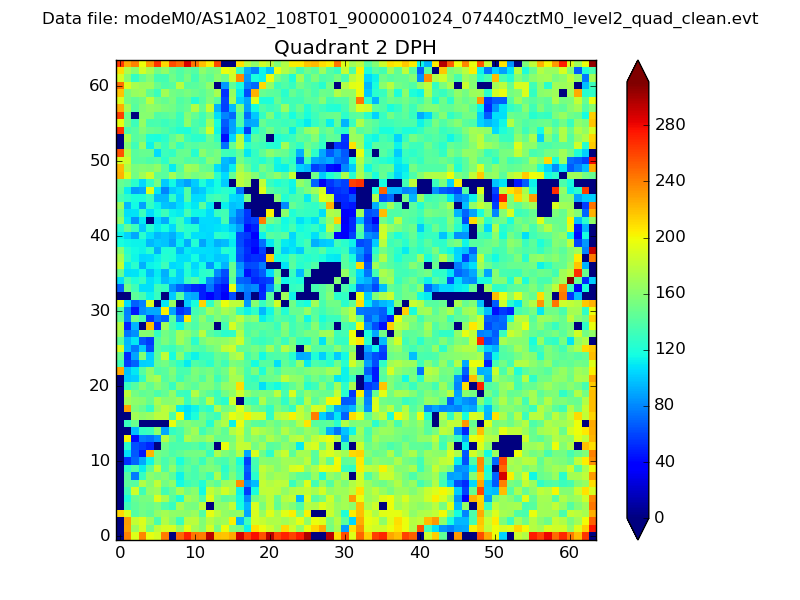
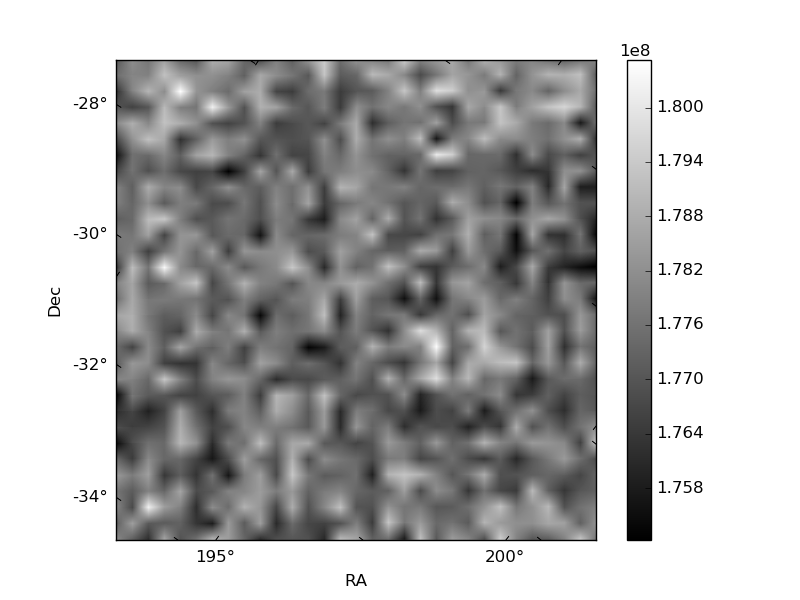
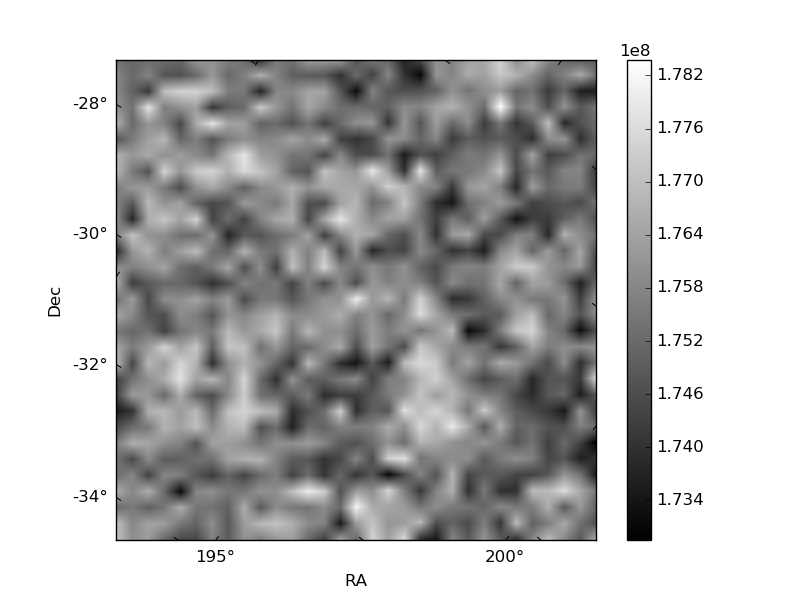
Histogram calculated using DETX and DETY for each event in the final _common_clean file
| Quadrant A |  |
 |
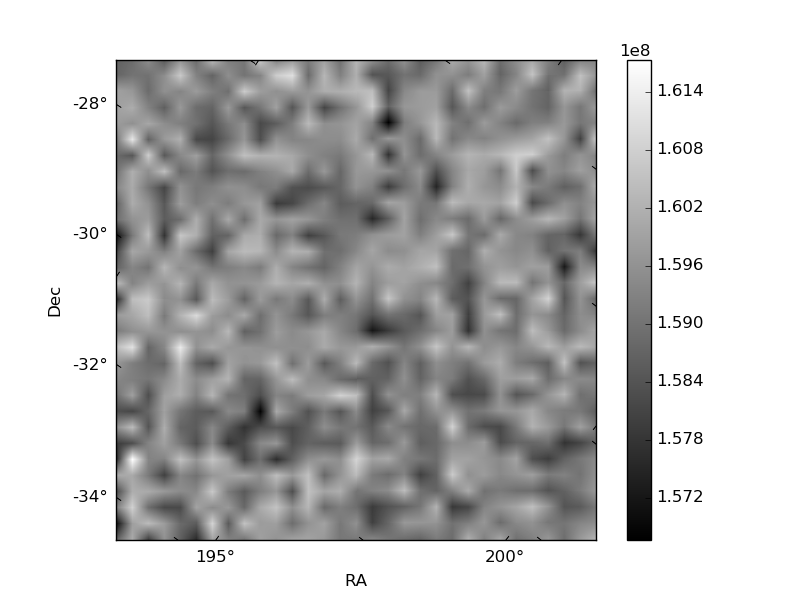
Quadrant B |
|---|---|---|---|
| Quadrant D | 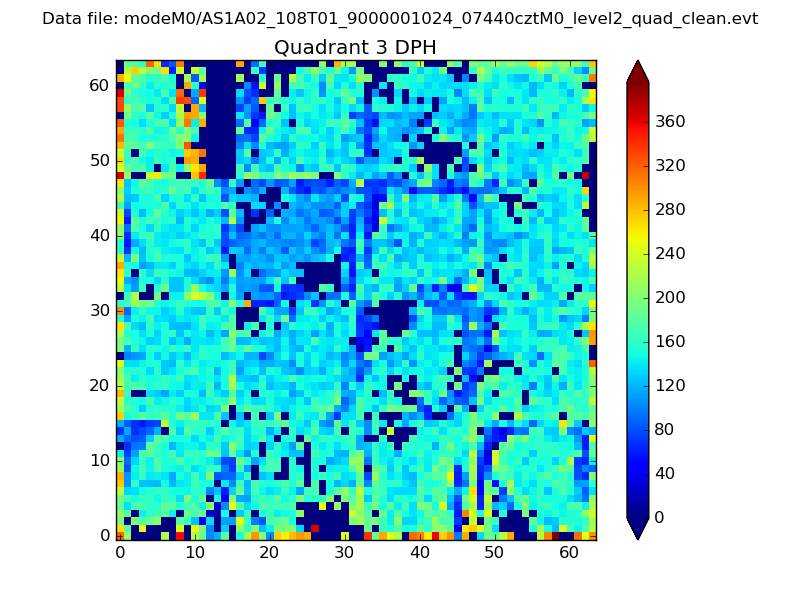 |
 |
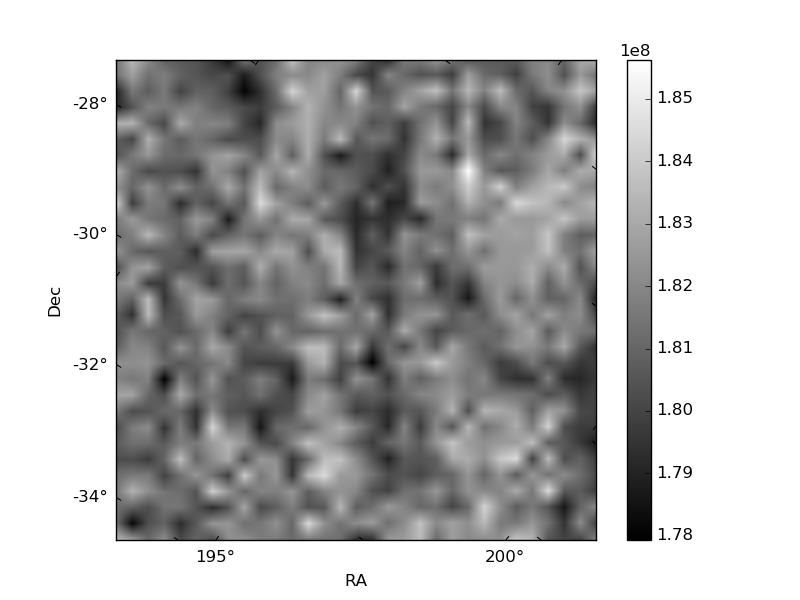
Quadrant C |
| Plot type | Count rate plots | Images |
|---|---|---|
| Comparison with Poisson distribution Blue bars denote a histogram of data divided into 1 sec bins. Red curve is a Poisson curve with rate = median count rate of data. |
 |
 |
| Quadrant-wise count rates Data is divided into 100 sec bins |
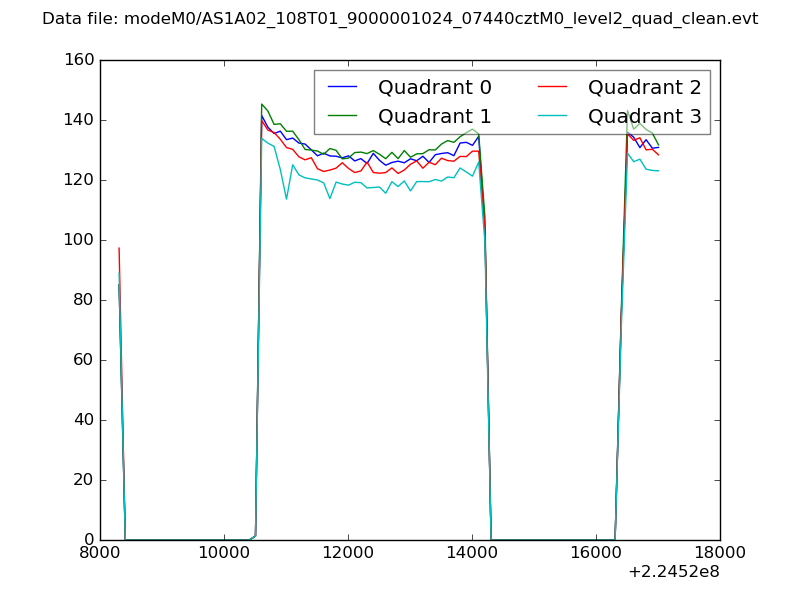 |
|
| Module-wise count rates for Quadrant A Data is divided into 100 sec bins |
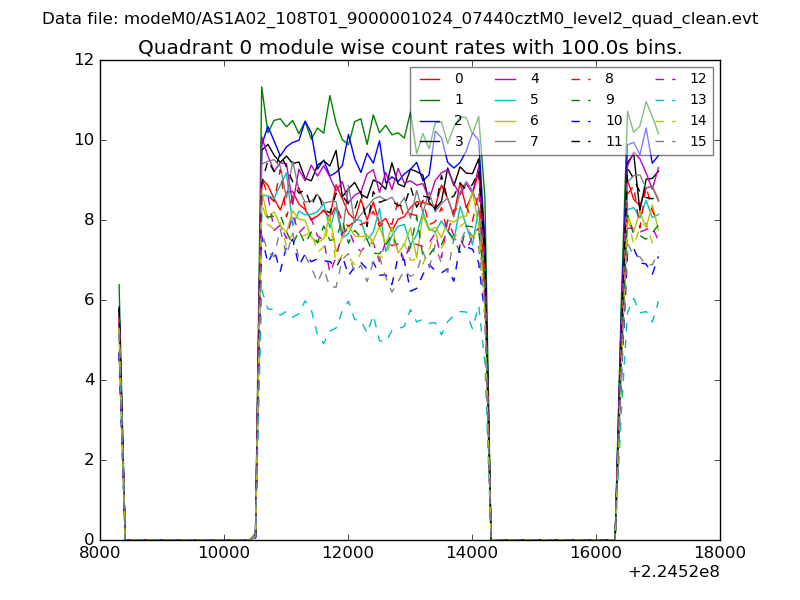 |
 |
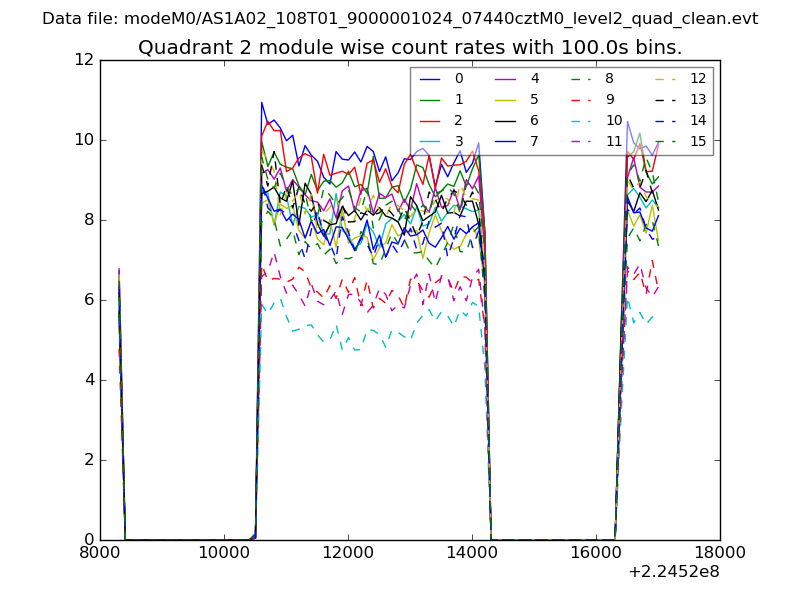
| Module-wise count rates for Quadrant B Data is divided into 100 sec bins |
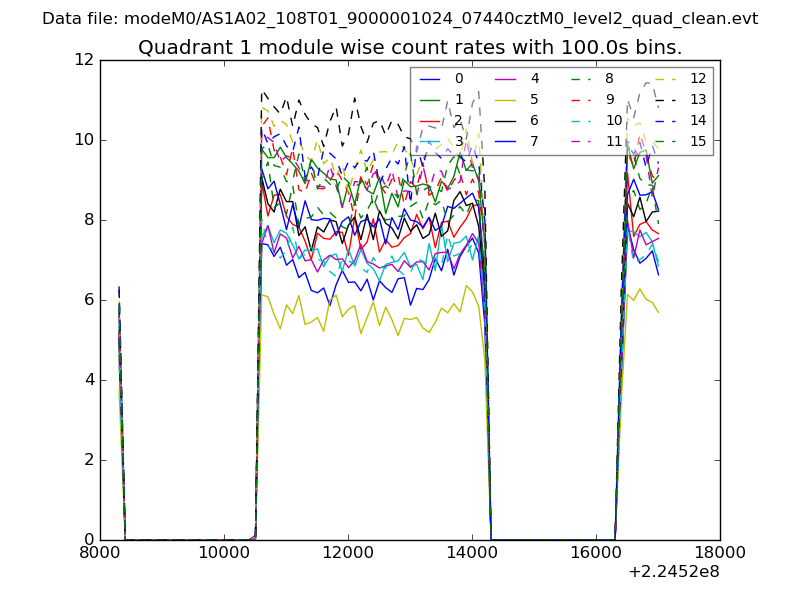 |
 |
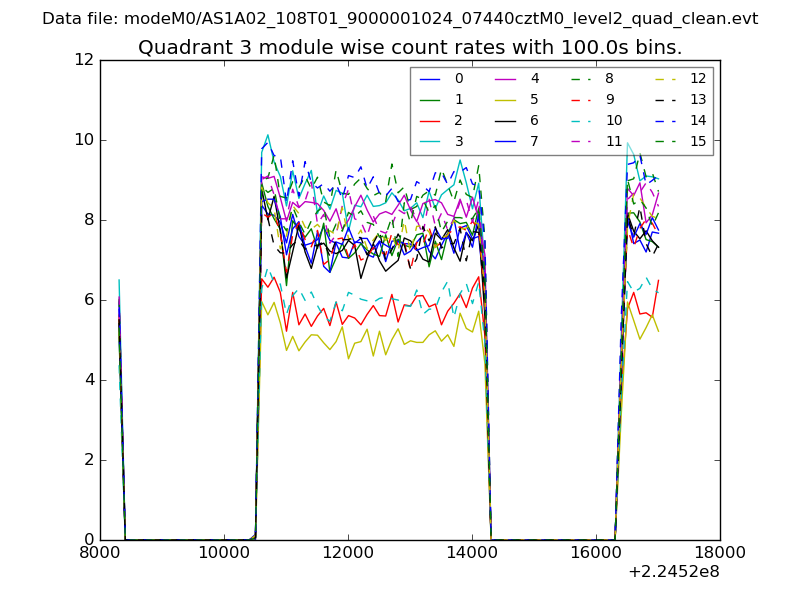
| Module-wise count rates for Quadrant C Data is divided into 100 sec bins |
 |
 |
| Module-wise count rates for Quadrant D Data is divided into 100 sec bins |
 |
 |
| Parameter | Plot |
|---|---|
| CZT HV Monitor | 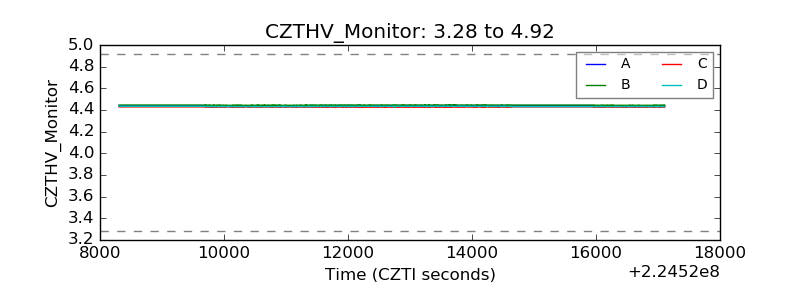 |
| D_VDD | 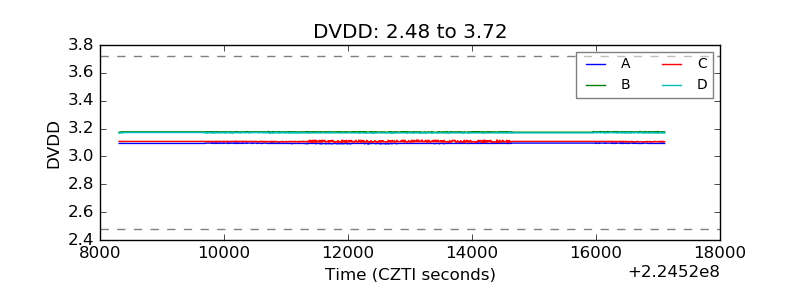 |
| Temperature 1 | 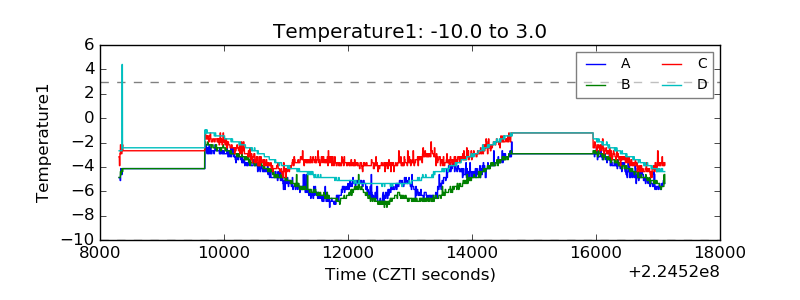 |
| Veto HV Monitor | 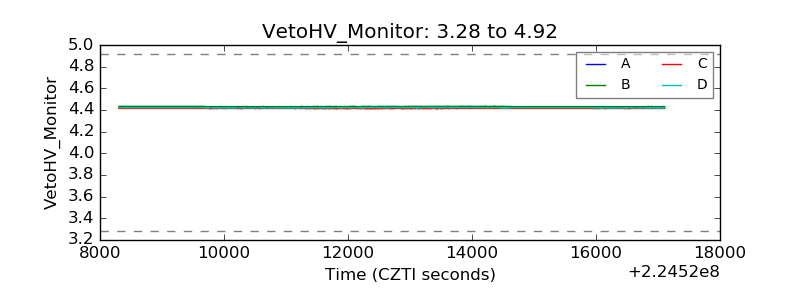 |
| Veto LLD |  |
| Alpha Counter | 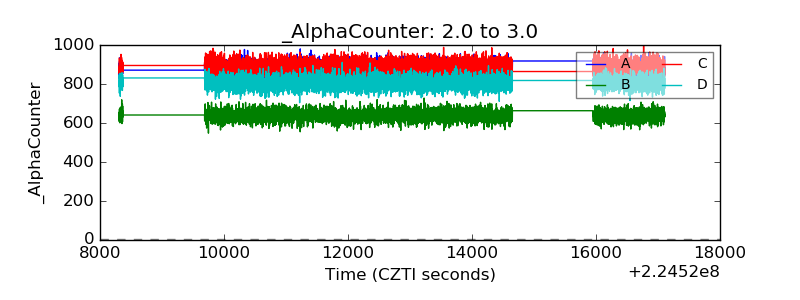 |
| _CPM_Rate | 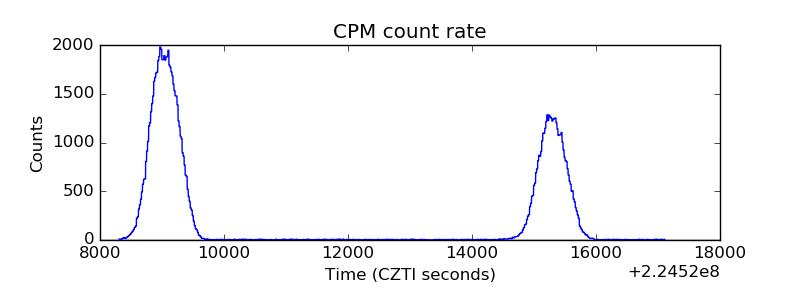 |
| CZT Counter | 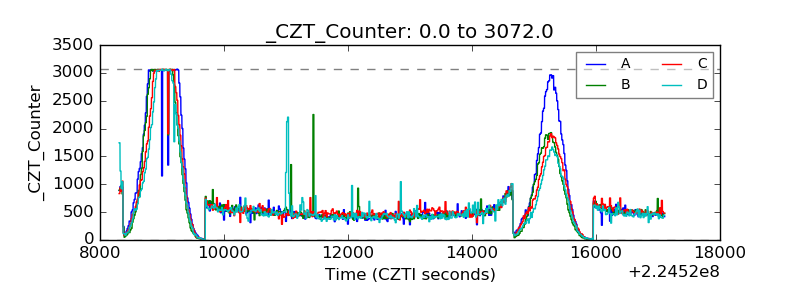 |
| +2.5 Volts monitor |  |
| +5 Volts monitor |  |
| _ROLL_ROT | 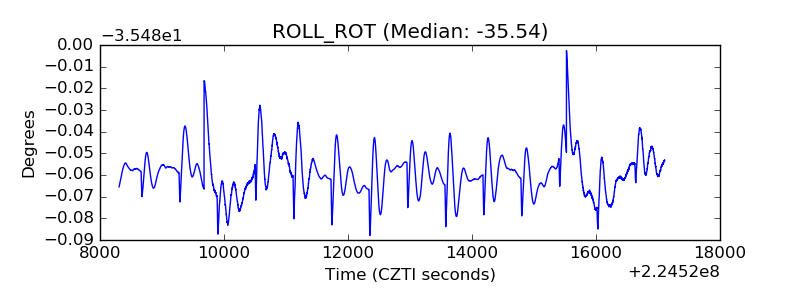 |
| _Roll_DEC | 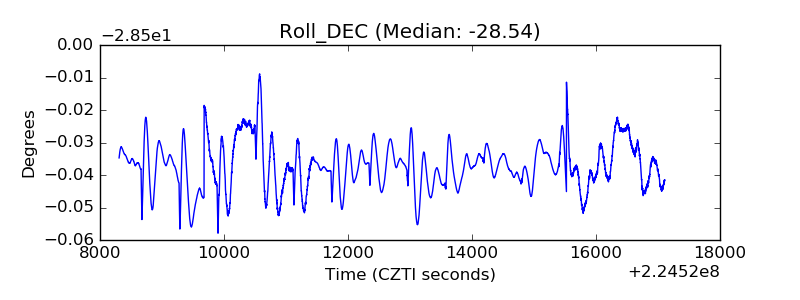 |
| _Roll_RA |  |
| Veto Counter | 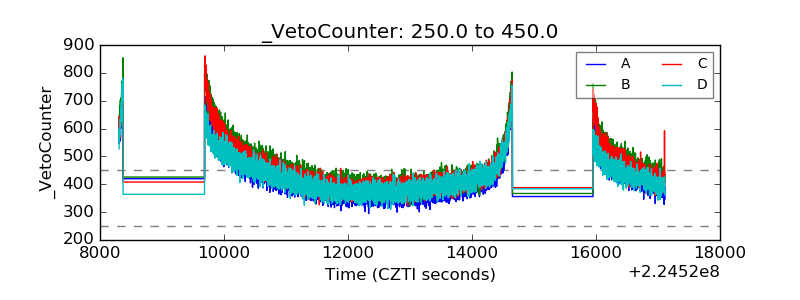 |