| Param | Original file | Final file |
|---|---|---|
| Filename | modeM0/AS1A02_108T01_9000001024_07443cztM0_level2.evt | modeM0/AS1A02_108T01_9000001024_07443cztM0_level2_quad_clean.evt |
| Size (bytes) | 504,774,720 | 100,483,200 |
| Size | 481.4 MB | 95.8 MB |
| Events in quadrant A | 3,394,398 | 635,016 |
| Events in quadrant B | 3,496,960 | 649,274 |
| Events in quadrant C | 4,136,237 | 628,814 |
| Events in quadrant D | 3,745,256 | 603,201 |
| Mode SS | |||
|---|---|---|---|
| Quadrant | BADHDUFLAG | Total packets | Discarded packets |
| A | 0 | 154 | 0 |
| B | 0 | 154 | 0 |
| C | 0 | 154 | 0 |
| D | 0 | 154 | 0 |
| Mode M9 | |||
|---|---|---|---|
| Quadrant | BADHDUFLAG | Total packets | Discarded packets |
| A | 0 | 9 | 0 |
| B | 0 | 9 | 0 |
| C | 0 | 9 | 0 |
| D | 0 | 10 | 0 |
| Mode M0 | |||
|---|---|---|---|
| Quadrant | BADHDUFLAG | Total packets | Discarded packets |
| A | 0 | 15483 | 4 |
| B | 0 | 15621 | 3 |
| C | 0 | 17280 | 3 |
| D | 0 | 16662 | 3 |
| Quadrant | Total seconds | Saturated seconds | Saturation percentage |
|---|---|---|---|
| A | 7569 | 23 | 0.303871% |
| B | 7569 | 57 | 0.753072% |
| C | 7569 | 19 | 0.251024% |
| D | 7569 | 72 | 0.951249% |
Noise dominated data is calculated using 1-second bins in cleaned event files. If a bin has >2000 counts, and if more than 50% of those come from <1% of pixels, then it is considered to be noise-dominated and hence unusable.
| Quadrant | # 1 sec bins | Bins with >0 counts | Bins with >2000 counts | High rate bins dominated by noise | Noise dominated (total time) | Noise dominated (detector-on time) | Marked lightcurve |
|---|---|---|---|---|---|---|---|
| A | 8079 | 7571 | 0 | 0 | 0.00% | 0.00% | 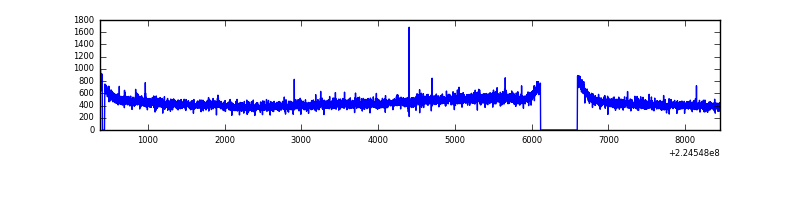 |
| B | 8079 | 7571 | 0 | 0 | 0.00% | 0.00% | 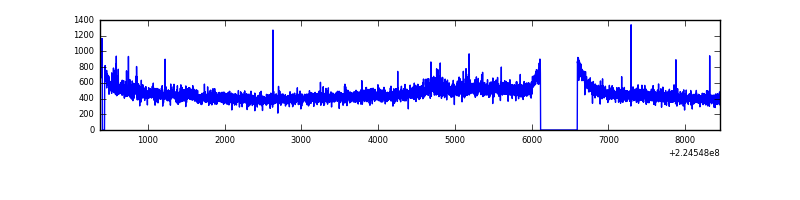 |
| C | 8079 | 7571 | 0 | 0 | 0.00% | 0.00% |  |
| D | 8079 | 7571 | 45 | 45 | 0.56% | 0.59% | 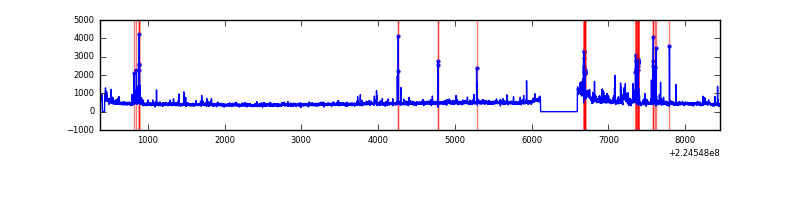 |
Top three noisy pixels from each quadrant. If the there are fewer than three noisy pixels in the level2.evt file, extra rows are filled as -1
| Pixel properties | Quadrant properties | ||||||
|---|---|---|---|---|---|---|---|
| Quadrant | DetID | PixID | Counts | Sigma | Mean | Median | Sigma |
| A | 15 | 239 | 14934 | 79.01 | 875 | 857 | 178.2 |
| A | 0 | 226 | 8251 | 41.5 | 875 | 857 | 178.2 |
| A | 12 | 194 | 7596 | 37.82 | 875 | 857 | 178.2 |
| B | 0 | 214 | 39368 | 226.23 | 887 | 865 | 170.2 |
| B | 12 | 111 | 17770 | 99.33 | 887 | 865 | 170.2 |
| B | 11 | 111 | 14232 | 78.54 | 887 | 865 | 170.2 |
| C | 9 | 68 | 777891 | 3903.69 | 855 | 860 | 199.1 |
| C | 13 | 61 | 6362 | 27.64 | 855 | 860 | 199.1 |
| C | 8 | 128 | 6131 | 26.48 | 855 | 860 | 199.1 |
| D | 2 | 14 | 187391 | 898.77 | 845 | 818 | 207.6 |
| D | 1 | 52 | 147256 | 705.43 | 845 | 818 | 207.6 |
| D | 13 | 105 | 108148 | 517.04 | 845 | 818 | 207.6 |
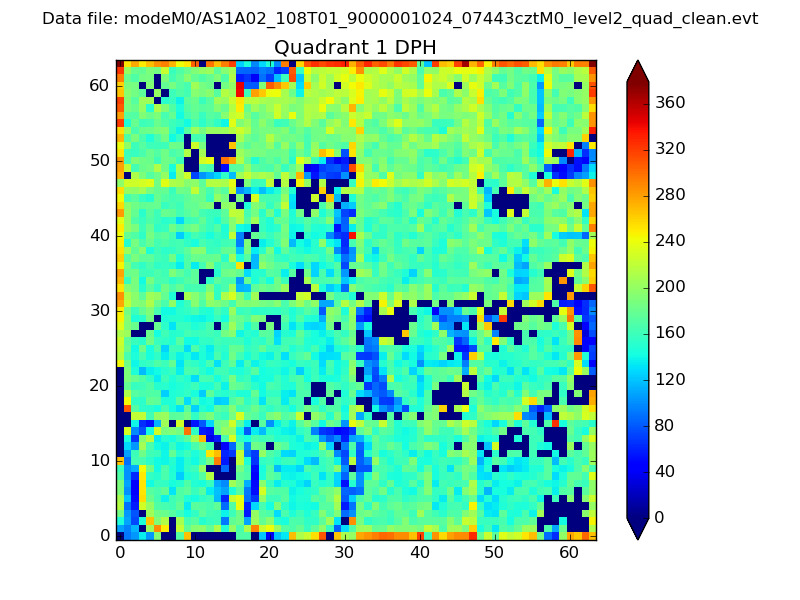
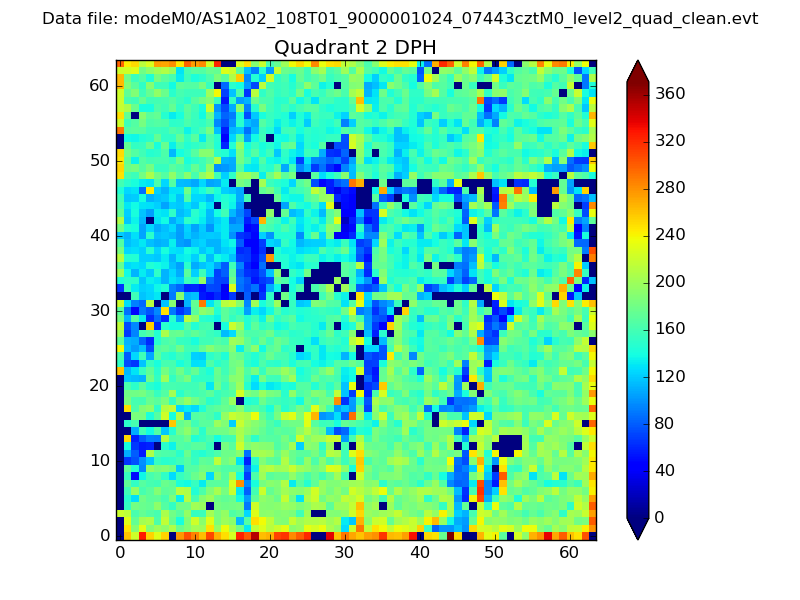
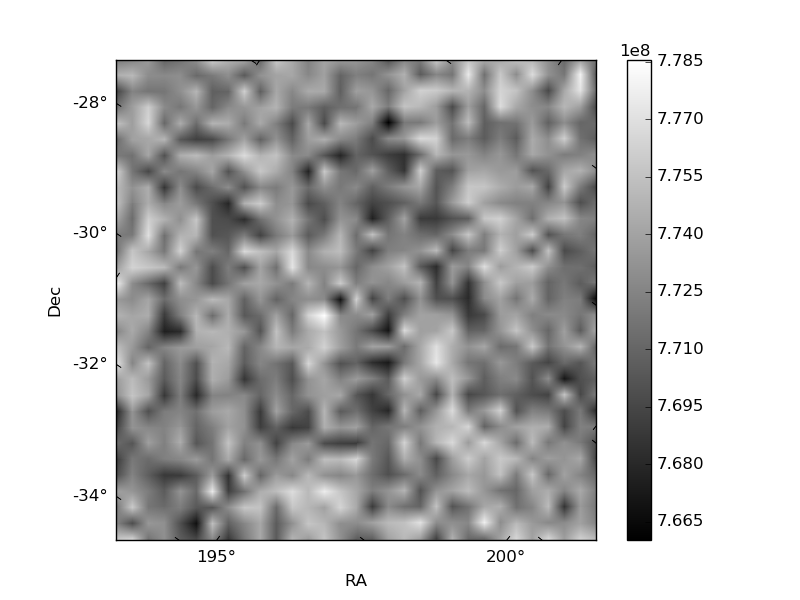
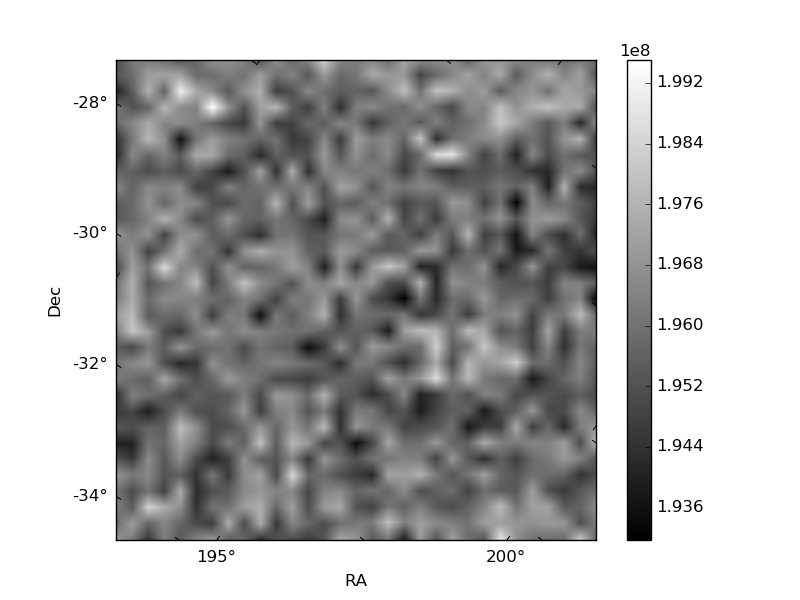
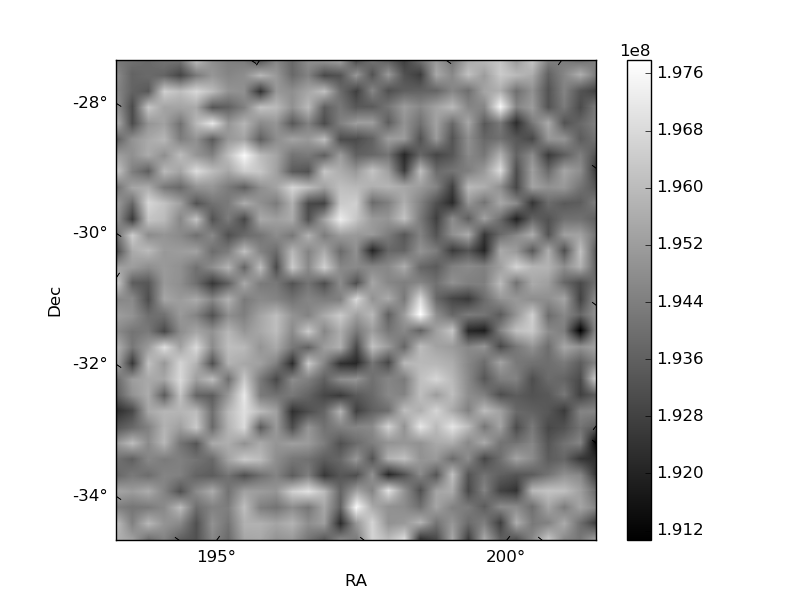
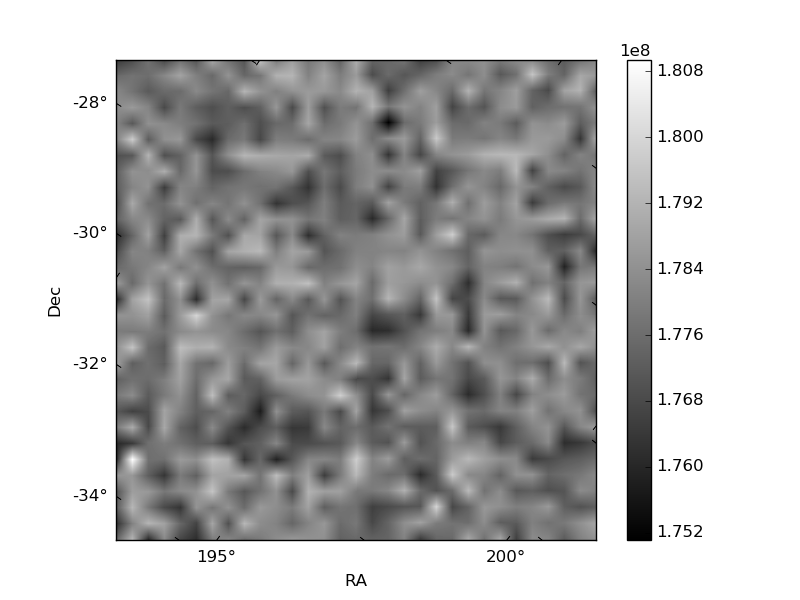
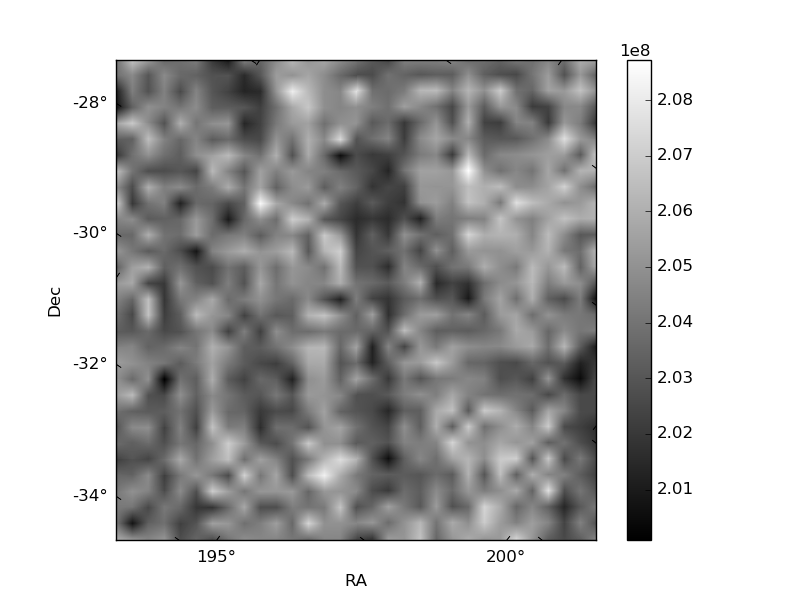
Histogram calculated using DETX and DETY for each event in the final _common_clean file
| Quadrant A | 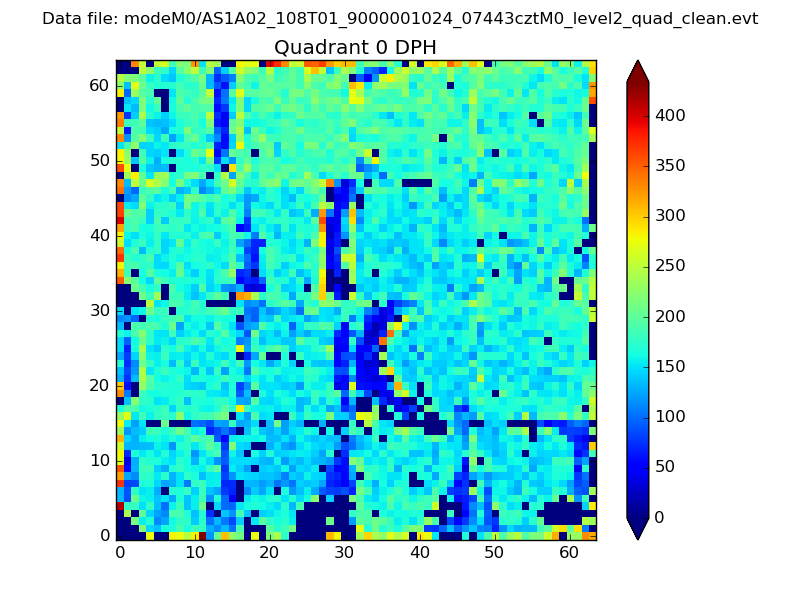 |
 |
Quadrant B |
|---|---|---|---|
| Quadrant D | 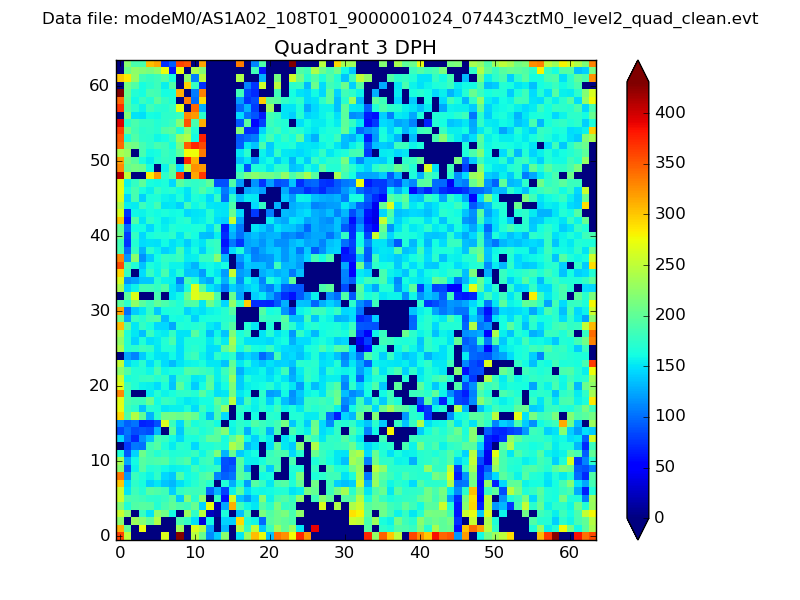 |
 |
Quadrant C |
| Plot type | Count rate plots | Images |
|---|---|---|
| Comparison with Poisson distribution Blue bars denote a histogram of data divided into 1 sec bins. Red curve is a Poisson curve with rate = median count rate of data. |
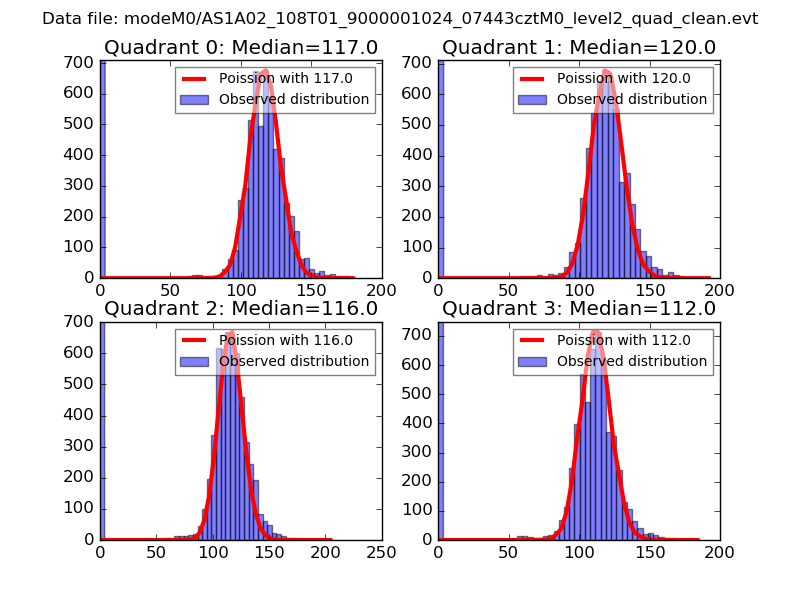 |
 |
| Quadrant-wise count rates Data is divided into 100 sec bins |
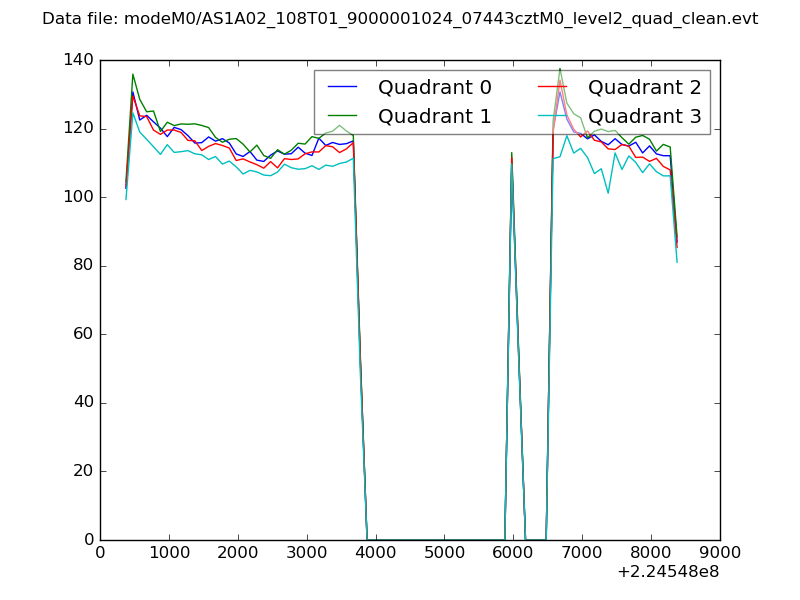 |
|
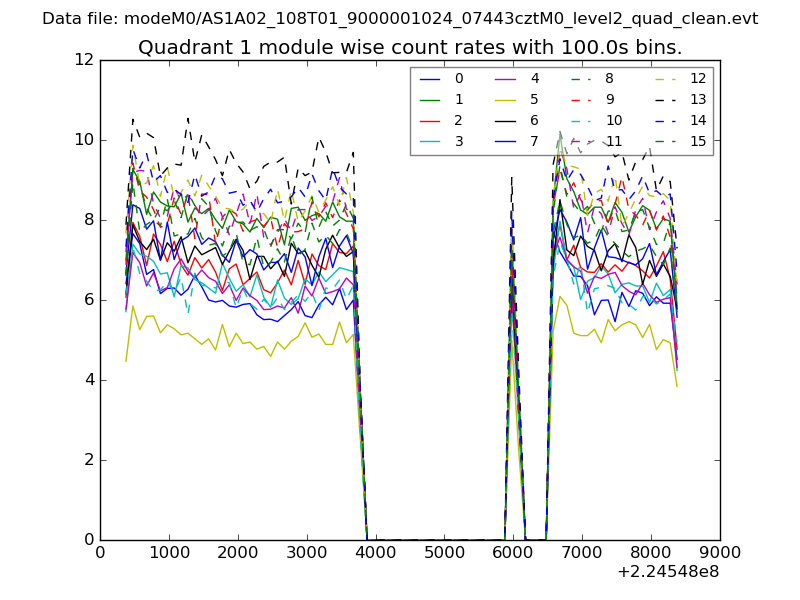
| Module-wise count rates for Quadrant A Data is divided into 100 sec bins |
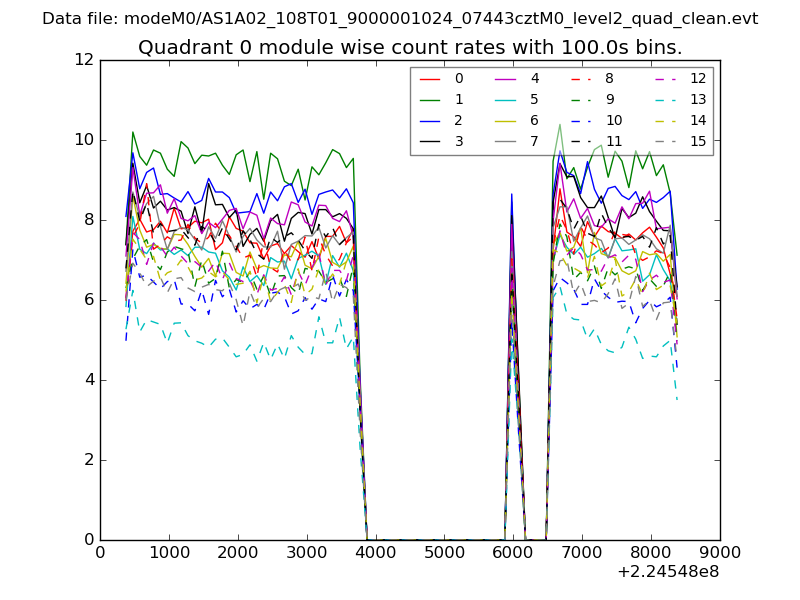 |
 |
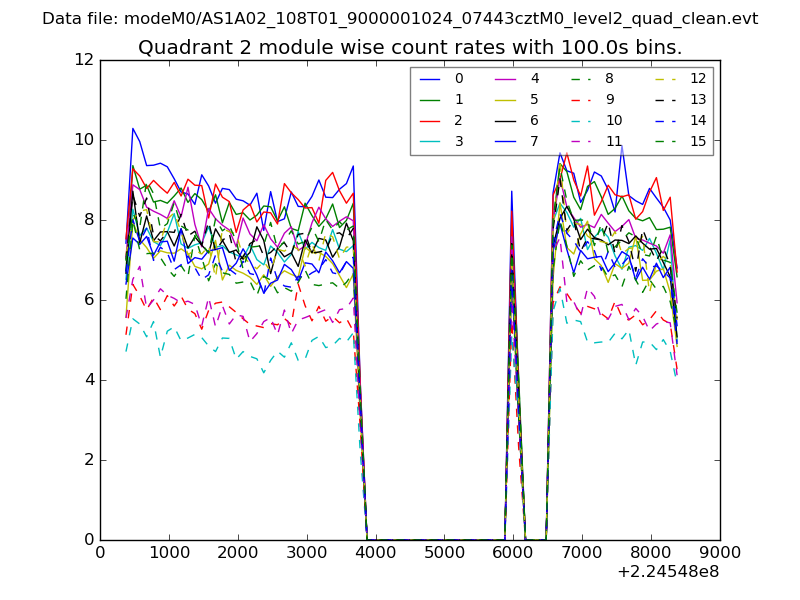
| Module-wise count rates for Quadrant B Data is divided into 100 sec bins |
 |
 |
| Module-wise count rates for Quadrant C Data is divided into 100 sec bins |
 |
 |
| Module-wise count rates for Quadrant D Data is divided into 100 sec bins |
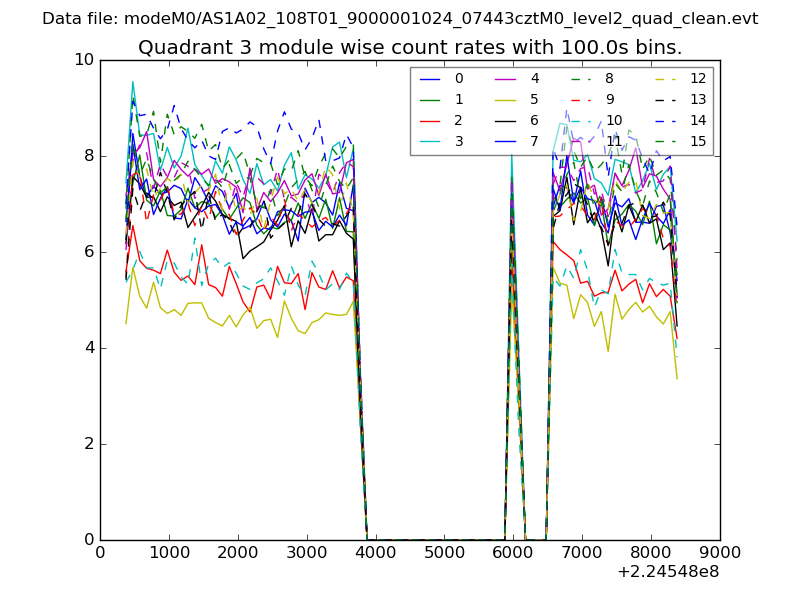 |
 |
| Parameter | Plot |
|---|---|
| CZT HV Monitor | 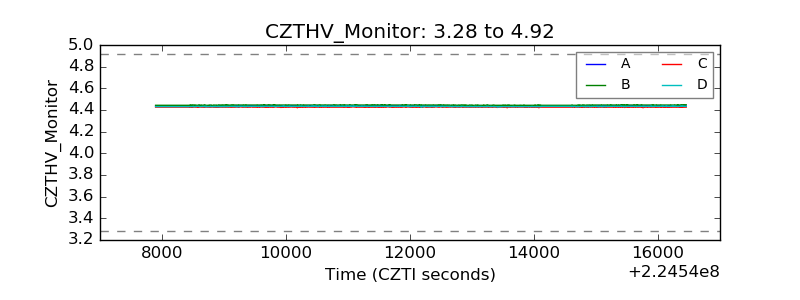 |
| D_VDD | 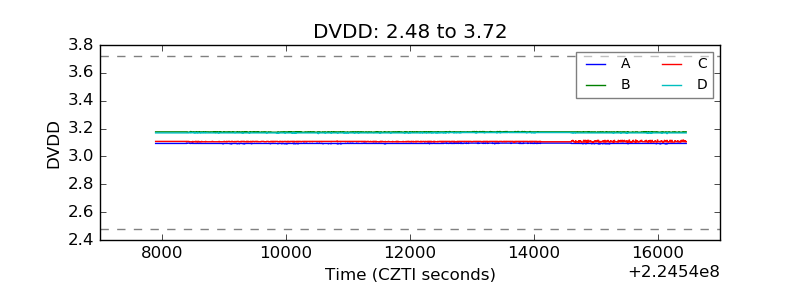 |
| Temperature 1 | 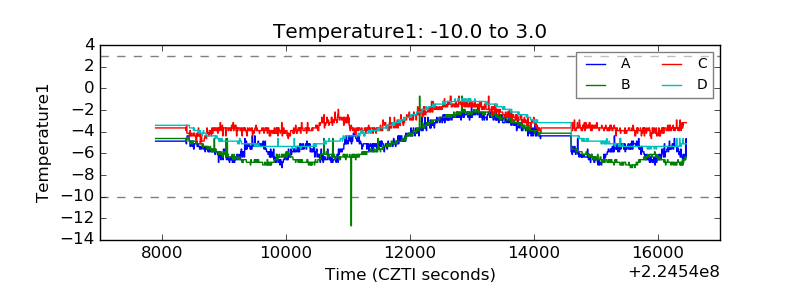 |
| Veto HV Monitor | 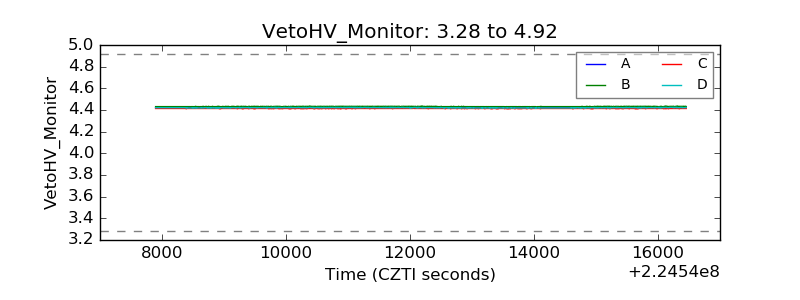 |
| Veto LLD | 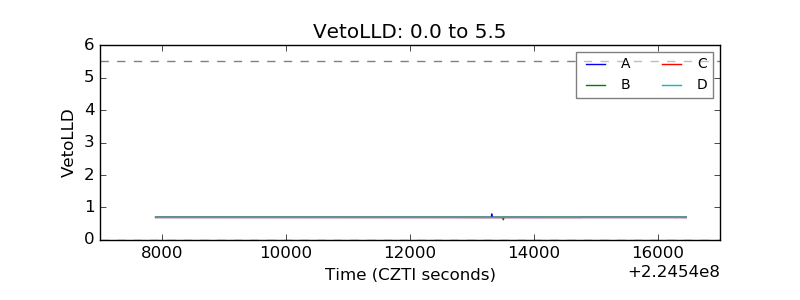 |
| Alpha Counter | 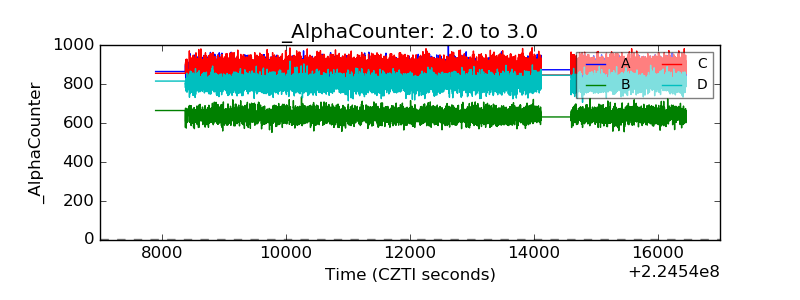 |
| _CPM_Rate | 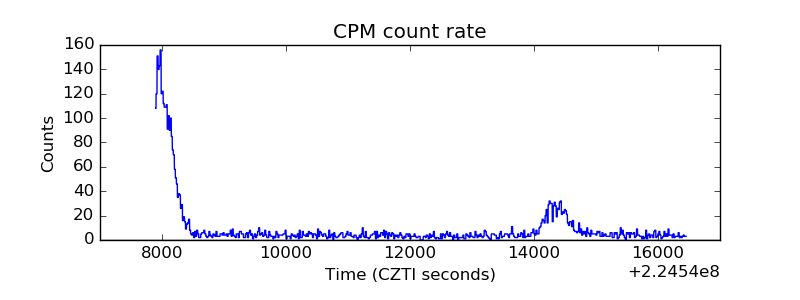 |
| CZT Counter | 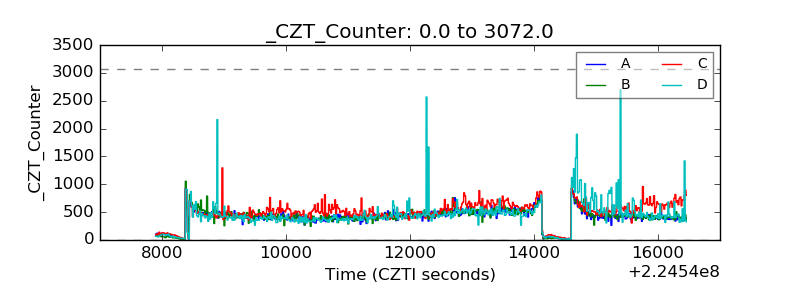 |
| +2.5 Volts monitor |  |
| +5 Volts monitor |  |
| _ROLL_ROT | 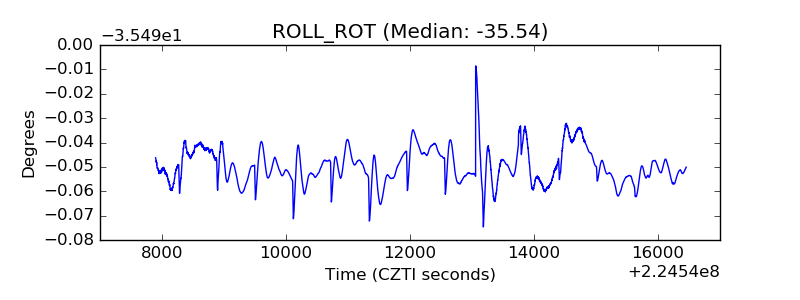 |
| _Roll_DEC | 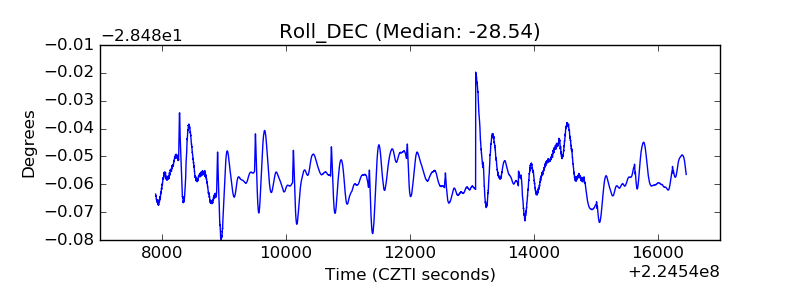 |
| _Roll_RA | 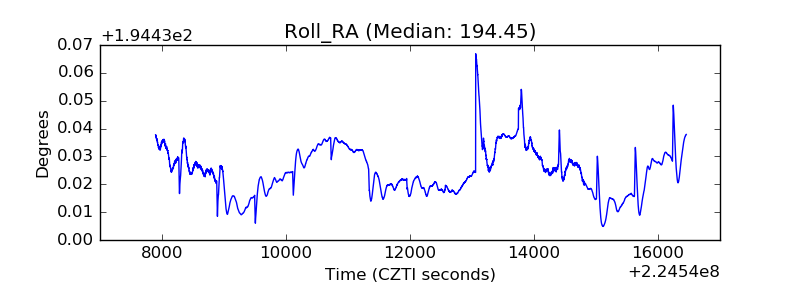 |
| Veto Counter | 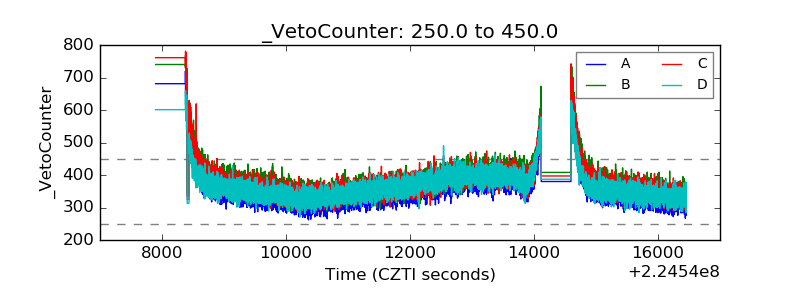 |