| Param | Original file | Final file |
|---|---|---|
| Filename | modeM0/AS1A02_108T01_9000001024_07444cztM0_level2.evt | modeM0/AS1A02_108T01_9000001024_07444cztM0_level2_quad_clean.evt |
| Size (bytes) | 521,291,520 | 101,528,640 |
| Size | 497.1 MB | 96.8 MB |
| Events in quadrant A | 3,448,535 | 641,747 |
| Events in quadrant B | 3,593,874 | 654,829 |
| Events in quadrant C | 4,412,838 | 634,054 |
| Events in quadrant D | 3,812,432 | 611,566 |
| Mode SS | |||
|---|---|---|---|
| Quadrant | BADHDUFLAG | Total packets | Discarded packets |
| A | 0 | 156 | 0 |
| B | 0 | 156 | 0 |
| C | 0 | 156 | 0 |
| D | 0 | 156 | 0 |
| Mode M9 | |||
|---|---|---|---|
| Quadrant | BADHDUFLAG | Total packets | Discarded packets |
| A | 0 | 2 | 0 |
| B | 0 | 2 | 0 |
| C | 0 | 2 | 0 |
| D | 0 | 2 | 0 |
| Mode M0 | |||
|---|---|---|---|
| Quadrant | BADHDUFLAG | Total packets | Discarded packets |
| A | 0 | 15687 | 2 |
| B | 0 | 15963 | 1 |
| C | 0 | 18180 | 1 |
| D | 0 | 16760 | 1 |
| Quadrant | Total seconds | Saturated seconds | Saturation percentage |
|---|---|---|---|
| A | 7653 | 37 | 0.483471% |
| B | 7653 | 72 | 0.940808% |
| C | 7653 | 84 | 1.097609% |
| D | 7653 | 91 | 1.189076% |
Noise dominated data is calculated using 1-second bins in cleaned event files. If a bin has >2000 counts, and if more than 50% of those come from <1% of pixels, then it is considered to be noise-dominated and hence unusable.
| Quadrant | # 1 sec bins | Bins with >0 counts | Bins with >2000 counts | High rate bins dominated by noise | Noise dominated (total time) | Noise dominated (detector-on time) | Marked lightcurve |
|---|---|---|---|---|---|---|---|
| A | 7868 | 7654 | 1 | 1 | 0.01% | 0.01% |  |
| B | 7868 | 7654 | 6 | 6 | 0.08% | 0.08% |  |
| C | 7868 | 7654 | 0 | 0 | 0.00% | 0.00% |  |
| D | 7868 | 7654 | 41 | 41 | 0.52% | 0.54% |  |
Top three noisy pixels from each quadrant. If the there are fewer than three noisy pixels in the level2.evt file, extra rows are filled as -1
| Pixel properties | Quadrant properties | ||||||
|---|---|---|---|---|---|---|---|
| Quadrant | DetID | PixID | Counts | Sigma | Mean | Median | Sigma |
| A | 15 | 234 | 23131 | 122.17 | 885 | 864 | 182.3 |
| A | 15 | 239 | 17226 | 89.77 | 885 | 864 | 182.3 |
| A | 0 | 226 | 8362 | 41.14 | 885 | 864 | 182.3 |
| B | 0 | 214 | 48523 | 278.52 | 894 | 874 | 171.1 |
| B | 10 | 245 | 40124 | 229.43 | 894 | 874 | 171.1 |
| B | 4 | 170 | 19434 | 108.49 | 894 | 874 | 171.1 |
| C | 9 | 68 | 1017237 | 5030.44 | 867 | 871 | 202.0 |
| C | 8 | 128 | 7003 | 30.35 | 867 | 871 | 202.0 |
| C | 13 | 61 | 6505 | 27.89 | 867 | 871 | 202.0 |
| D | 13 | 105 | 152406 | 711.93 | 860 | 834 | 212.9 |
| D | 2 | 14 | 136139 | 635.53 | 860 | 834 | 212.9 |
| D | 1 | 52 | 133627 | 623.73 | 860 | 834 | 212.9 |
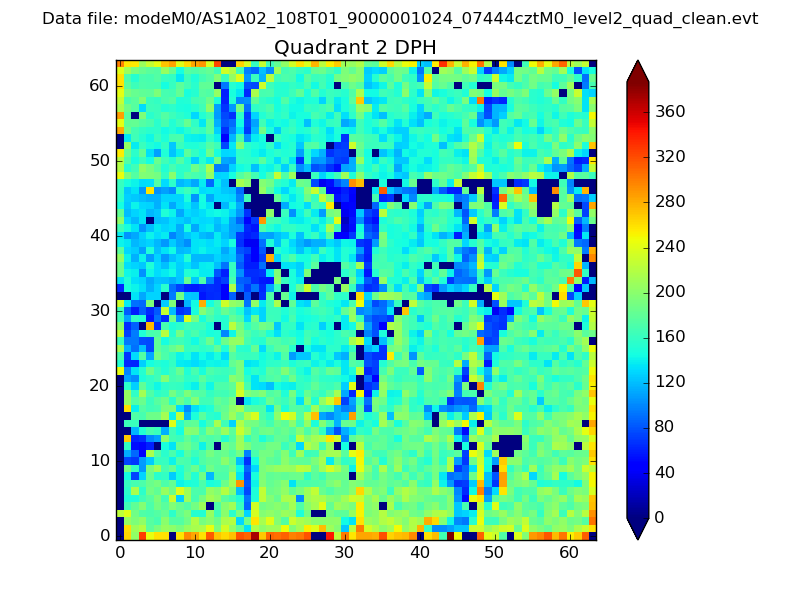
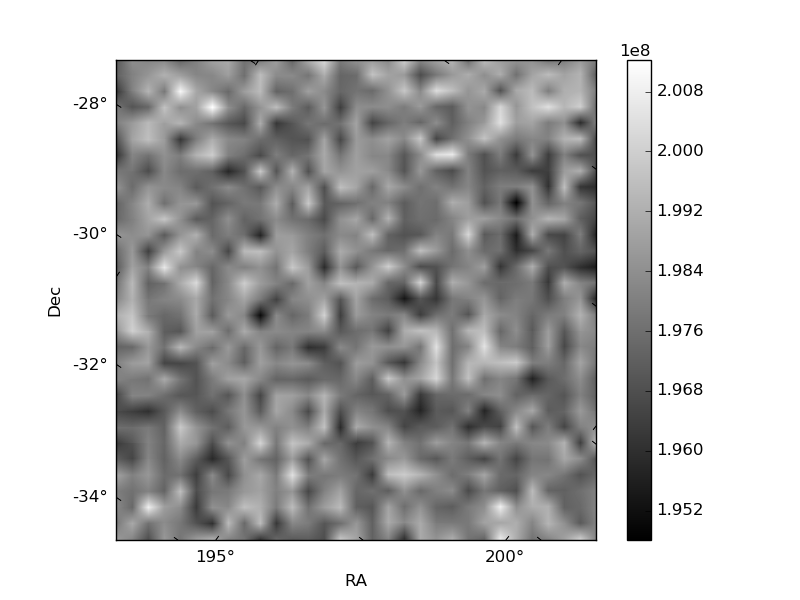
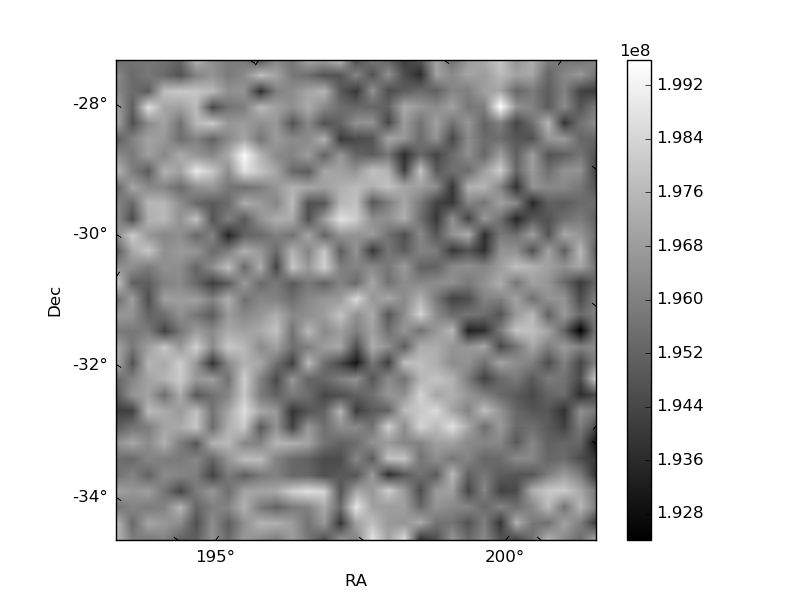
Histogram calculated using DETX and DETY for each event in the final _common_clean file
| Quadrant A | 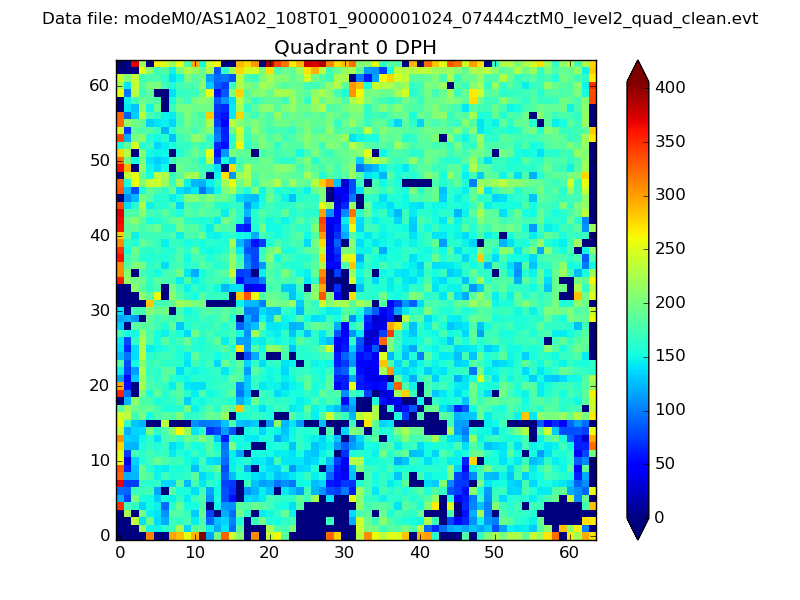 |
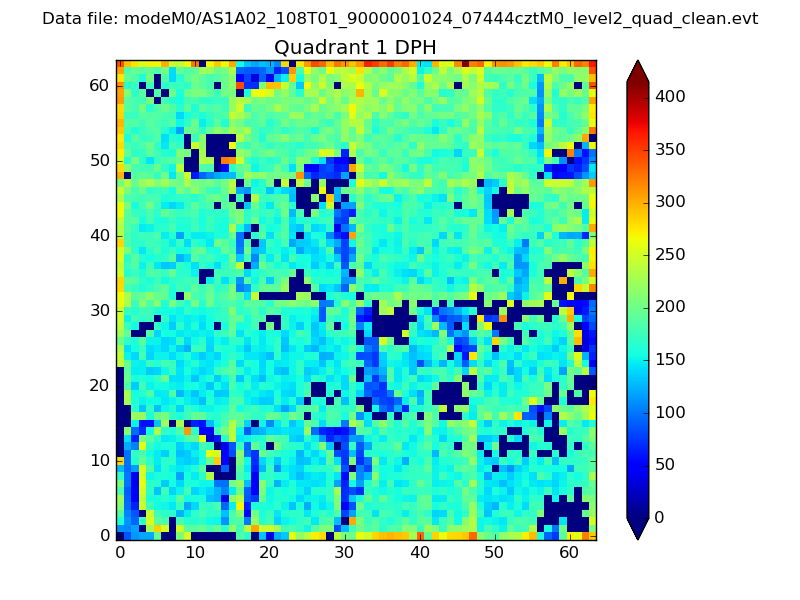 |
Quadrant B |
|---|---|---|---|
| Quadrant D | 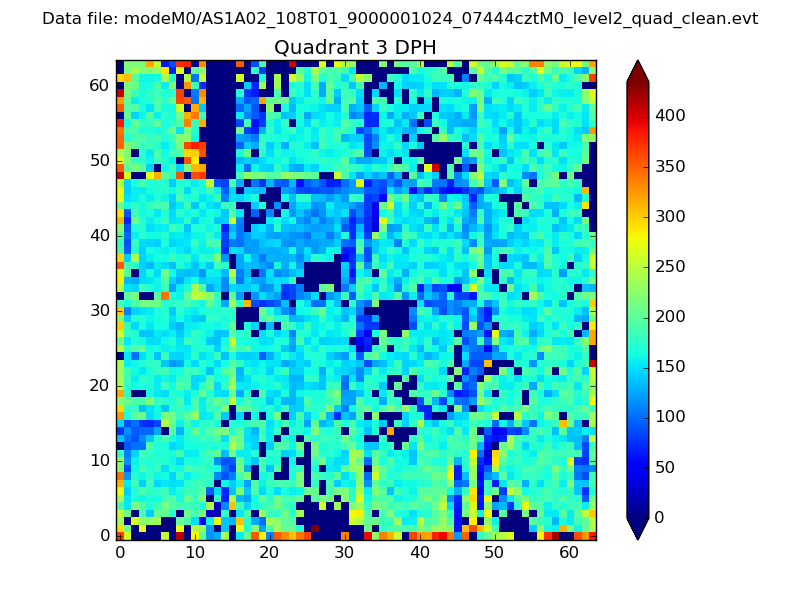 |
 |
Quadrant C |
| Plot type | Count rate plots | Images |
|---|---|---|
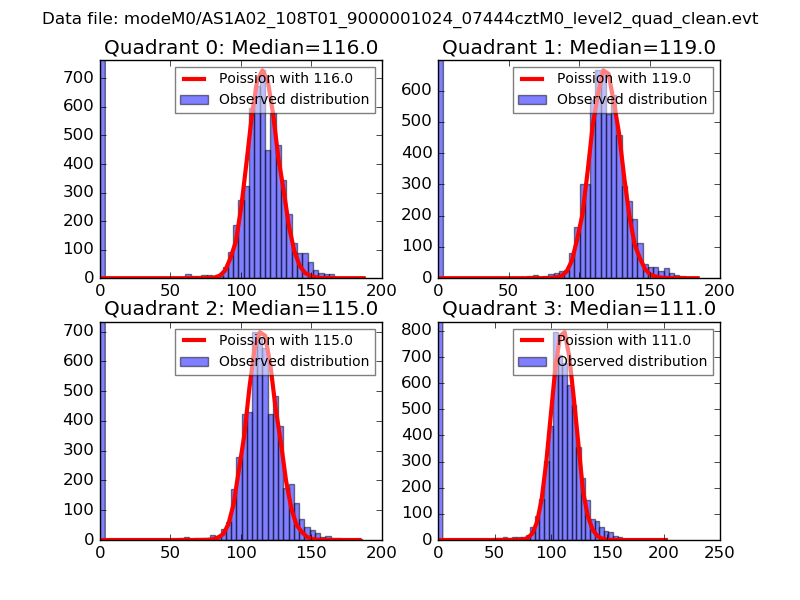
| Comparison with Poisson distribution Blue bars denote a histogram of data divided into 1 sec bins. Red curve is a Poisson curve with rate = median count rate of data. |
 |
 |
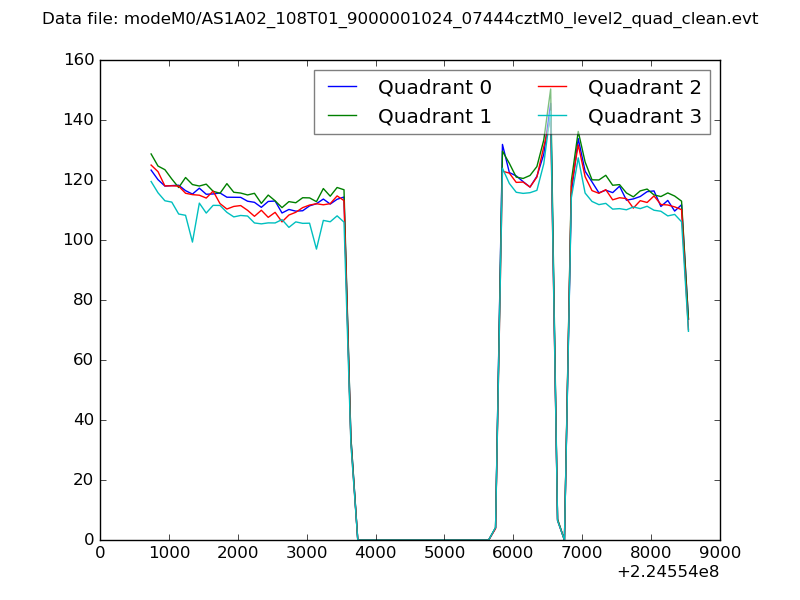
| Quadrant-wise count rates Data is divided into 100 sec bins |
 |
|
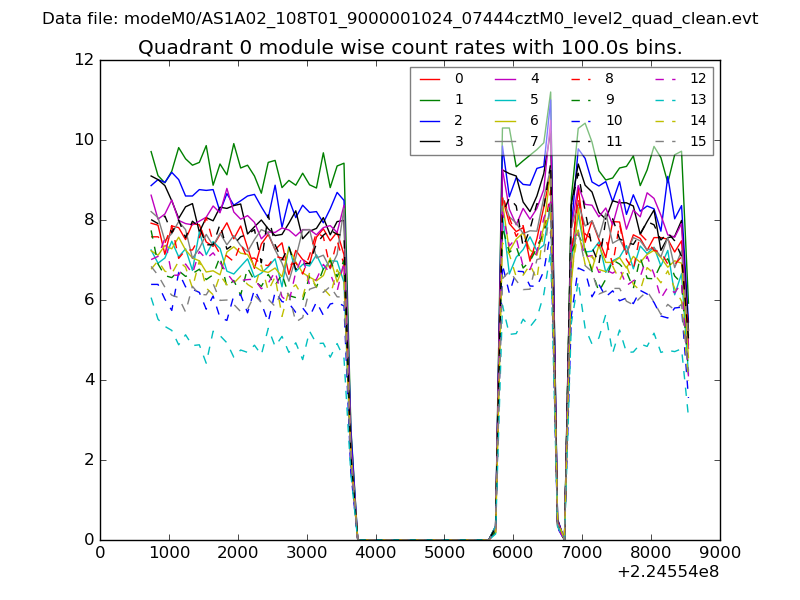
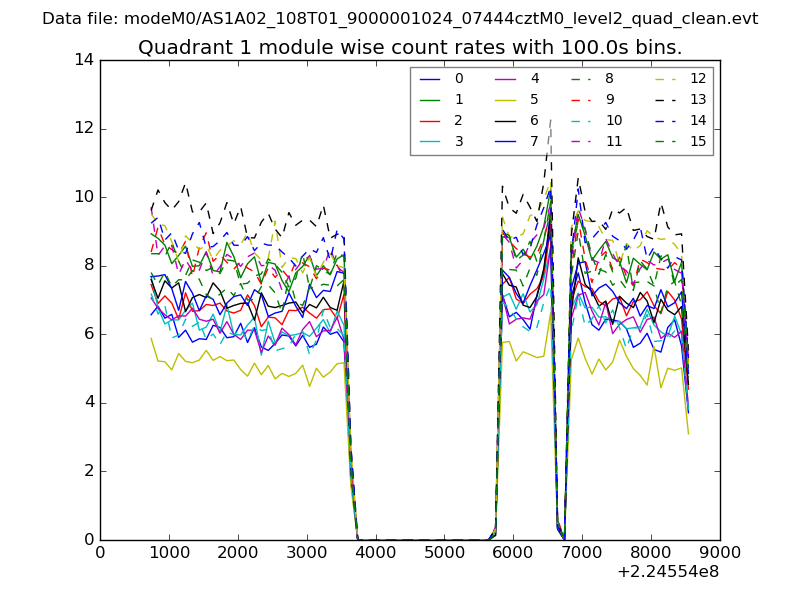
| Module-wise count rates for Quadrant A Data is divided into 100 sec bins |
 |
 |
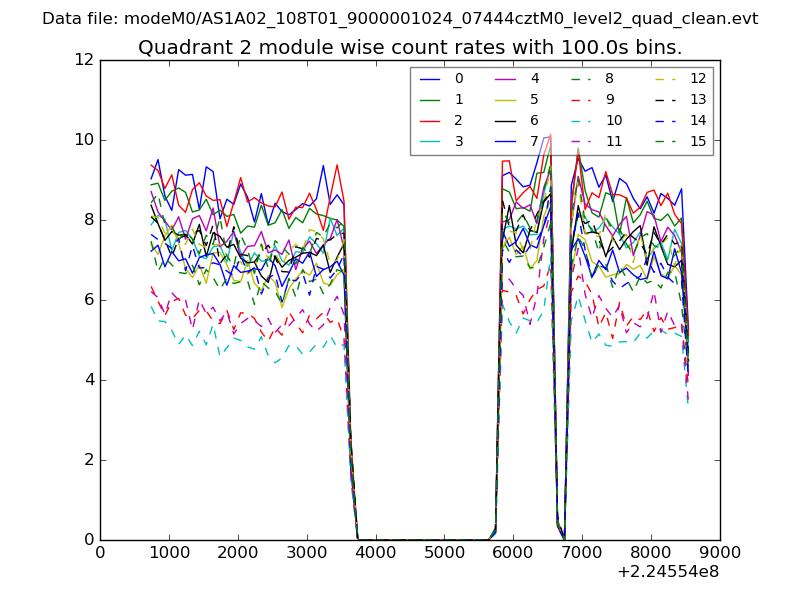
| Module-wise count rates for Quadrant B Data is divided into 100 sec bins |
 |
 |
| Module-wise count rates for Quadrant C Data is divided into 100 sec bins |
 |
 |
| Module-wise count rates for Quadrant D Data is divided into 100 sec bins |
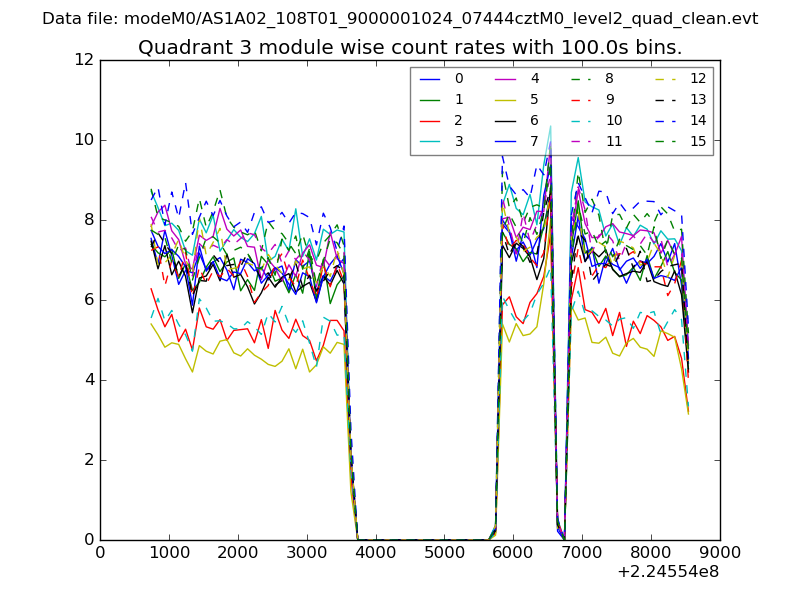 |
 |
| Parameter | Plot |
|---|---|
| CZT HV Monitor | 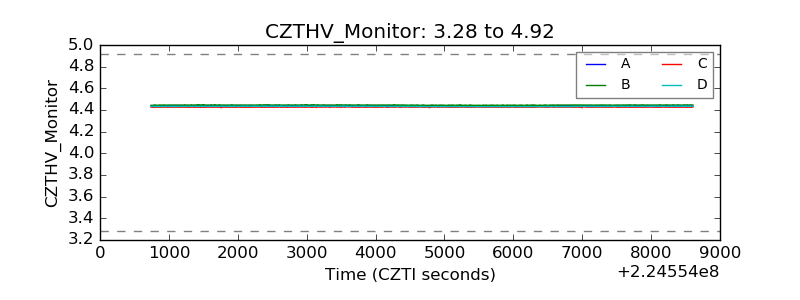 |
| D_VDD | 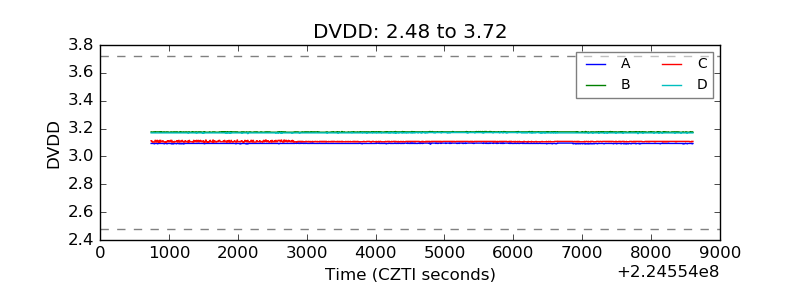 |
| Temperature 1 | 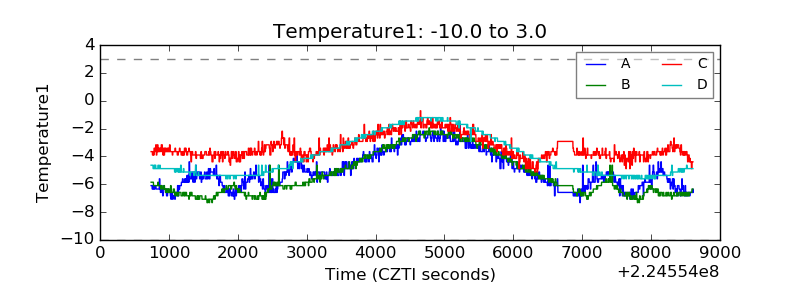 |
| Veto HV Monitor | 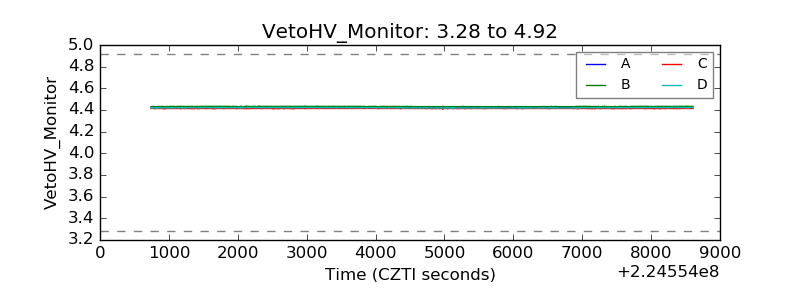 |
| Veto LLD | 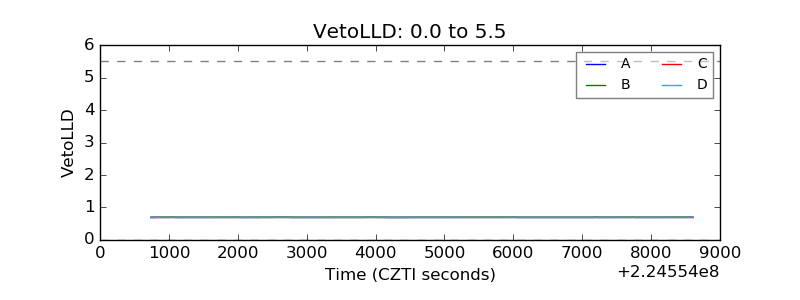 |
| Alpha Counter | 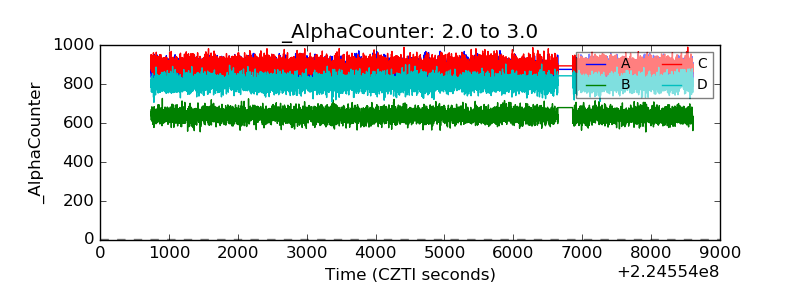 |
| _CPM_Rate | 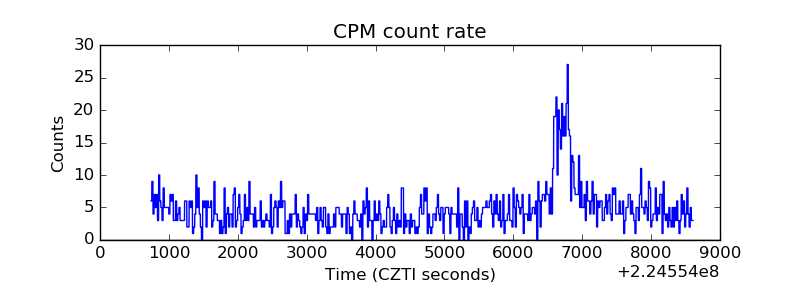 |
| CZT Counter | 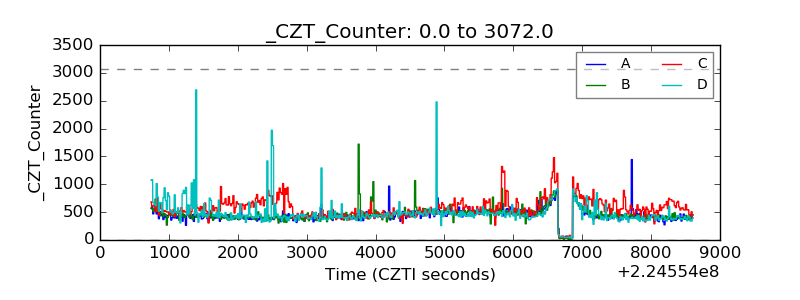 |
| +2.5 Volts monitor | 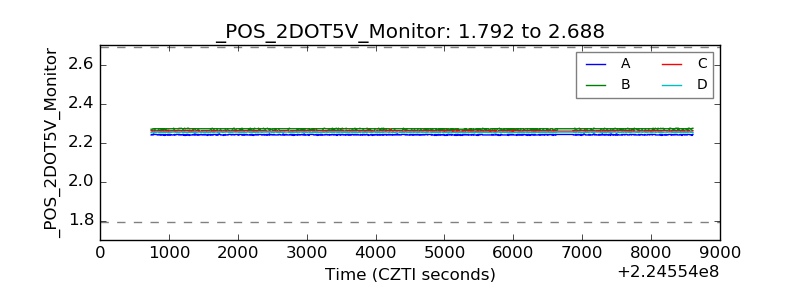 |
| +5 Volts monitor |  |
| _ROLL_ROT | 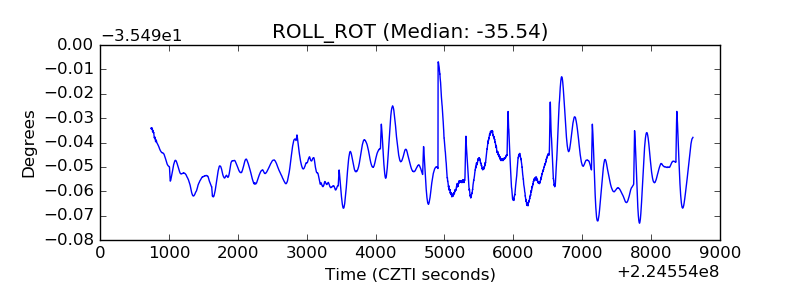 |
| _Roll_DEC | 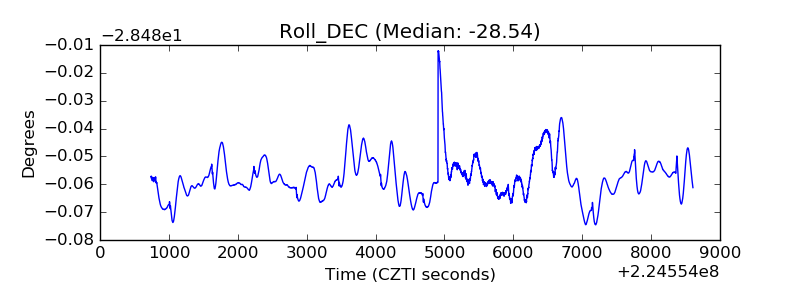 |
| _Roll_RA | 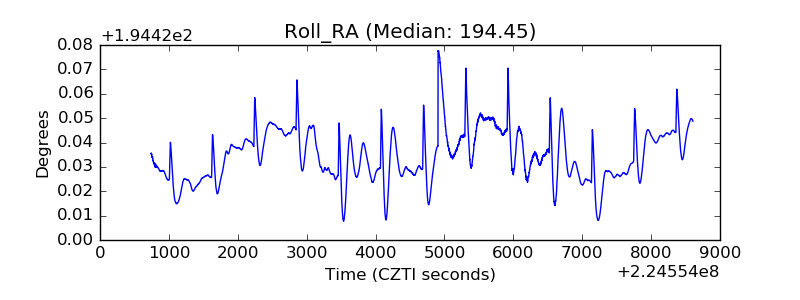 |
| Veto Counter | 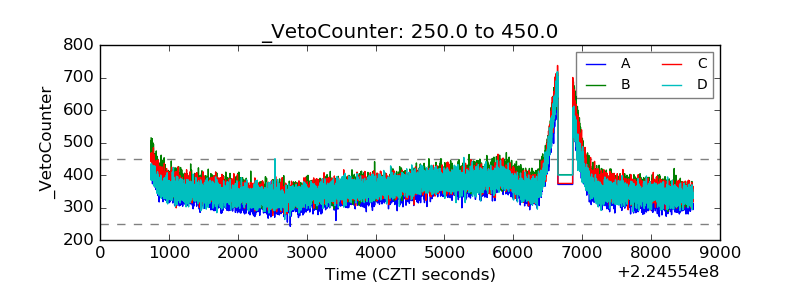 |