| Param | Original file | Final file |
|---|---|---|
| Filename | modeM0/AS1A02_108T01_9000001024_07445cztM0_level2.evt | modeM0/AS1A02_108T01_9000001024_07445cztM0_level2_quad_clean.evt |
| Size (bytes) | 581,958,720 | 118,080,000 |
| Size | 555.0 MB | 112.6 MB |
| Events in quadrant A | 3,970,977 | 749,828 |
| Events in quadrant B | 4,088,668 | 766,857 |
| Events in quadrant C | 4,867,684 | 743,685 |
| Events in quadrant D | 4,111,808 | 716,787 |
| Mode SS | |||
|---|---|---|---|
| Quadrant | BADHDUFLAG | Total packets | Discarded packets |
| A | 0 | 176 | 0 |
| B | 0 | 176 | 0 |
| C | 0 | 176 | 0 |
| D | 0 | 176 | 0 |
| Mode M9 | |||
|---|---|---|---|
| Quadrant | BADHDUFLAG | Total packets | Discarded packets |
| A | 0 | 5 | 0 |
| B | 0 | 5 | 0 |
| C | 0 | 5 | 0 |
| D | 0 | 5 | 0 |
| Mode M0 | |||
|---|---|---|---|
| Quadrant | BADHDUFLAG | Total packets | Discarded packets |
| A | 0 | 17838 | 3 |
| B | 0 | 18033 | 2 |
| C | 0 | 20091 | 2 |
| D | 0 | 18316 | 2 |
| Quadrant | Total seconds | Saturated seconds | Saturation percentage |
|---|---|---|---|
| A | 8627 | 113 | 1.309841% |
| B | 8627 | 152 | 1.761910% |
| C | 8627 | 167 | 1.935783% |
| D | 8627 | 113 | 1.309841% |
Noise dominated data is calculated using 1-second bins in cleaned event files. If a bin has >2000 counts, and if more than 50% of those come from <1% of pixels, then it is considered to be noise-dominated and hence unusable.
| Quadrant | # 1 sec bins | Bins with >0 counts | Bins with >2000 counts | High rate bins dominated by noise | Noise dominated (total time) | Noise dominated (detector-on time) | Marked lightcurve |
|---|---|---|---|---|---|---|---|
| A | 9132 | 8629 | 1 | 1 | 0.01% | 0.01% | 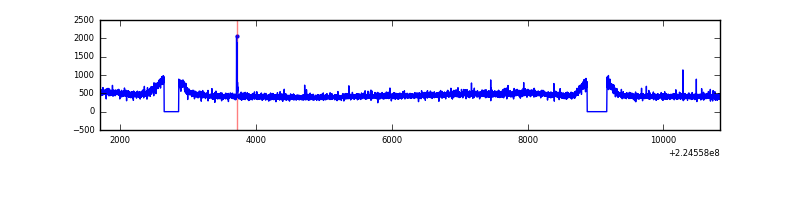 |
| B | 9132 | 8629 | 1 | 1 | 0.01% | 0.01% | 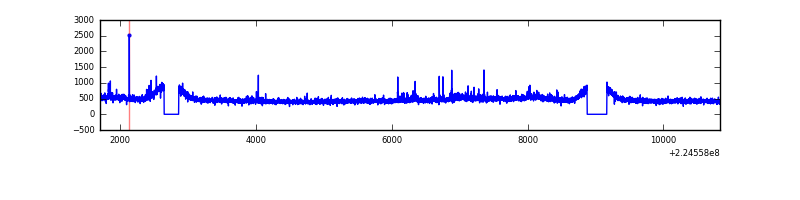 |
| C | 9132 | 8629 | 0 | 0 | 0.00% | 0.00% | 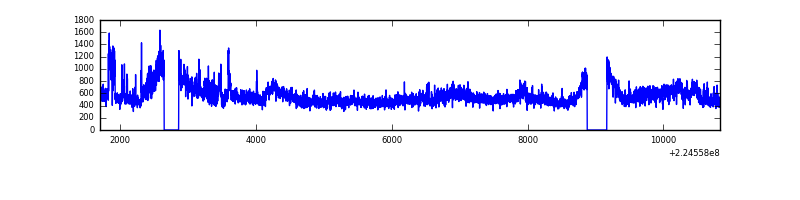 |
| D | 9132 | 8629 | 5 | 5 | 0.05% | 0.06% | 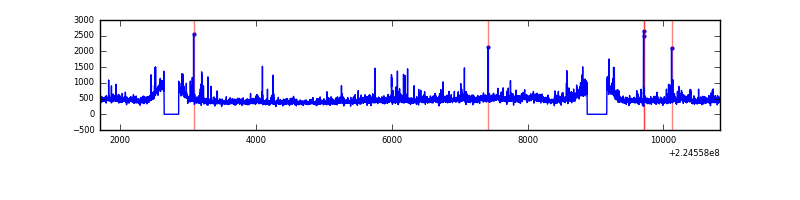 |
Top three noisy pixels from each quadrant. If the there are fewer than three noisy pixels in the level2.evt file, extra rows are filled as -1
| Pixel properties | Quadrant properties | ||||||
|---|---|---|---|---|---|---|---|
| Quadrant | DetID | PixID | Counts | Sigma | Mean | Median | Sigma |
| A | 15 | 234 | 25954 | 118.28 | 1023 | 999 | 211.0 |
| A | 0 | 226 | 9602 | 40.78 | 1023 | 999 | 211.0 |
| A | 12 | 194 | 9088 | 38.34 | 1023 | 999 | 211.0 |
| B | 0 | 214 | 49080 | 241.95 | 1031 | 1004 | 198.7 |
| B | 12 | 111 | 21203 | 101.65 | 1031 | 1004 | 198.7 |
| B | 4 | 81 | 17949 | 85.28 | 1031 | 1004 | 198.7 |
| C | 9 | 68 | 958874 | 4097.97 | 1001 | 1005 | 233.7 |
| C | 13 | 61 | 7736 | 28.8 | 1001 | 1005 | 233.7 |
| C | 12 | 4 | 3245 | 9.58 | 1001 | 1005 | 233.7 |
| D | 13 | 105 | 98978 | 400.92 | 996 | 966 | 244.5 |
| D | 2 | 14 | 71473 | 288.41 | 996 | 966 | 244.5 |
| D | 1 | 52 | 53549 | 215.09 | 996 | 966 | 244.5 |
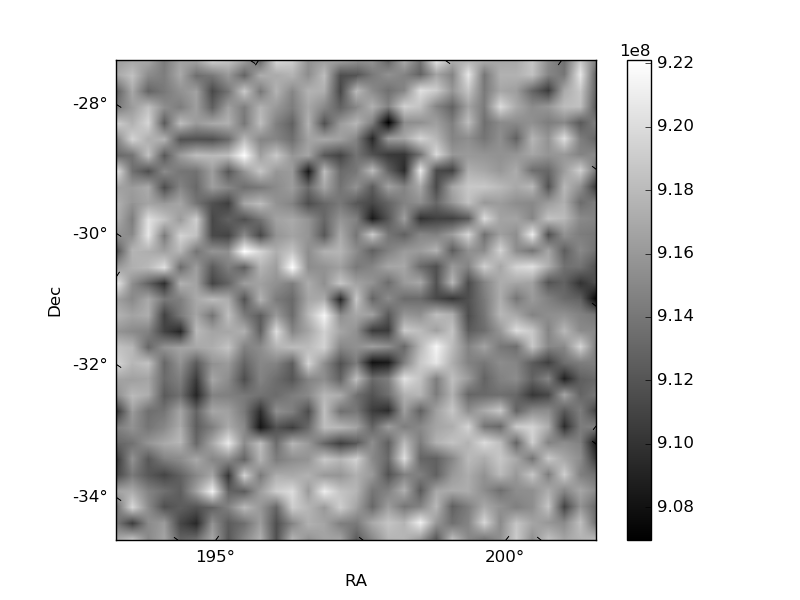
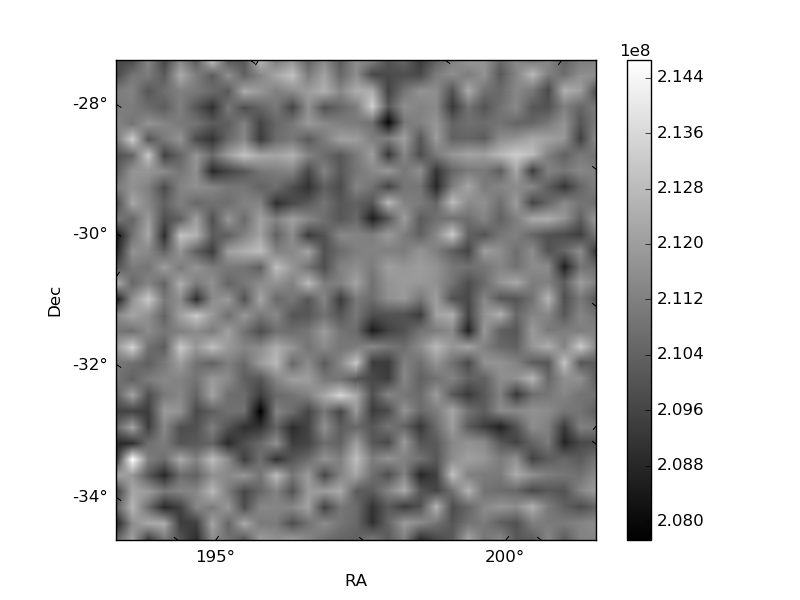
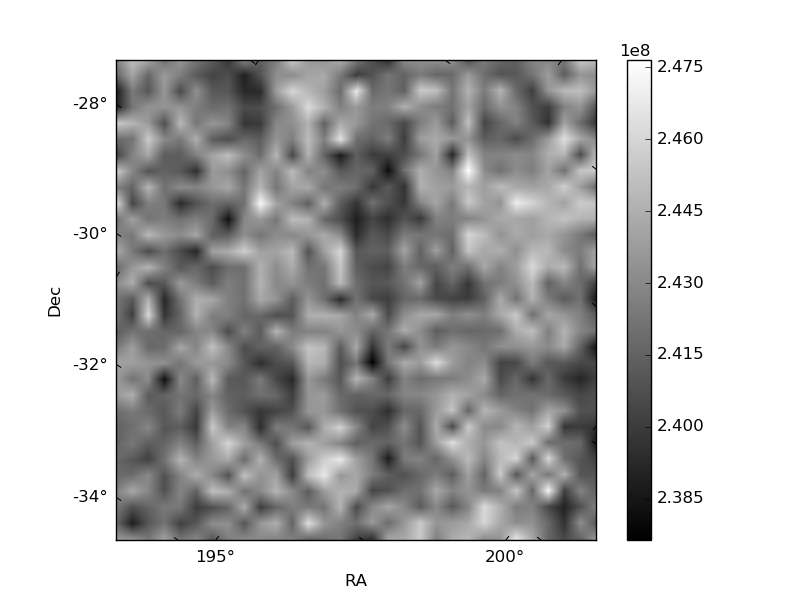
Histogram calculated using DETX and DETY for each event in the final _common_clean file
| Quadrant A | 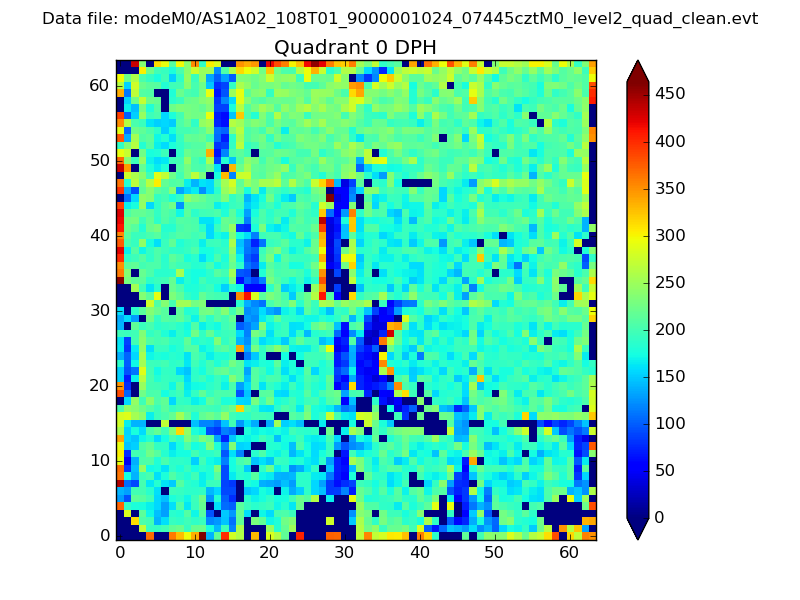 |
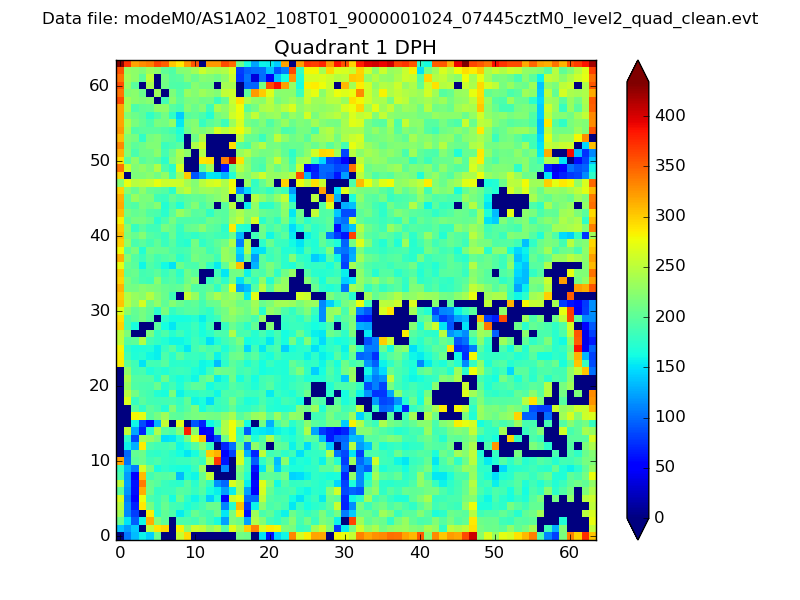 |
Quadrant B |
|---|---|---|---|
| Quadrant D | 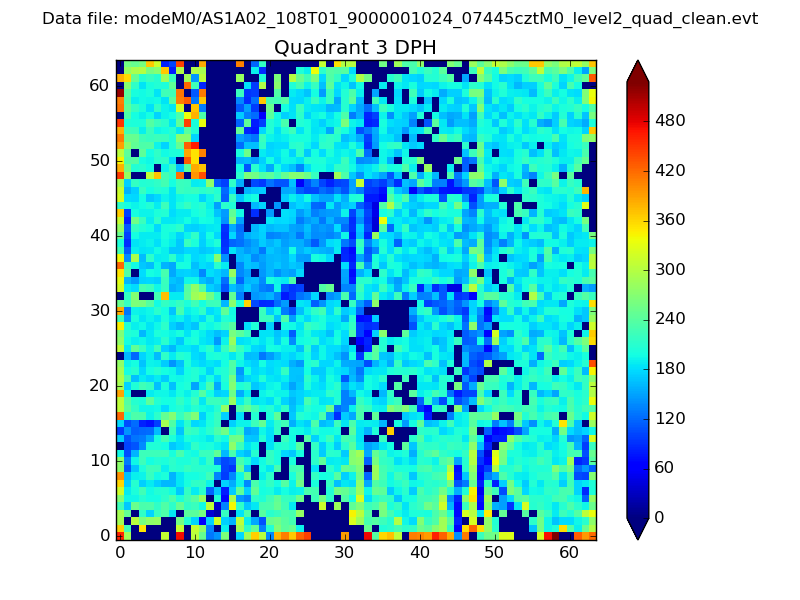 |
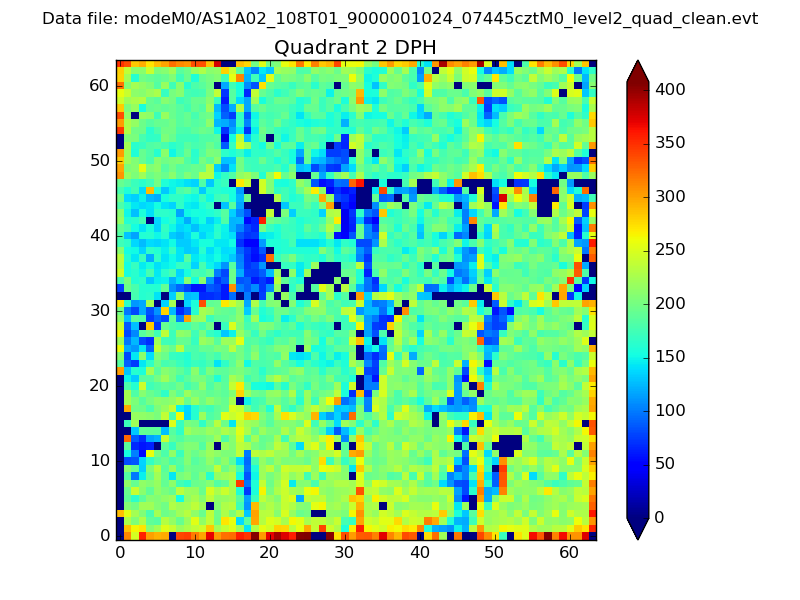 |
Quadrant C |
| Plot type | Count rate plots | Images |
|---|---|---|
| Comparison with Poisson distribution Blue bars denote a histogram of data divided into 1 sec bins. Red curve is a Poisson curve with rate = median count rate of data. |
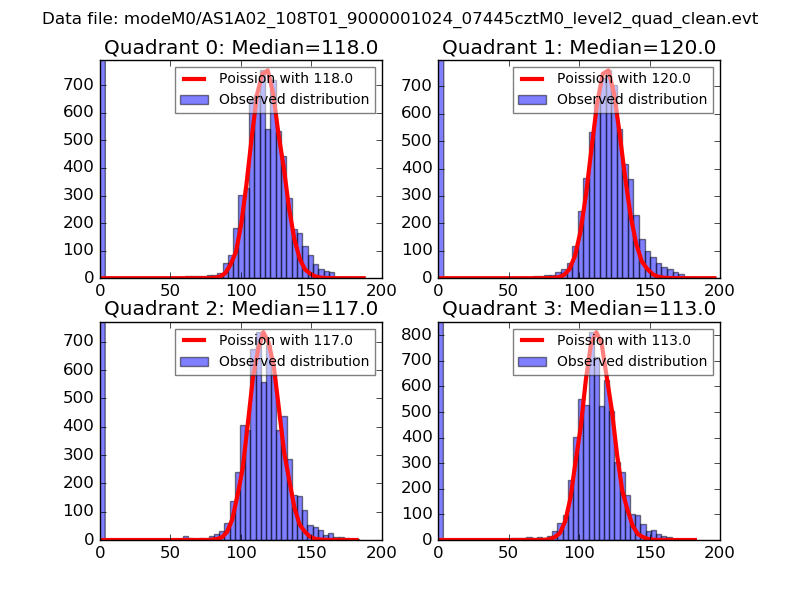 |
 |
| Quadrant-wise count rates Data is divided into 100 sec bins |
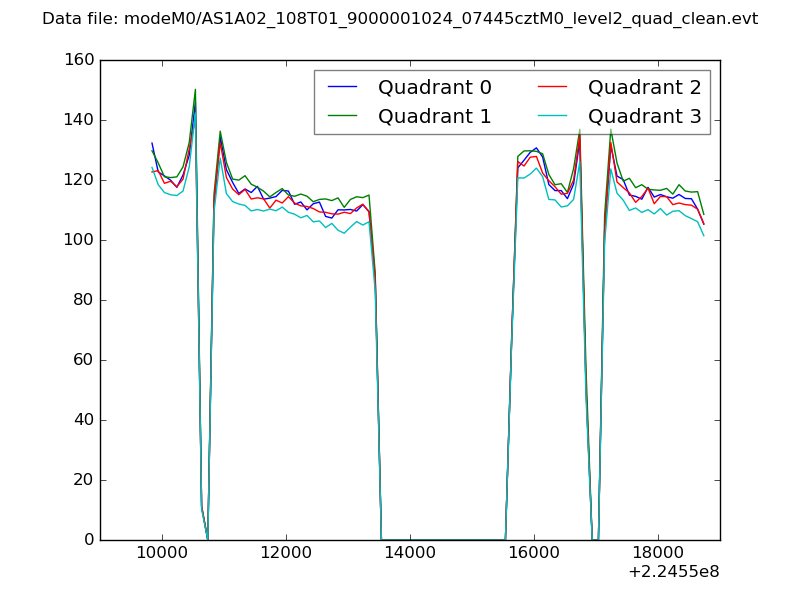 |
|
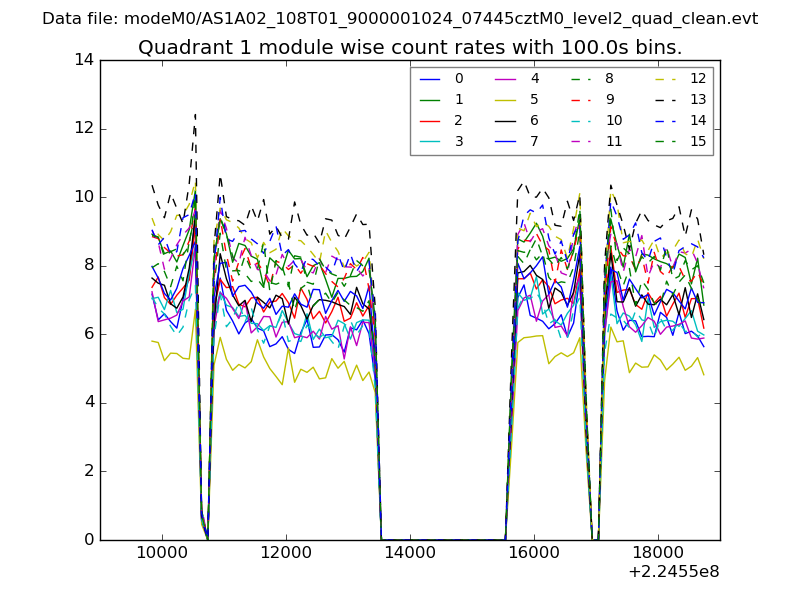
| Module-wise count rates for Quadrant A Data is divided into 100 sec bins |
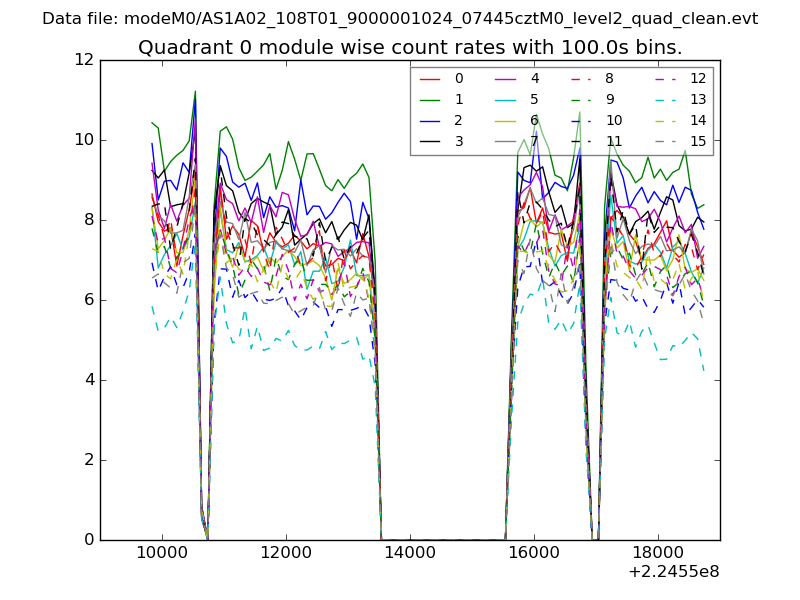 |
 |
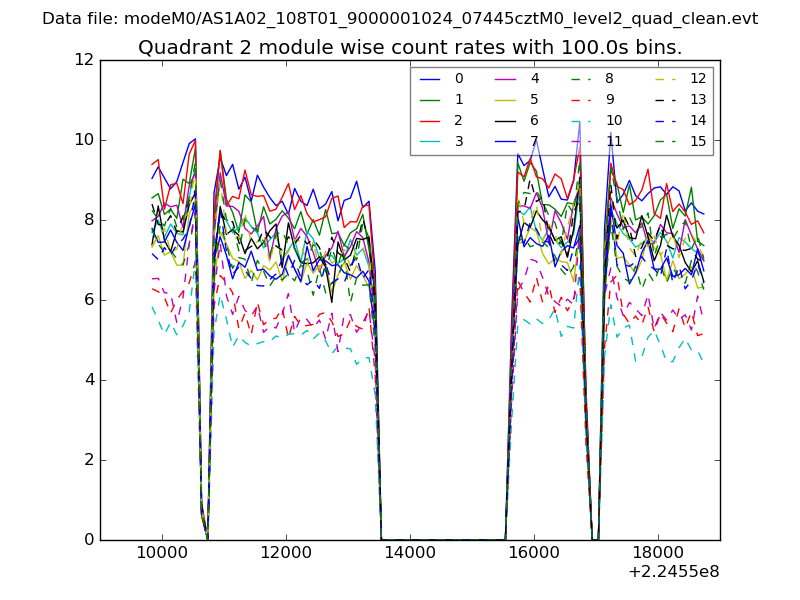
| Module-wise count rates for Quadrant B Data is divided into 100 sec bins |
 |
 |
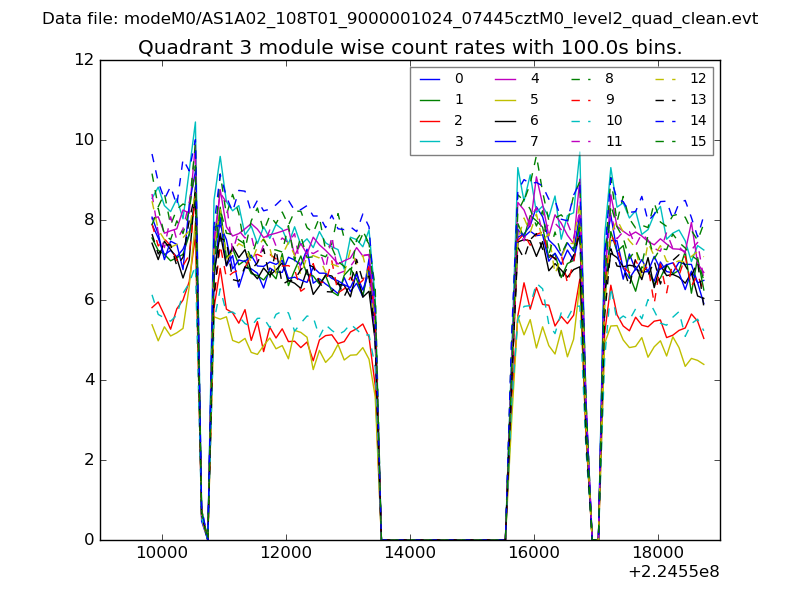
| Module-wise count rates for Quadrant C Data is divided into 100 sec bins |
 |
 |
| Module-wise count rates for Quadrant D Data is divided into 100 sec bins |
 |
 |
| Parameter | Plot |
|---|---|
| CZT HV Monitor | 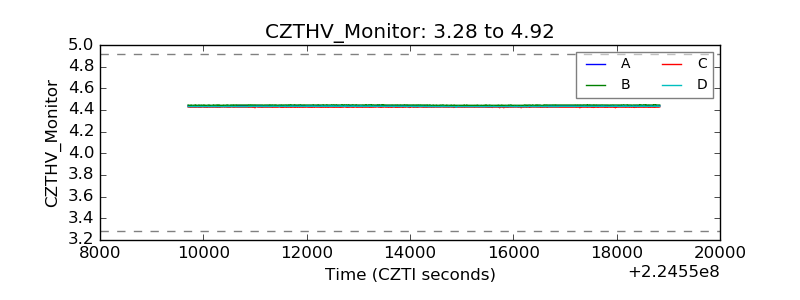 |
| D_VDD | 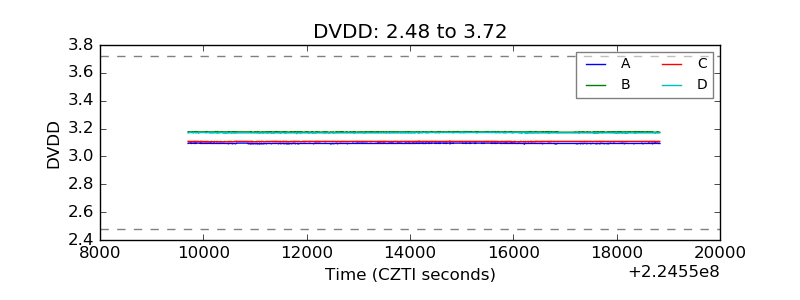 |
| Temperature 1 | 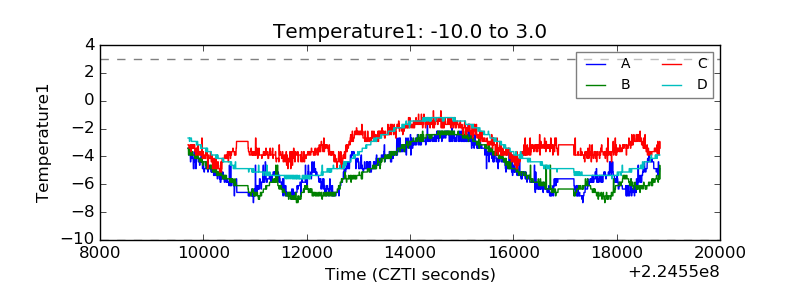 |
| Veto HV Monitor | 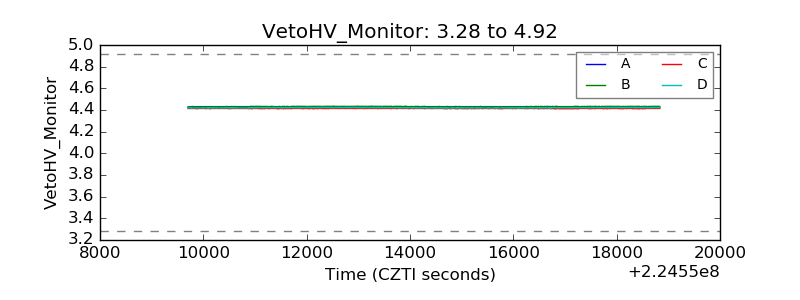 |
| Veto LLD | 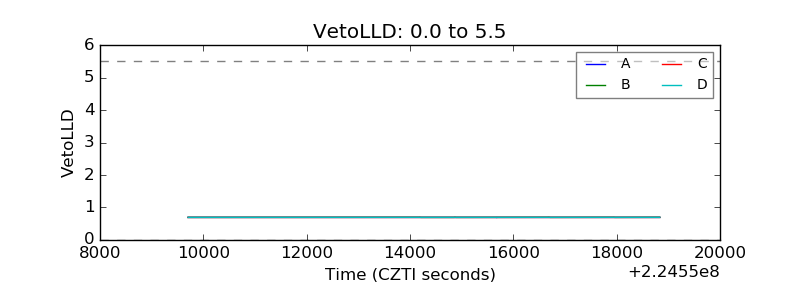 |
| Alpha Counter | 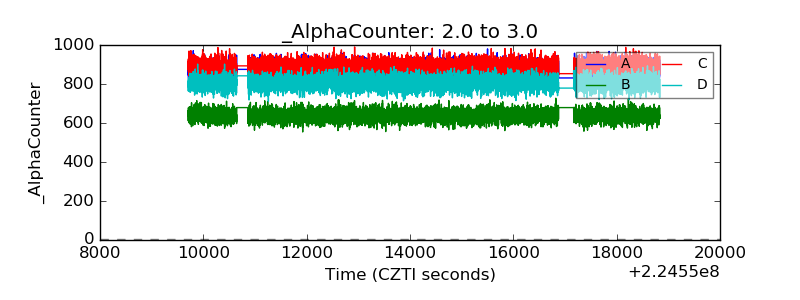 |
| _CPM_Rate | 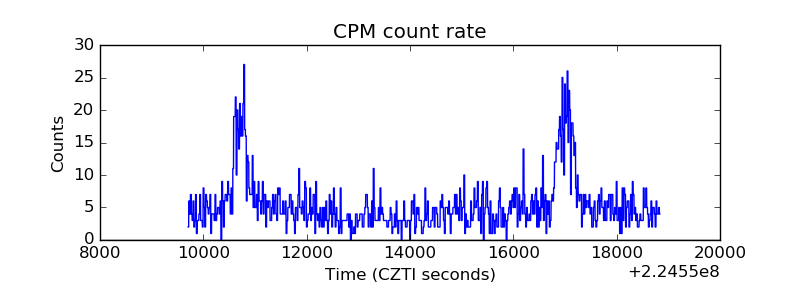 |
| CZT Counter | 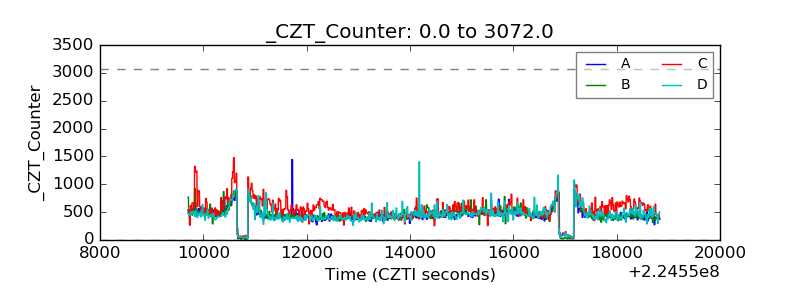 |
| +2.5 Volts monitor | 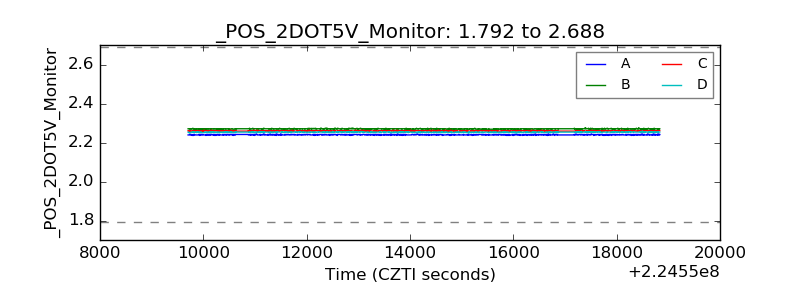 |
| +5 Volts monitor |  |
| _ROLL_ROT | 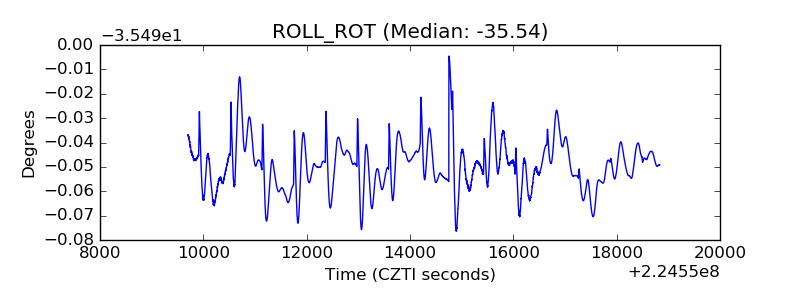 |
| _Roll_DEC |  |
| _Roll_RA | 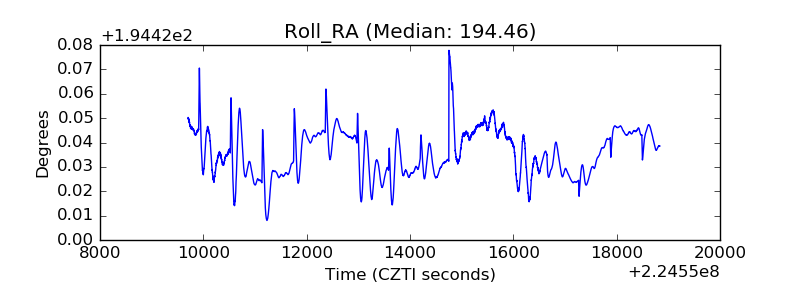 |
| Veto Counter | 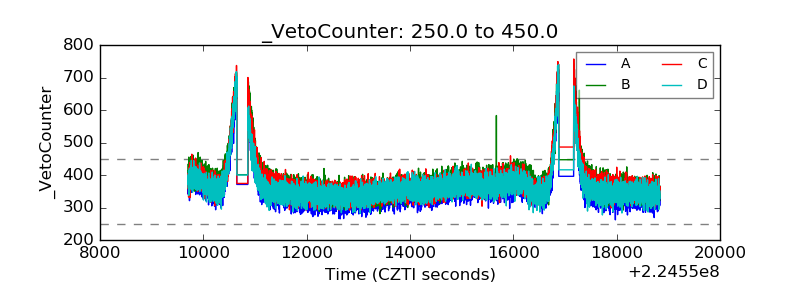 |